Autorização para disponibilização concedida ao Repositório Institucional da Universidade de Brasília (RIUnB) pelo Núcleo de Estudos Agrários e Desenvolvimento Rural do Ministério do Desenvolvimento Agrário, responsável pela publicação da obra, com as seguintes condições: disponível sob Licença Creative Commons 3.0, que permite copiar, distribuir e transmitir o trabalho, desde que seja citado o autor e licenciante. Não permite o uso para fins comerciais nem a adaptação desta.
Granted authorization to release the Institutional Repository of the University of Brasilia (RIUnB) by the Center for Agrarian Studies and Rural Development of the Ministry of Agrarian Development, responsible for the publication of the work under the following conditions: available under Creative Commons 3.0 License, which allows you to copy, distribute and transmit the work, provided that the author and licensor is mentioned. Can not use for commercial purposes nor adaptation.
Referência
FRANÇA, Caio Galvão de; DEL GROSSI, Mauro Eduardo; MARQUES, Vicente P. M. de Azevedo. Family Farming and the 2006 Brazilian Agriculture/Livestock Census. Brasília: MDA, 2009. 95 p. Disponível em: <http://www.nead.gov.br/portal/nead/nead-debate/>. Acesso em: 2 dez. 2013.
LUIZ INÁCIO LULA DA SILVA President of the Republic GUILHERME CASSEL
Minister for Agrarian Development DANIEL MAIA
Deputy Minister for Agrarian Development ROLF HACKBART
President of the National Institute for Colonization and Land Reform
ADONIRAM SANCHES PERACI Secretary for Family Farming ADHEMAR LOPES DE ALMEIDA Secretary for Land Reorganization JOSÉ HUMBERTO OLIVEIRA Secretary for Territorial Development JOAQUIM CALHEIROS SORIANO
Coordinator of the Center for Agrarian Studies and Rural Development (NEAD)
VINICIUS MACÁRIO
Executive-Coordinator of the Center for Agrarian Studies and Rural Development (NEAD)
NEAD Debate 18 Copyright 2009 MDA
MINISTÉRIO DO DESENVOLVIMENTO AGRÁRIO (MDA) www.mda.gov.br
NÚCLEO DE ESTUDOS AGRÁRIOS E DESENVOLVIMENTO RURAL (NEAD)
SBN, Quadra 2, Edifício Sarkis - Bloco D – loja 10 – sala S2 - Cep: 70.040-910
Brasília/DF
Telefone: (61) 2020 0189 www.nead.org.br
F814c
França, Caio Galvão de
Family Farming and the 2006 Brazilian Agriculture/Livestock Census / Caio Galvão de França; Mauro Eduardo Del Grossi; Vicente P. M. de Azevedo Marques. – Brasília: MDA, 2009.
96p.; 20cm.
ISBN: 978-85-60548-57-6
1. Agricultural – Statistics- Brazil. 2. Family Farming – Statistics - Brasil. I. França, Caio Galvão de. II. Del Grossi, Mauro Eduardo. III. Marques, Vicente P. M de Azevedo. IV. Ministry of Agrarian Development. V. Título.
Caio Galvão de França Mauro Eduardo Del Grossi Vicente P. M. de Azevedo Marques
MDA Brasília, 2009
SUMMARY
1. PRESENTATION 9
2. THE NEW DIMENSIONS OF THE 2006
AGRICULTURE/LIVESTOCK CENSUS 10
3. CONTEXT AND GENERAL INDICATORS 13
4. METHODOLOGICAL CHANGES 16
5. FAMILY FARMING IN 2006 17
5.1. Methodology: variables used 18
5.2. Family establishments 20
5.3. Land Use 24
5.4. Livestock and vegetable production 26
5.5. Producer’s situation in relation to the Land 29
5.6. Employment 31
5.7. Income and value of production 33
6. CONCLUSIONS 38
BIBLIOGRAPHY 40
FAMILY FARMING AND THE 2006
BRAZILIAN AGRICULTURE/LIVESTOCK CENSUS
1Caio Galvão de França2 Mauro Eduardo Del Grossi3 Vicente P. M. de Azevedo Marques4
1.PRESENTATION
On September 30, 2009, the Brazilian Institute for Geography and Statistics (IBGE) released the 2006 Agriculture/Livestock Census data with a press conference in which representatives of the Ministry of Planning, Budget and Management (MPOG), Ministry of Agriculture, Livestock and Supply (MAPA) and the Ministry of Agrarian Development (MDA) participated. This fact reveals the importance of data for the improvement of public policies for rural development.
In an unprecedented manner, in addition to the release of the Agriculture/ Livestock Census Report in 2006: Brazil, Regions and Federative Units, the special issue on “Family Farming: Early Results” was presented – the report is a result of the cooperation between MDA and IBGE.
The publication aroused and will continue to arouse public debate about the current situation of Brazilian agriculture, and will also subsidize the analysis of rural development policies, especially the policy for agrarian reform, agricultural policies and, in particular, differentiated policies for family farming. The debate should also cover other issues that are already on the agenda such as the expansion of agriculture in the Amazon Region and its impact on deforestation, poverty reduction, and social and regional inequalities, child labor, among others.
This debate will feed other official statistics, in particular the National Household Sample Survey - PNAD, recently published by IBGE. Being an annual survey, PNAD allows the examination of the development of information on subjects such as employment, income, access to land, among others, in the period between the two Agriculture/Livestock censuses, allowing the quantification of tendencies beyond the situation pictured by the Census.
During the period of 10 years between the Agriculture/Livestock Censuses, Brazilian agriculture has undergone major transformations: the expansion and consolidation of the production in the Central-West Region; the expansion of
1 The authors acknowledge the contributions of Rafael Cedro, Laudemir Muller, Adoniram Sanches and Silvia Pavesi. 2 Master in Sociology, Head of Cabinet of Ministry of Agrarian Development.
3 Doctor in Economics, Professor of the University of Brasilia and Special Advisor to the Ministry of Agrarian Development.
9
FAMILY FARMING AND THE 2006
BRAZILIAN AGRICULTURE/LIVESTOCK CENSUS
1Caio Galvão de França2 Mauro Eduardo Del Grossi3 Vicente P. M. de Azevedo Marques4
1.PRESENTATION
On September 30, 2009, the Brazilian Institute for Geography and Statistics (IBGE) released the 2006 Agriculture/Livestock Census data with a press conference in which representatives of the Ministry of Planning, Budget and Management (MPOG), Ministry of Agriculture, Livestock and Supply (MAPA) and the Ministry of Agrarian Development (MDA) participated. This fact reveals the importance of data for the improvement of public policies for rural development.
In an unprecedented manner, in addition to the release of the Agriculture/ Livestock Census Report in 2006: Brazil, Regions and Federative Units, the special issue on “Family Farming: Early Results” was presented – the report is a result of the cooperation between MDA and IBGE.
The publication aroused and will continue to arouse public debate about the current situation of Brazilian agriculture, and will also subsidize the analysis of rural development policies, especially the policy for agrarian reform, agricultural policies and, in particular, differentiated policies for family farming. The debate should also cover other issues that are already on the agenda such as the expansion of agriculture in the Amazon Region and its impact on deforestation, poverty reduction, and social and regional inequalities, child labor, among others.
This debate will feed other official statistics, in particular the National Household Sample Survey - PNAD, recently published by IBGE. Being an annual survey, PNAD allows the examination of the development of information on subjects such as employment, income, access to land, among others, in the period between the two Agriculture/Livestock censuses, allowing the quantification of tendencies beyond the situation pictured by the Census.
During the period of 10 years between the Agriculture/Livestock Censuses, Brazilian agriculture has undergone major transformations: the expansion and consolidation of the production in the Central-West Region; the expansion of
1 The authors acknowledge the contributions of Rafael Cedro, Laudemir Muller, Adoniram Sanches and Silvia Pavesi. 2 Master in Sociology, Head of Cabinet of Ministry of Agrarian Development.
3 Doctor in Economics, Professor of the University of Brasilia and Special Advisor to the Ministry of Agrarian Development.
10
soybean cultivations to new regions (southern Maranhão and Piauí, and west of Bahia), the expansion of sugarcane cultivation and of sugar and alcohol mills in the Southeastern and Central-West Regions, a set of differentiated agricultural policies for family farms were structured, the construction of a network of social protection with emphasis on expanding access to social security in the rural area and the Family Grant Program (Bolsa Família), the intensification of the creation of land reform settlements, the expansion of cellulose and paper production by transnational companies due to the acquisition of large areas, the expansion of agricultural exports brokered by international trading companies, among others. These transformations occurred in a different pace and intensity during this period so that, in order to indicate ongoing trends, they must be analyzed with complementary information and with further studies.
The present report intends to contribute to the full understanding of the results of 2006 Agriculture/Livestock Census and, in particular, of data on family farming, showed in the IBGE thematic report. It is divided into six topics, including this presentation. In the second topic, some of the technological and methodological innovations from the 2006 Census are highlighted. The third topic attempts to situate the debate about the results through a contextualization of agricultural transformations in the center of some key aspects and indicators of changes in Brazilian economy during the period between the 1995/1996 and the 2006 Censuses. Topic 4 draws the attention to the extreme caution needed while comparing the results from these two censuses due to methodological changes. The fifth and longest topic focuses on the presentation of a portrait of family farming in Brazil, beginning with methodological considerations about the derived variable, followed by an explanatory description of available results. In the conclusion, final considerations are drawn, and a summarized data sheets for all Brazilian States is annexed.
2. The new DIMENSIONS of the 2006 Agriculture/
livestock Census
The Census provides new dimensions. The most important is that, for the first time, there are official statistics on family farming. This was only possible through the partnership of the Ministry of Agrarian
11
Development (MDA) with the Brazilian Institute for Geography and Statistics (IBGE) in the construction of derived variables that meet the criteria defined by the Law 11.326/2006, The Law of Family Farming5.
These derived variables have already been incorporated to IBGE’s database and will enable any researcher or interested actor to review all the available information with focus on family farming. This unique event is the result of a long journey of affirmation and recognition, by the Brazilian Government, of the economic and social importance and the legitimacy of the claims and demands of family farmers - a plural group formed by small and medium establishments, agrarian reform settlements and traditional rural communities such as - gatherers, fishermen, riverine, and members of quilombo communities - descendants of runaway slaves when the slave system was in force in Brazil. A journey that was driven by social struggles, which were part of the agenda of redemocratization in Brazil, and that gradually became the institutional framework of public policies for rural development. The recognition of the rights for rural social security, the creation of the National Program for the Strengthening of Family Farming (Pronaf) in 1995, the creation and consolidation of a simultaneous and permanent set of differentiated public policies, and the Law of Family Farming are milestones in this story. The “Family Farming Report: First Results”6 available on IBGE’s website, contains 12 tables, with national data and information of all Brazilian states, on the characterization of family farming in the context of Brazilian agriculture, and the number of family farmers per municipality. IBGE presents the Family Farming Report as follows:
“Initiating the release of 2006 Agriculture/Livestock Census results, IBGE presents, for the first time, information on the economic ac-tivities carried out by family farms and rural family enterprises in the country, thus considered the establishments that meet simulta-neously the criteria established by the Law 11.326 of July 24, 2006, namely: the area of the establishment or rural enterprise that does not exceed four fiscal modules, the labor used in economic activi-ties is predominantly family related, the family’s income is predo-minantly originated from these activities, and the establishment or enterprise is run by the family. In this pioneering work, a result of
5 Work carried out by Mauro Del Grossi and Vicente Marques in dialogues with Antonio Florido, Coordinator of the Agriculture/Livestock Census and other experts from IBGE.
12
the partnership with the Ministry of Agrarian Development, IBGE performs a conceptual delimitation of the productive sector thus designated, and brings to public its first official statistics. These re-sults, published in a wide range of tables, allow us to know how many, where they are, and what family farmers and rural enterpri-ses are producing in Brazil, thus attending an expressive demand for quantitative information on the subject, which until now, was only contemplated in dispersed academic and scientific studies ba-sed on historical data. The publication also contains comments on these initial results, plus technical notes that describe the concepts required for its understanding. All the information herein disclosed is also available in the CD-ROM that accompanies the publication and in the IBGE’s website. The full results of the Agriculture/Lives-tock Census are available in the volume “2006 Agriculture/LivesAgriculture/Lives-tock Census: Brazil, Regions and Federative Units”.”
Until this moment, the only information available to give visibility to the universe of family farming was the quantification of the potential public for National Program for the Strengthening of Family Farming (Pronaf), the potential beneficiary public of social security, the rural survey conducted by a team of researchers associated with the FAO/ INCRA7 project, and from official statistics from the 1995/96 Census8.
It is worth noting that the criterion adopted by MDA and by IBGE to define family farming – in the Law 11.326/2006 - is more restrictive than the criteria used in the methodologies listed above and its implications will be addressed later.
Another important new aspect was the creation of the National Register of Addresses for Statistical Purposes that contains detailed information of all the households in agricultural establishments using GPS coordinates, taken during the fieldwork. The geo-referenced register will allow the acquisition of samples to update the survey data and also qualitative research to deepen specific topics with reduced costs. With this register, IBGE will be able to conduct sample surveys between the Agriculture/Livestock Censuses, avoiding a long period of discontinuity of updated information. Since it involves a smaller base of respondents,
7 INCRA/FAO. New Portrait of Family Farming. Brazil, Rediscovered. Brasília, 2000.
8 Another important study that gives visibility to the economic importance of this segment is GILHOTO, JJM; AZZIBUM C, R.; SILVEIRA, F.G. et al. GDP of Family Farming: States and Brazil. Brasília, MDA, 2007 (NEAD Study 19)
13
these sample surveys, similar to what is currently done by PNAD, can cover both productive and qualitative aspects, and may thus provide important information for rural development public policy managers.
3. CONTEXT AND GENERAL INDICATORS
9The period between the 1995/1996 Agriculture/Livestock Census and the 2006 Census coincides with a period of a radical transformation in the country’s economy. After the elimination of import substitution industrialization policies in the late eighties, Brazil adopted reforms that led to macroeconomic stabilization (Plano Real), privatization of state companies (National Plan for Privatization), and trade liberalization. Domestic markets were deregulated and a customs union, Mercosul, was established. Significant tariff cuts and the elimination of nontariff trade barriers were observed. Despite rapid growth of exports, about 70% to 75% of the country’s agricultural production was destined to the domestic market.
According to the National Supply Company (Conab), the grain planted area increased from 37 million hectares in the harvest of 95/96 to 46.2 million hectares in the season of 2006/2007 (up 25%). Production increased from 73.6 million to 131.7 million tons in the same period (a 79% up). This result was strongly influenced by soybean planted area which almost doubled from 10.7 million in 95/96 to 20.7 million hectares in 06/07. The production achieved in these areas grew 2.5 times, from 23.2 million to 58.4 million tons in the same period. Besides soybeans, sugar cane also had a large growth increasing its planted area of 4.6 million hectares in 1995 to 6.4 million in 2006, according to the Municipal Agricultural Research (PAM/IBGE10) (38% increase). The production of sugar cane increased from 303.7 million to 477.4 million tons (57% variation). The increase in crop production reflected significant gains in physical productivity. In Brazil, the average yield of grain increased from 1990 kg/ha to 2851 kg/ha (up 43%). A 40% productivity increase was obtained in important crops such as cotton, rice, beans and corn.
Although the total area used as grazing land has suffered a reduction, showing a decrease of 20.7 million hectares in areas of natural grazing land,
9 Based on: OECD. Analysis of Public Policies: Brazil. Brasília: MAPA, October 2005, and OECD. Agricultural policies in emerging economies. Monitoring and evaluation 2009. Paris: OECD, 2009.
10 It is important to point out that the methods of gathering information from CONAB and MBP are distinct from the Agriculture/ Livestock CENSUS, and cannot be compared directly.
14
a small increase, of 1.7 million hectares, was registered in the total area of planted grazing land. The Northern Region had a 3.7 million hectares reduction of natural grazing areas, but increased 5.8 million hectares of planted grazing areas (IBGE, Agriculture/Livestock Census in 2006). This region contributed with the largest share (14 million) of increase in the number of cattle, which went up from 153.1 million to 169.9 million heads (an 11% increase). Between the years of 1996 and 2006, Brazilian population grew from 154 million to 187 million, that is, an increase of approximately 33 million people. According to the National Household Sample Survey (PNAD/IBGE), Brazilian population living in rural areas remained stable, ranging from 31.6 million in 1996 to 31.3 million people in 2006. However, there was a significant change in relative terms, as it grew from 20.5% of the national total, in 1996, to 16.7% in 2006.
According to IBGE, the Gross Domestic Product (GDP) of Brazil rose from R$ 705.6 billion in 1995 to R$ 2.369 trillion in 2006. GDP per capita grew from R$ 4.4 thousand (R$ 4.8 thousand) in 1995 to R$ 12.8 thousand (US$ 5.9 thousand) in 2006. The value added11 at basic prices of agriculture grew from R$ 35.6 billion to R$ 111.2 billion in same period.
In relative terms, these figures represented a stable contribution to GDP, ranging from 5.8% in 1995 to 5.5% in 2006. Occupied persons in agricultural establishments decreased from 17.9 million to 16.6 million (-7.2%). In relative terms, the share of agriculture in the total number of employment in the country fell from 26.1% in 1995 to 18.9% in 2006, as shown in the results of Agriculture/Livestock Censuses.
According to the Ministry of Development, Industry and Foreign Trade (MDIC), Brazilian exports of agrifood products enclosed by the Agricultural Agreement of the Uruguay Round showed significant growth, from US$ 13.8 billion in 1995 to US$ 36.9 billion in 2006. Imports of these products fell from US$ 6.5 billion to US$ 4.5 billion in the same period. This resulted in a significant surplus in the balance of trade of these products, which rose from US$ 7.3 billion in 1995 to US$ 32.6 billion in 2006, which represents a value almost 4.5 times higher than the previous.
In relative terms, the share of agrifood products in total Brazilian exports remained stable, decreasing from 28.7% in 1995 to 26.8% in 2006. Imports of these products fell by 12.5% of total imports in the
11 IBGE defines value added as the one that “the activity adds to the goods and services consumed in its production process.” It is the contribution to gross domestic product by the various economic activities obtained by the difference between the value of output and intermediate consumption absorbed by these activities.
15
country in 1995 to 4.9% in 2006. From these data, it is possible to observe that without the production value generated by family farming (which largely supplies the domestic market)12 this favorable balance of trade in agriculture would become a deficit. Therefore to generate a surplus it is not enough to just export expressive quantities, but at the same time, import to very little, which is made possible by supplying the domestic market with family farming products.
Export growth showed a change in its structure, since it was supported especially by soybean and its derivatives (with important contributions from sugar and poultry, pigs, and cattle) in detriment to typical tropical products, such as coffee and orange juice. There was also a change in the flow of trade, with growing participation of sales to countries outside the European Union, like China and Russia. It should be pointed out that the new census is the first to capture the effects of the Agricultural Agreement of the Uruguay Round and Mercosul, both implemented in 1995.
In institutional terms, the new Census partially captures the changes due to the creation of the MDA in 2000 and various programs created during this period, as Pronaf (created in 1995 and redesigned especially after 1999), the Rural Proger (Rural Employment and Revenue Generation Program, 1995) and Harvest Insurance (2002). Other major programs to support family farms are recent and were in an initial phase of implementation at the time of the Census: Food Purchase Program (2003), Family Farming Insurance - Proagro More (2004), National Biodiesel Program (2004), Rural Territories (2004) and the Family Grant Program (2004). Likewise, the Second National Plan for Agrarian Reform, launched in 2003, was effectuated in the following year. In the former period, the main governmental program that gave access to land were the Agrarian Reform and Poverty Alleviation Program, commonly known as the Cédula da Terra and the Land Bank Program, created in 1997/1998 and regulated in 2001, and the creation of settlement projects under the responsibility of the National Institute of Colonization and Agrarian Reform (Incra), intensified since 1995.
Among the remaining actions of agricultural policy developed during the period are the important changes in the system of
12 In contrast with the data for value of production of AF - Table 1.11 - or Income Obtained by the FA - Table 1.9, published in the Family Farming Report of the 2006 Agriculture/Livestock Census.
16
guaranteed prices from 1996, with the end of the indexation of minimum prices and the introduction of option contracts of sale and the Production Outflow Awards (PEP), leading to substantial reduction of direct purchases at minimum prices. Moreover, the Kandir (1996) and Storage (2000) Laws were edited, the Promissory of Rural Product - CPR (1994), and Moderfrota (1999), for the mechanization of agriculture were established. Farmers’ large debts were the object of the Debt Securitization Program (1995) and the Special Program for the Remediation of Assets - PESA (1999) and their successive amendments.
The creation of new bonds to support financing, such as the Agricultural Deposit Certificate and Agricultural Warrant (CDA / WA) and others, and the establishment of the Grant for the Rural Insurance Prize, also occurred in 2004, shortly before the Census.
In the period between the censuses also occurred the consolidation of universal social security laws in rural areas, that were consecrated by the 1988 Constitution and by the Laws of Cost and Benefits, both from 1991, but were only made effective in 1992. According to the Statistical Yearbook of the Ministry of Social Welfare, 5.2 million of rural pension benefits13 were issued in 1995, of which, 3.9 million were related to retirement and pensions for 1.3 million deaths. Among the retirements, 3.5 million were due to age. In December 2006, the number of welfare benefits issued reached 7.3 million, of which 5.2 million were related to retirement and pensions for 1.9 million deaths. Among retirements, 4.8 million were due to age. The Northeastern Region concentrates 2.4 million rural retirees. That is, during this period of time, about 1.3 million rural retirees were incorporated into the pension system, almost all of them by age and by the status of Special Insured.
4. METHODOLOGICAL CHANGES
Comparative analysis of the results of the 2006 Agriculture/ Livestock Census with the 1995/1996 Census should take into account some methodological changes. It refers to the modification in the period of data collection that changed from the agricultural year to
13 In the absence of complete series of active benefits, which correspond to those actually received, the benefits considered issued, corresponding to credit issued for the payment of benefits. In other words, they are continuous benefits that are active in the register and for which credits are forwarded to the payment network of benefits. In the 2006 data, there is a close relationship between benefits received and assets.
17
the calendar year. Until the census of 1985 and in 2006 the reference date for all information was the 31st of December. In the 95/96census, the data related to the production of permanent and temporary crops, horticulture, forestry and vegetable extraction were referenced on the 1st of August, 1995 until the last day of July 1996. Data on ownership, area, employment, refer to the 31st of December, 1995 and data on actual livestock and crops and forestry, refer to the 31st of July, 1996. Information on investment, financing, costs, revenues, production and other information about agricultural establishments cover the same period.
In exact terms, this means that the adopted methodological modifications in the two most recent censuses are not strictly comparable in all their issues. When this is done, it is necessary to consider the implications of these changes, which focus primarily on the measurement of agricultural establishments with precarious and transitory situation in the previous census. These establishments were only identified during the period between planting and harvesting the crop. The consequence of the methodology would be an underestimation of the cultivated area (particularly in the temporary crops) and of employment14 in the establishment. Therefore, the results of these issues in the most recent census should consider this effect.
5. FARMING FAMILY IN 2006
This topic begins with a methodological approach that addresses the variables employed that, in return, allowed the delimitation of family farming from the data in the 2006 Census. It also indicates some differences between the family farming derived variable from the 2006 Census and the one established in the FAO/INCRA study, which was the main reference in public debate on the issue.
After that, results on family farms, land use, crop and animal production, producer’s situation in relation to land, employment, income, and value of production are presented. As far as possible, besides the description and observations made on the Family Farming Report in the 2006 Census, we present results of previous censuses and compared data from the 1995/96 and the 2006 Census, using the family farming derived variable of FAO/INCRA study.
14 See: HOFFMAN, R.; GRAZIANO DA SILVA, J. (1999) The 1995-1996 Agriculture/Livestock Census of and the distribution of land ownership in Brazil. IN: Proceedings of the XXXVII Congress of the Brazilian Society of Economics and Rural Sociology, August 1999, Foz do Iguaçu, PR.
18
5.1. Methodology: Variables used
The derived variable of Family Farming in the 2006 Census, based on the Family Farming Law15, and the delimitation of the family universe in studies from the Technical Cooperation Project between FAO and INCRA, used available information from the Census that were not prepared for this purpose. In both cases, it was necessary to combine the fundamental concepts with existing data. The two variables have something in common, which is the administration of rural establishment being carried out by the family, as well, the predominance of labor within his/her own family in the economic activities of establishments or enterprises.
The main differences between the two characterizations are related to the area of the establishment, to the characterization of income from activities and the measurement of family and hired work. In the case of the area, the Family Farming Law establishes the limit of four fiscal modules while the FAO/INCRA study established a limit of a maximum of 15 average regional modules16. The maximum value of the four modules is always less than the limit calculated for that study in every region of the country. That is, the FAO/INCRA study included as family farms establishments with a larger area than those covered by the Law.
In the case of income, it appears as a defining element of the family character of the establishment. According to variable drawn from the Law, “if in 2006 the total income of the enterprise was less than the amount of wages obtained in off-farm activities, then the agricultural establishment was not considered a family farm”17. In the FAO/INCRA study, income is only an element of complementary classification in the sense that it only occurs on the characterization of the types of family farmers with reference to their capitalization. That is, the FAO/ INCRA study considered as family farms, establishments with a higher proportion of income earned off-farm, which is forbidden by the law.
For the quantification of the nature of employment, the two characterizations defined the establishment as being a family farm when the unit of family labor (UTF) was higher than the unit of hired labor
15 See (2009) DEL GROSSI, Mauro and MARQUES, Vicente. Family farming in the 2006 Census: the construction of the derived variable (in press). 16 The fiscal regional average module was calculated from the state average module weighted by the number of municipalities. The regional maximum area of 1,122 ha was established in the North Region; 769 ha in the Central-West, 694 ha in the Northeastern, Southeastern 384 ha and 280 ha in Southern Region.
19
(UTC). In the variable based on law, the UTC was obtained by adding the number of women and men, permanent employees 14 years old or more, plus the half of the number of permanent employees under the age 14 years, 14 years old or more partner employees, plus the half of the number of partner employees with less than 14 years of age, plus the result of the division of the number of daily wages paid in 2006 by 260, and plus the result of division of the days worked by 260. Since the previous census had no items that would allow a precise measure of the actual period of temporary work employed in the FAO/INCRA study, inferences were made from the expenditures, which required calculations based on indicators from other surveys other than the Census18. This presumes approximate results, which eventually may have caused distortions in the classification of the establishment in relation to the law, and that are not yet possible to estimate.
Besides these methodological differences, others could be mentioned. Among them, the restrictions that the Family Farming Law makes in relation to activities such as aquaculture and vegetable extraction, which were not considered in the study of the previous census. In other words, the universe of family farms according to the FAO/ INCRA study considers that establishments with aquaculture activities and with tanks, lakes and ponds larger than 2 hectares are family farms. Establishments with vegetable extraction sales above half the total income from agricultural activities and hiring labor for harvest for more than a month were also considered family farms according to the study, among other criteria.
In summary, the variables obtained by the Family Farming Law and by the FAO/INCRA study have a common central part, but cannot be compared in a strict manner. In a general manner, the criteria used by the FAO/INCRA study are broader in scope in relation to the universe defined by the Family Farming Law.
18 In the FAO/INCRA study, the number of UTC’s was calculated from the attainment of the total cost of labor employed (including partner employees and temporary contracts) and the calculation of the annual average cost value of an employee in rural areas, by multiplying the number of days worked during the year by the average daily value established by the state Agricultural Studies Center of the Getúlio Vargas Foundation.
20
5.2. Family Farms
In the Agriculture/Livestock Census of 2006 there were 4,367,902 family farming establishments19, representing 84.4% of all establishments in Brazil. This number of farmers occupied an area of 80.25 million hectares, or 24.3% of the area occupied by all agricultural establishments in Brazil. These results show a concentrated agrarian structure in the country: although they represent 15.6% of all establishments, nonfamily establishments occupied 75.7% of total area. The average size of family farms was 18.37 ha, and the nonfamily farms 309.18 hectares. The Northeastern Region contained half of all family farms (2,187,295) and 35.3% of the total area.
In the total, family farms accounted for 89% of all establishments and 37% of the total area. The Southern Region was home to 19.2% of all family farms (849,997) and 16.3% of the total area. In this region, family farms accounted for 84% of all establishments and 37% of the total area.
The third region with the largest number of family farms was the Southeastern, with 699.978 establishments, or 16% of the total. They were occupying 12,789,019 ha, or 15.9% of the total area occupied by this type of establishment in the country. In this region, family farms accounted for 76% of total establishments and 24% of the total area.
The states with the largest number of family farms were Bahia (665,831 or 15.2% of the total), Minas Gerais (437,415 or 10.0% of the total), Rio Grande do Sul (378,546 or 8.7% of total) and Ceará (341,510 or 7.8% of the total). The states with the largest areas occupied by family farming establishments were Bahia (9,955,563 ha or 12.4% of the total), Minas Gerais (8,845,883 ha or 11% of the total) and Pará (6,909,156 ha or 8.6% of the total). The average size of the establishments varied according to the regions from a minimum of 13 ha in the Northeastern Region to a maximum of 43.3 ha in the Central-West Region. In the Southern and Northern Region the average size was 15.4 ha and 40.5 ha respectively. The smallest average size of family farms were found in the Federal District of Brazil (6.0 ha) and in the State of Alagoas (6.1 ha). The largest average size of family farms were in the State of Roraima (71.6 ha) and Tocantins (62.8 ha).
19 The 2006 Census considered as family farming establishments as “any production unit devoted wholly or in part, to agricultural activities, forestry and aquaculture, subordinated to a single administration: the producer or the administrator. Regardless its size, its legal form or its location in urban or rural area, aiming to produce for subsistence and/or sale, therefore being a countable unit. The non-continuous areas operated by the same producer, was considered as a single establishment, provided they were in the same census sector, used the same technical resources (machinery, agricultural implements and tools, working animals, etc.). And same resources (same personnel), and also, if they were tied to a single administration: the producer or the administrator.
21
The average size of nonfamily farms according to the regions varied from a minimum of 177.2 ha in the Northeastern Region to a maximum of 944.3 ha in the Central-West Region. In the Southern Region the average size of nonfamily farms reached 182.2 ha and in the Northern Region 608.5 ha. The largest average size of nonfamily farms were found in the State of Mato Grosso (1.600.9 ha) and in the State of Mato Grosso do Sul (1.215 ha) and Amapá (1.119 ha). The largest average size of family farms were in the State of Roraima (71.6 ha) and Tocantins (62.8 ha). The 2006 Census covered 5,175,489 establishments, which represented a 6.5% growth in relation to the 95/96 result of 4,859,865 establishments. In 1985, the Census revealed the existence of 5,802,206 establishments. The total area in 2006 was of 329.9 million ha, which represents a decrease in relation to the 95/96 result of 353.6 million ha. The difference of 23.7 million hectare represents a 6.7% reduction of the area in relation to the former Census. In 1985 the total area of establishments was of 374.9 million hectares. In other words, the data showed a downward tendency of the number of agricultural and livestock establishments and of its total area taking into account the land use (cropland, pasturelands, forests and others).
In the 1995/96 period, the FAO/INCRA study identified 4,139,369 family establishments occupying 107,768,450 ha in Brazil. In 2006, special tables from IBGE following the same criterion pointed out the existence of 4,551,967 establishments in an area of 106,761,753 ha. This reveals 412,598 new production units or 10% more establishments than in the former survey. However, the total area occupied by the establishments suffered a 1006.697 ha decrease or less than 1% in the same period.
22
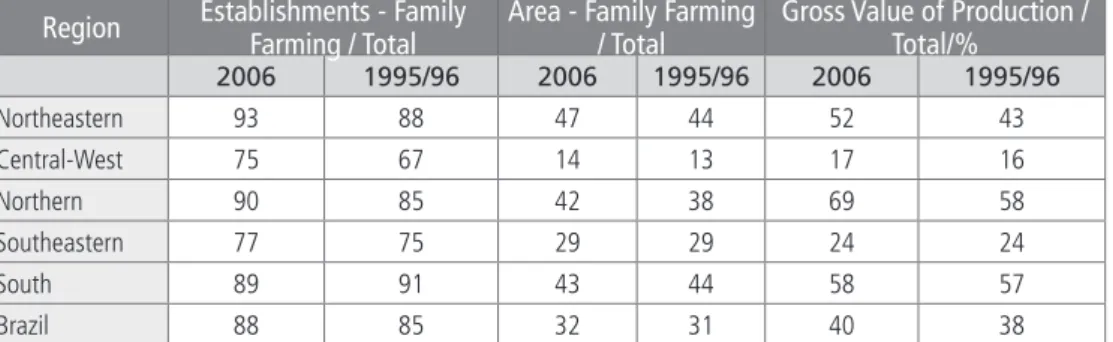
Table 1. Share of Family Farming in the total of establishments and area, according to different variables
Region Establishments - Family Farming / Total Area - Family Farming / Total Gross Value of Production /Total/%
2006 1995/96 2006 1995/96 2006 1995/96 Northeastern 93 88 47 44 52 43 Central-West 75 67 14 13 17 16 Northern 90 85 42 38 69 58 Southeastern 77 75 29 29 24 24 South 89 91 43 44 58 57 Brazil 88 85 32 31 40 38
Source: FAO/INCRA Agriculture/Livestock Census 1995/96 and 2006
Table 1 shows an increase in the share of family farming in the total of all Brazilian establishments and in all the regions except in the Southern Region. The largest difference occurs in the Central-West Region, with a variation of seven percent. The data also indicates a relative growth in the area occupied by family farming establishments in Brazil and in all the regions, except the Southern Region. The largest difference occurs in the Northern Region with a growth of five percent. There was also an increase in the share of family farming in the Gross Value of Production (GVP) on a national level and in all the regions of the country, especially in the North and Northeastern regions where the variables reached 11 and nine percent, respectively.
Table 2. Family Farming Characteristics per region according to different variables.
Region Establishments % Area (%) GVP (%) Average Size (ha)
2006 1995/96 2006 1995/96 2006 1995/96 2006 1995/96 Northeastern 50 50 33 32 26 17 16 17 Central-west 5 4 14 13 6 6 62 84 Northen 9 9 21 20 7 7 53 57 Southeastern 16 15 15 17 20 22 22 30 South 20 22 17 18 41 47 20 21 Brazil 100 100 100 100 100 100 24 26
23
Table 2 shows small differences between the distribution of farming establishments among all the regions in the country, both in terms of number of units, as well as in the total area occupied by them. There are significant differences in relation to the share of each region in the Gross Value of Production and in the average size of the establishments. In relation to the GVP, there is an increase of the share of the Northeastern Region in disadvantage to the share of the Southeastern and Southern Regions. The average size of establishments falls on a national level and in all regions. The main variation occurs in the Central-West Region (less 26%) and in the Southeastern Region (less 25%). The average size of family farming establishments fell 10% in Brazil.
The following tables compare the data from the 2006 Census according to the variables of the Family Farming Law and the FAO/ INCRA study. The first variable identified 4,367,902 establishments in 80.25 million hectares and the second 4,551,967 establishments in 106.8 million hectares. This represents a difference between the largest and the smallest of 184.065 establishments (4.2%) and 26.6 million hectares (33%).
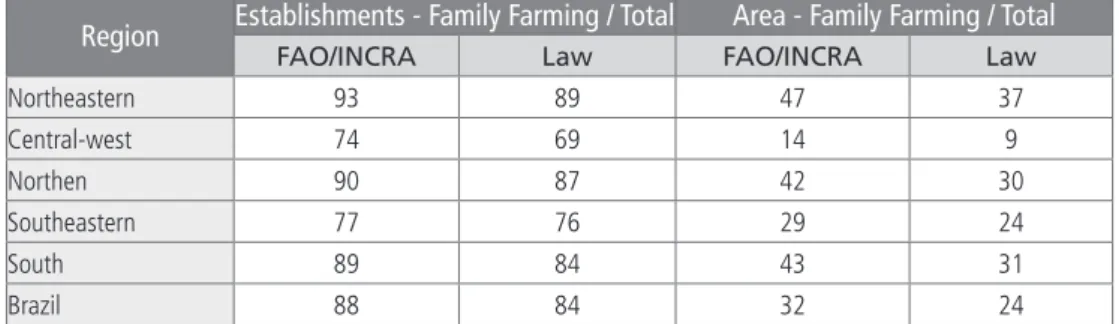
Table 3. Share of Family Farming in the total number of establishments and in area, according to different variables.
Region Establishments - Family Farming / Total Area - Family Farming / Total
FAO/INCRA Law FAO/INCRA Law
Northeastern 93 89 47 37 Central-west 74 69 14 9 Northen 90 87 42 30 Southeastern 77 76 29 24 South 89 84 43 31 Brazil 88 84 32 24
Source: Agriculture/Livestock Census - IBGE
Table 3 shows the differences between the classifications according to the FAO/INCRA study and the Law of Family Farming for the delimitation of Family Farming. The first study showed a larger universe of family farming establishments in Brazil and in all the regions of the country. The largest differences occurred in the
24
Southern and Central-West Region where they reached approximately five percent. The same happens in relation to the area according to the FAO/INCRA in which the establishments occupy a larger area than those classified by the Law. The same occurs nationwide and in all the regions of the country. The greater differences take place in the Southern and Northern Region.
Table 4. Family Farming Characteristics in 2006 per region according to different variables.
Região Establishments Area% Average Size (ha)
FAO/INCRA Law FAO/INCRA Law FAO/INCRA Law
Northeastern 50 50 33 35 16 13 Central-west 5 5 14 12 62 43 Northen 9 10 21 21 53 40 Southeastern 16 16 15 16 22 18 South 20 20 17 16 20 15 Brazil 100 100 100 100 24 18
Source: Agriculture/Livestock Census – IBGE
Table 4 reveals small differences in the distribution of Family Farming establishments among the region, both in terms of number of productive units as in the area occupied by them. The main differences between the classifications occur in the average size of these establishments. In all of the regions, the average size according to the FAO/INCRA criteria is larger. This difference varies from a minimum of 20% in the Northeastern Region to a maximum of 45% in the Central-West Region. In the national count, the difference between the average sizes is 31%.
5.3. Land Use
The 2006 Family Farming Report and the Brazilian Agriculture/ Livestock Census presents the Land Use of the establishments, according to the agricultural classification. Of a total of 80.25 million hectares occupied by Family Farming, 45% were destined to grazing areas; while areas covered with woods, forests and systems of agroforests occupied 24% and 22% of the area was destined for crops. The nonfamily farming also follow the same order, although the percentage of pasturelands and woods and/or forests were a little larger (49% and 28% respectively), while
25
cropland was smaller (17%). It is important to point out that according to Brazilian Forestry Law, in average, 10% of forest areas destined to be permanent conservation areas or Legal Reserves (legal conservation areas) in family farms and in others, 13% of the area covered with native forests. Despite cultivating smaller areas (17.7 and 36.4 million hectares, respectively) for pastures and crops, family farming is responsible for a large part of the food security in the country as an important food supplier for the domestic market.
In this Census, 59.8 million hectares were identified as cropland, of which 44.0 million hectares was occupied with temporary crops; 158.7 million hectares was used as pastures, of which 101.4 million hectares was of planted pastures; and 90.3 million with woods and/or forests, of which 85.8 million were native forests and/or woods.
The 95/96 Census identified 41.8 million hectares as cropland, of which 34.2 million hectares was occupied with temporary crops; 177.7 million hectares was used as pasturelands, of which 99.6 million hectares was of planted pastures; and 94.3 million with woods and/or forests, of which 88.9 million were native forests and/or woods.
The 1985 Census identified a total area of 52.1 million hectares of cropland, of which 42.2 million hectares was occupied with temporary crops; 179.2 million hectares was used as pastures, of which 74.1 million hectares was of planted pastures; and 89.0 million with woods and/ or forests, of which 83.0 million were native forests and/or woods. In other words, it is possible to observe an increasing tendency of the area destined for crops, especially of the temporary crops, of planted pastures and native forests. It is possible to calculate the suitable area for crops and livestock of the establishments by subtracting the unsuitable areas from the total area. By similarity to Article 10 of the 8,629/93 Law, unsuitable areas are considered those with constructions, improvements, pathways20, native woods and/or forests destined for permanent conservation or Legal Reserves (legal conservation areas), and unsuitable land for agriculture or livestock (wetlands, sandy soils, quarries, etc..). Therefore, the total suitable area in Brazil would be 269.00 million hectares, of which 68.7 million in family farming establishments (25.5%) and 200.3 million hectares in non family farming establishments (74.5%). Therefore, the share of family farming areas increases when suitable
20 The Clause I of Article 10 mentioned above considers unsuitable areas those areas occupied with constructions and installations, excluding those destined for productive use, such as greenhouses, nurseries, seedling beds, fish breeding tanks and others. The Census does not differentiate constructions and improvements for productive purposes.
26
areas are considered. Also, if suitable areas are taken into account, the share of each land use would be altered. In the case of family farming, the pasturelands would occupy 53.0% of the area, cropland 25.7% and woods and/or forests (including system of agroforests and excluding the areas destined for permanent conservation), 20.5%. In the case of non-family farming establishments these percentages would be 61.1%, 21.1% and 17.1%, respectively. That is, the share of woods and/or forests in suitable areas in family farming establishments is larger than the share of woods and/or forests in non-family farming establishments.
5.4. Livestock and Vegetable Production
The Family Farming Report draws attention to the share of family farming in some selected crops harvested: it produced 87% of the national production of cassava, 70% of bean production (of which 77% are black beans, 84% black-eyed beans, and 54% of colored beans) 46% of corn, 38% of coffee (55% Robusta coffee, and 34% Arabica coffee) 34% of rice, 58% of milk (58% cow milk, and 67% goat milk), 59% of the herds of pigs, 50% of the poultry flocks, 30% of the herds of cattle, and produced 21% of wheat. The crop with the lowest share of family farm participation was soybean (16%), one of the Brazil’s main exporting products. To evaluate the importance of family farming, it is useful to indicate the size of the area destined for crops and the amount of harvested crops checked by the 1985, 1995/96 and 2006 Census. Table.5 Area (in hectares) and the amount harvested (in tons) of selected crops harvested 1985, 1995/96 and 2006
Area (in hectares) Amount (in tons)
1985 1995/96 2006 1985 1995/96 2006 Rice 5,173,330 2,977,019 2,409,589 8,986,289 8,047,895 9,447,257 Beans 5,480,286 3,225,092 4,327,696 2,066,556 1,450,570 3,108,983 Cassava 1,635,594 1,233,138 2,702,102 12,432,171 9,099,213 16,093,942 Corn 12,040,441 10,602,850 11,724,362 17,774,404 25,510,505 42,281,800 Soybean 9,434,686 9,479,893 15,646,991 16,730,087 21,563,768 40,712,683 Wheat 2,518,086 893,555 1,300,008 3,824,288 1,433,116 2,257,598 Coffee 2,636,704 1,812,250 1,687,854 3,700,004 2,838,195 2,360,756
Source: Agriculture/Livestock Census – IBGE (1985, 1995/96 and 2006)
Table 5 shows the reduction in planted areas of selected crops in relation to 1985, except in the cases of soybean and cassava. However, the yield is increasing, except in the cases of wheat and coffee. It is important to observe
27
that the reference date for data collection in 1995/96 is different to that of 1985 and 2006, a fact that can result in the underestimation of data.
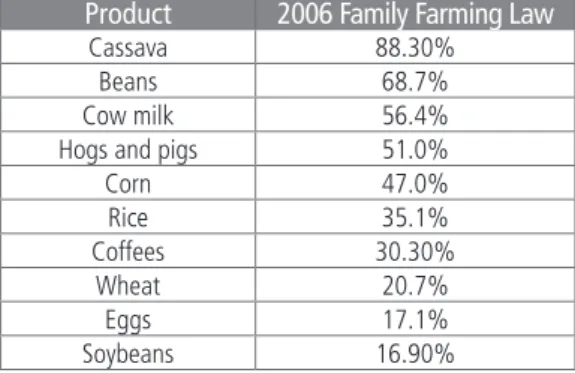
The study undertaken by FAO/INCRA did not publish the results of the share of family farming in livestock and vegetable production. Only results of the share of family farming in Gross Value of Products per region were released as can be seen in the following table. Although the data is not comparable, Tables 6 and 7 identify the share of family farming in the total GVP of selected crops according to the study undertaken by FAO/INCRA and the variable originated by the law. It is important to remember that the criterion of definition of family farming of the law is far more restrictive than that adopted by FAO/INCRA. Table 6. Share of family farming in the GVP of selected crops (in % of the total GVP of the product) - 1995/96 FAO/INCRA
Product 1995/96 FAO/INCRA
Cassava 83.9%
Beans 67.2%
Cow milk 52.1%
Hogs and pigs 58.5%
Corn 48.6% Rice 30.9% Coffees 25.5% Wheat n.d. Eggs n.d. Soybeans 31.6%
Source: Agriculture/Livestock Census – 1995/96 IBGE and FAO/INCRA 1999
Table 7. Share of family farming in the GVP of selected crops (in % of the total GVP of the product) 2006 - Family Farming Law
Product 2006 Family Farming Law
Cassava 88.30%
Beans 68.7%
Cow milk 56.4%
Hogs and pigs 51.0%
Corn 47.0% Rice 35.1% Coffees 30.30% Wheat 20.7% Eggs 17.1% Soybeans 16.90%
28
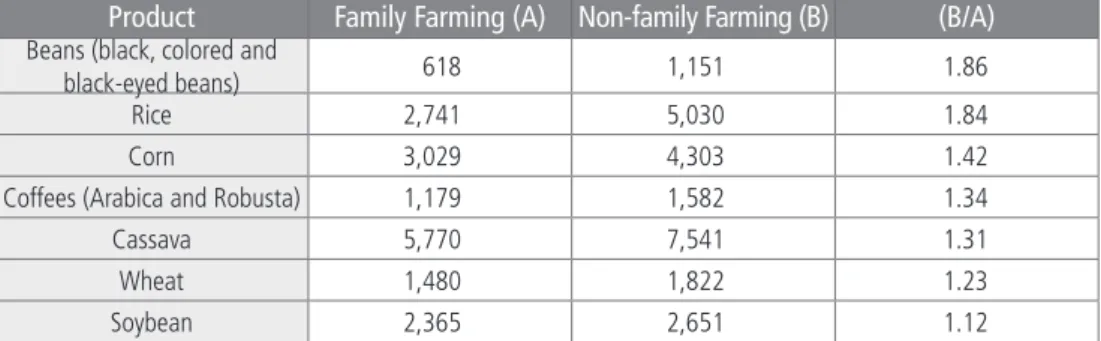
Table 8 compares the physical productivity of Family Farming and Non-family Farming of selected crops.
Table 8. Productivity in selected crops in Family Farming and Non-family Farming establishments (in kg/ha)
Product Family Farming (A) Non-family Farming (B) (B/A)
Beans (black, colored and
black-eyed beans) 618 1,151 1.86
Rice 2,741 5,030 1.84
Corn 3,029 4,303 1.42
Coffees (Arabica and Robusta) 1,179 1,582 1.34
Cassava 5,770 7,541 1.31
Wheat 1,480 1,822 1.23
Soybean 2,365 2,651 1.12
Source: Agriculture/Livestock Census – 2006 IBGE
The table shows the significant differences between the average productivities of family farming establishments and non-family farming especially in beans and rice. The smallest differences between productivities were with soybean, which is mainly cultivated in non-family farming establishments.
Table 9 compares the average productivities in Brazil in former years with the productivity of family farming in 2006 in selected crops.
Table 9. Average productivity in selected crops and in family establishments (in kg/ha)
Brazil 1985 Brazil 1995/96 Brazil 2006 Family 2006
Rice 1,737 2,703 3,921 2,741 Coffe 1,403 1,566 1,399 1,179 Beans 377 450 718 618 Cassava 7,601 7,379 5,956 5,770 Corn 1,476 2,406 3,606 3,029 Soybean 1,773 2,275 2,602 2,365 Wheat 1,519 1,604 1,737 1,480
29
Table 9 shows a variable behavior of productivities in family farming. In this case, soybean is close to the national average in 2006. In relation to wheat, coffee, and rice, it is still close or below the national average in former census. The information above reveals the potential of rapid growth of the productivity of family farming when properly supported by public policies directed for this specific purpose. Family Farming is able to achieve rapid growth of productivity and total production of food.
5.5. Producer’s situation in relation to the Land
Data in the 2006 Census combined in the Family Farming Report, present the situation of the producer in relation to the land. Of the 4.3 million family farming establishments, 3.2 producers owned the land. This number represents 74.7% of the family farmers and added up to 87.7% of all the land. Another 170 thousand producers declared to have access to the land as “settled without definite titles” However, another 691 thousand producers had temporary or precarious access to land, either as a leaseholder (196 thousand), sharecroppers (126 thousand), and settlers without title (398 thousand). The smallest establishments are those of the partners and they add up to 5.59 hectares. The 2006 Agriculture/Livestock Census presented a novelty: in December of that year, 95%, that is, 242 thousand out of the 255 thousand producers without land were family farmers. In this contingent, there were gatherers, honey producers or producers that had ceased their production in temporary areas. Data from former census cannot be compared to the new census in terms of the applied categories, which were then only four and now they include six categories.
30
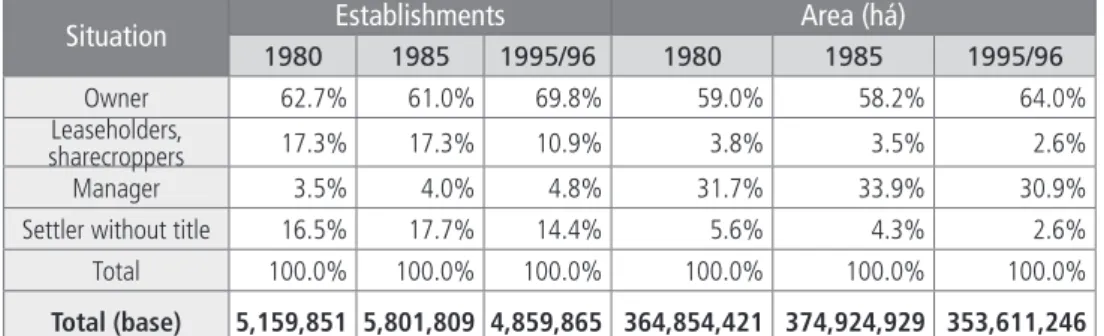
Table 10. Share of establishments and their total area according to the producer’s situation in relation to the land (in%)
Situation Establishments Area (há)
1980 1985 1995/96 1980 1985 1995/96
Owner 62.7% 61.0% 69.8% 59.0% 58.2% 64.0%
Leaseholders,
sharecroppers 17.3% 17.3% 10.9% 3.8% 3.5% 2.6%
Manager 3.5% 4.0% 4.8% 31.7% 33.9% 30.9%
Settler without title 16.5% 17.7% 14.4% 5.6% 4.3% 2.6% Total 100.0% 100.0% 100.0% 100.0% 100.0% 100.0%
Total (base) 5,159,851 5,801,809 4,859,865 364,854,421 374,924,929 353,611,246
Source: Agriculture/Livestock Census – IBGE (1980, 1985, and 1995/96)
In the 2006 Census, 72.6% of all the establishments and 93% of the area were held by the owners of the land, 15% had temporary or precarious access of 5.2% of the total area. Among these 15%, the large part was of settlers without title (412 thousand establishments or 8% of the total). In other words, the data of the Census indicated an expressive concentration of area that had owners. There was a relative decline of the establishments and areas temporarily and precariously occupied. The FAO/INCRA study characterized the farmers’ situation in relation to the land in four categories: (owner, leaseholder, sharecropper, and settler without title). The categories “settled without definite titles” and “producer without land” were not described and data of the number of establishments and the area per region was released. Although it is not possible to compare the data obtained using the criteria in the Family Farm Law with those from the FAO/INCRA study, in general terms, the results point to the same direction, approximately three quarters of family farmers have access to the land as owners. The data reveals that among the establishments with temporary or precarious access to the land, the proportion of family farm establishments is similar or superior to the national average. Amongst the total of settlers without title and sharecroppers, 89% of the establishments were of family farmers. Amongst the leaseholders, 85% had the same characteristic. The area occupied by family farm settlers without title represented 48% of the total area in this situation and the area occupied by partners, 36%. The share of non-family establishments was very little amongst the producers without area or settled without definite titles. The data also shows that
31
the average area of the establishments of the category “settled without definite titles” (23.9 hectares) is larger than all other family farming categories, including the owners (21.6 hectares).
5.6. Employment
The Agriculture/Livestock Census registered 12.3 million people employed in family farming (74.4% of employed persons) in 12/31/2006 with an average of 2.4% employed persons at the age of 14 or older. The non-family establishments employed 4.2 million people, a number that corresponds to 25.6% of employed labor. Amongst the people employed in family farming, the large majority were men (2/3), but the number of women (1/3 of people employed) was also significant: 4.1 million women. In average, a family establishment had 1.75 men and 0.86 women employed at the age of 14 or older.
There is an important aspect about the people employed in the establishments: 909 thousand employed in family farming were younger than 14 years old, of this total 507 thousand were men and 402 thousand were women.
The following table indicates a drop in the number of people employed in agricultural establishments in Brazil since 1985. During this period until 2006, approximately 6.8 jobs were eliminated, that is 29% of the total. The difference found between the former Census and the current Census is of less than 1.363.346 people, a number that represents a drop of 7.6% in relation to the former survey.
Table 11. People employed in agricultural establishments
1980 1985 1996 2006
employed persons 21,163,735 23,394,919 17,930,890 16,567,544
Source: Agriculture/Livestock Census – IBGE (1980, 1985, 1995/96, and 2006)
The FAO/INCRA study on the 1995/96 Census revealed that family farming was the main generator of jobs in the country (13,780,201 people, or 76.9% of the total). This same variable, when applied on the 2006 Census, showed 13,048,855 employed people or 78.8% of the national total. This means that between the two censuses there was a reduction of 731.346 jobs in family farming establishments (5.3%), a number that represents a smaller proportional fall than that observed in national terms. Although there is a
32
decreasing tendency of people employed in the Brazilian agricultural and livestock sector as a whole, family farming was able to maintain proportionally a larger number of occupations if compared to non-family farming.
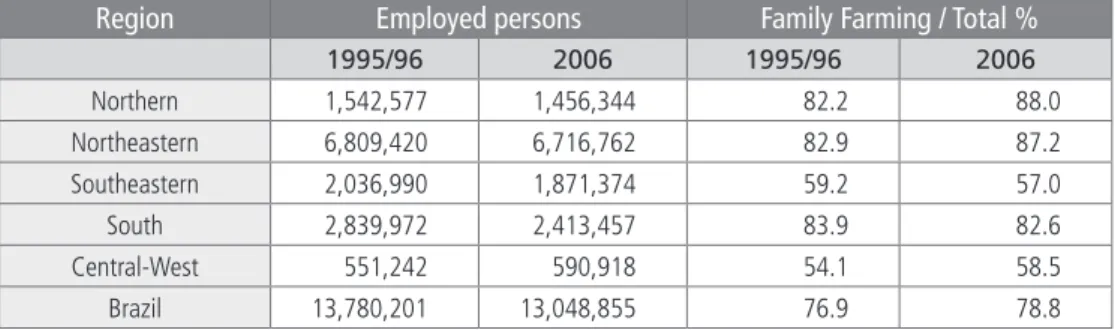
Comparison between the results of the 2006 Census and the 1995/96 Census according to the FAO/INCRA variables show a fall of the employed population in all family farming establishments in all the regions, except in the Central-West region where 39,676 jobs were created (+ 7.2%). The largest absolute and proportional drop occurred in the Southern Region (426,515 jobs, or 15% less than in the former Census). The share of family farming in the total of people employed increased in all regions, except for the Southeastern Region.
Table 12. People employed in family farming according to the FAO/ INCRA variable.
Region Employed persons Family Farming / Total %
1995/96 2006 1995/96 2006 Northern 1,542,577 1,456,344 82.2 88.0 Northeastern 6,809,420 6,716,762 82.9 87.2 Southeastern 2,036,990 1,871,374 59.2 57.0 South 2,839,972 2,413,457 83.9 82.6 Central-West 551,242 590,918 54.1 58.5 Brazil 13,780,201 13,048,855 76.9 78.8
Source: Agriculture/Livestock Census – IBGE (1995/96, and 2006)
The data in the 2006 Census reveal that, in average, there are 3.2 employed people per establishment in Brazil. In family farming establishments, this average falls to 2.8 people, while in the non-family establishments this number reaches 5.3 people. The results also reveal that there are 5.0 people employed in every 100 hectares of the total area in the country. In family farming establishments, this average goes up to 15.4 people every 100 ha of the total area and in non-family farms, it drops to 1.7 people in the same size area. This means that the number of employed people in family establishment areas was approximately nine times larger than in non-family establishments. When the suitable21 area for cropland and pasture is considered, the national average goes up to 6.2 people in every 100 ha.
21 Of the total area declared, suitable areas are those minus the areas occupied with constructions, improvements, pathways20, native woods and/or forests destined for permanent conservation or Legal Reserves (legal conservation areas) and unsuitable land for agriculture or livestock (wetlands, sandy soils, quarries, etc..).
33
The average for the family establishments reaches 17.9 people and the non-family establishments 2.1 people on the same size area. There were 1,062,301 employed with less than 14 years old in agricultural establishments. This represents 6.4% of the total of employed people in this situation. In family establishments, employed with less than 14 years old represent 7.4% of the total of employed people. In non-family establishments this proportion is 3.6%. Family farming is responsible for 86% of the total of employed with less than 14 years old in the agricultural sector. Nevertheless, if the relation to persons employed with less than 14 years old per establishment is considered, the average numbers of family farming and non family farming get closer. In 2006, there were 20.5 employed with less than 14 years old for every 100 establishments in Brazil. In family establishments, this average was 20.8 employed with less than 14 years old for every 100 productive units and in non-family establishments, 18.9. This difference represents approximately 10%. Among the 12.3 million employed people in family farming, 11 million of the employed people, that is, 90% were related to the producer. Joint effort is an important characteristic in family farming. Amongst the 11 million employed people related to the producer in family farming, 8.9 million live in their own establishment (81%), while another 2.1 million people are employed in the establishment but live outside the establishment, probably in villages or nearby urban centers.
The number of people employed in non-agricultural activities within the establishments was low: only 169 thousand people in family farming and 53 thousand in non-family. However, in 26% of the family establishments, the producer did not dedicate his fulltime working hours within the establishment because he devoted part of his time working outside his establishment, both in agricultural activities and non-agricultural activities. The occupation of producers in off-farm activities is common in developed countries22 and these results reveal its importance among family farming establishments.
5.7. Income and the value of production.
According to the IBGE’s Family Farming Report, family farming was responsible for 1/3 of the income of Brazilian establishments. The low share in profits can be explained, in part, because only 3 million
22 Mentioned in international literature as “Part Time Farming” using the agricultural establishment as a unit of analyses. The expression “pluriactivity” is used when the unit of analysis is the family.
34
(69%) of the family producers declared having had profit during the year of 2006, that is, almost one third of the family farmers declared that they did not have any profit that year.
The three million family farmers, who declared having had profit with the establishment, had an average income of R$ 13.6 thousand (approximately US$ 7.6 thousand), especially with the sales of vegetable products, which represented more than 67.5% of the obtained income. The second main source of income of family farming is obtained through the sales of livestock and their products, which represent more than 21% of the family farming income. Services for the integrated companies and sales from the family agro-industries are amongst other type of income.
More than 1.7 million family producers declared having received income besides the one obtained in the establishments, especially from resources from retirement and pensions (65%) and salaries from off-farm activities (24%). The annual average value of this income was R$ 4.5 thousand (approximately US$ 2.5 thousand) for family farming. This number was strongly influenced by resources from pensions and retirement, which equals an average monthly value of R$ 475.27 (approximately US$ 270). More than R$ 5.5 billion (approximately US$ 3.1 billion) reached family producers by means of retirement pensions, pensions, and special government programs in 2006. It is important to observe that these results are based on income declared by the producer and does not consider the other members of the family, which explains the small number of family producers (644 thousand) who declared that they received resources from especial government programs such as the Family Grant (Bolsa Família), a financial aid to poor families on condition that their children attend school. When the amount of all the production was considered and not only the income, 3.9 million family establishments were accounted as having declared some value of production. Family farming was responsible for 38% of the total value of production of the establishments. As an example of income, the production of vegetables was the main production (72% of the value of family farming), especially with temporary crops (42% of the value of production) and permanent (19%). In second place in value of production was livestock production (25%), especially large animals (14%).
The average value of annual production of family farming was of R$ 13.99 thousand (approximately US$ 7.7 thousand) of which poultry
35
achieved the lowest average value (R$ 1.56 thousand – approximately US$ 850) and floriculture the largest average value (R$ 17.56 thousand – approximately US$ 9.75 thousand).
Non-family farming presented a larger value of production in great part of activities, but in some of these, family farming produced the majority of production, exhibiting 56% of the value of large size livestock, 57% of the added value in the agro-industry, 63% of horticulture, and 80% of vegetable extraction in the country.
IBGE does not provide added information about the income of the establishments. In the Automatic Data Recovery System (SIDRA) there is only the data of the value of production of crops (temporary or permanent), horticulture, forestry and gathering in the former Census.
The FAO/INCRA study calculated the Total Income (TI) of family establishments from the sum of the Gross Value adjusted to Production, the indirect Agricultural Income and the Value of Production of Rural Industry and the subtraction of the Total Value of Expenses. The TI obtained in 1995/96 was R$ 2.717 (approximately US$ 1,700) and R$ R$19,085 (approximately US$ 10,580) in non-family establishments (does not include religious and government institutions). The TI per unit of area reached R$ 104/ha/year (approximately US$ 58) for the family establishments and R$ 44/ha/year (approximately US$ 25) in non-family establishments23. The relation between the TI of family farms and non-family establishments was of 1:7 and the TI relation per hectare was 2.4:1 for the same establishments.
The former Census did not measure the income with other non-agricultural activities in the establishment (handicraft, weaving, etc.., “rural tourism in the establishment” and “services for the integrated companies”) a reason for which it is not possible to compare the results obtained in 2006. For the same reason, the Census 1995/96 did not capture other incomes obtained by the producer such as resources from retirement, pensions, especial government programs and others. For this reason, it is not possible to obtain the variation income between neither the two nor the TI of family establishments.
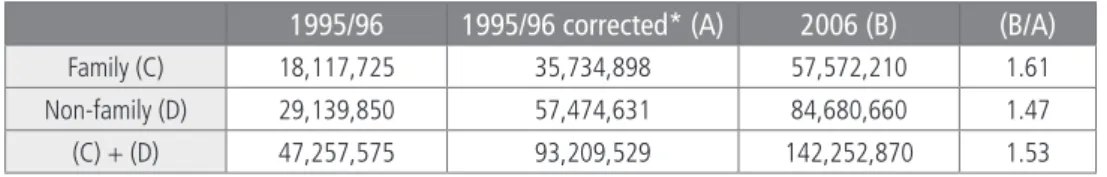
It is possible to obtain the Gross Value of Production (GVP) according to the variable from the FAO/INCRA study in 1995/96 and in 2006, as demonstrated in the following table.
23 The values corrected by the IPC-A (IBGE) from July 1996 to December 2006 are: TI family, R$ 5.359; RT employer, R$ 37.643; Family TI/ha/year, R$ 205; non-family RT/ha/year, R$ 116.