©2012 Published by the Institute of Plant Physiology and Genetics – Bulgarian Academy of Sciences Available online at http://www.ifrg-bg.com
Received: 23 july 2012 Accepted: 09 October 2012
INTRODUCTION
Cultivar identifi cation and estimation of genetic variability of populations are important in both variety protection and plant breeding. A new improved variety has to show distinct from other existing ones at least one characteristic, should demonstrate uniformity and stability
IDENTIFICATION OF FIELD PEA CULTIVARS (PISUM SATIVUM L.) USING MICROSATELLITE MOLECULAR MARKERS
Reis C. M. G.*, M. G. Diogo
Instituto Politécnico de Castelo Branco, Escola Superior Agrária (IPCB/ESA), Laboratório de Biologia, Quinta da Sr.ª de Mércules, 6001-909 Castelo Branco, Portugal
Summary. Conventionally morphological descriptors are routinely used for establishing the identity of varieties. This kind of descriptors has some disadvantages, namely most of them are quantitative, controlled by several pairs of genes, and their expression is infl uenced by environmental factors. Molecular markers have a potential to facilitate this procedure, increase the reliability of decisions, and substantially save the time and space needed for experiments. In this study we intended to identify 20 cultivars of fi eld pea (Pisum sativum L.), registered in the Community Catalog of Varieties, by microsatellites molecular markers. After DNA extraction, seven different loci were analyzed. PCR amplifi cations were conducted and the resulting fragments were separated on a 3.5% MS-8 agarose gel in TBE buffer. The gels were analyzed for the presence/absence of bands and a table with binary code was made. For each locus PIC value was calculated. The data were processed with the statistical software NTSYS-pc, using the SIMQUAL module and Jaccard similarity coeffi cient, followed by UPGMA cluster analysis. With the analysis of six polymorphic loci was possible to distinguish almost all of cultivars. The most informative loci were AD61 and AB53. The UPGMA dendrogram showed two main groups. The results showed a high potential and resolving power of SSR markers in distinct assessment. SSR markers might also be useful in germplasm management and genetic diversity studies. In the present research work, we have successfully employed high resolution agarose gel electrophoresis for genotyping with microsatellite markers in pea.
Keywords: cultivar identifi cation; DNA fi ngerprinting; high resolution agarose gel
electrophoresis; Pisum sativum L.; SSR markers
(EC 2100/94 norm). The morphological descriptors are routinely used for variety identifi cation. However, this kind of descriptors has some disadvantages, namely most of them are quantitative, controlled by several pairs of genes, and their expression is infl uenced by
environmental factors (Smýkal, et al., 2008). Moreover, the number of morphological markers is limited and does not always allow a clear and unambiguous identifi cation of an increasing number of cultivars. The use of markers at the DNA level allows fi nding solutions to these problems.
There are different types of molecular markers that permit unambiguous identifi cation of varieties, important both in the defense of intellectual property rights and as a way of ensuring the certifi cation of propagating material. The term DNA fi ngerprinting was introduced in 1985 (Jeffreys et al. 1985) and refl ects the robustness of the molecular markers that allow to associate to each genotype a profi le of discrete bands of DNA. A large number of molecular methods have been developed, which provide a large number of markers (RFLP, RAPD, SSR, IRAP, AFLP and RBIP, to name the most common ones).
Among the most widely used markers in crop species are simple sequence repeats (SSR) or microsatellites (Blair et al., 2007; Sarıkamış et al., 2009). Microsatellites are abundant small repetitive fragments in eukaryotic genome that display tandem repeats of a motif of two to six base pairs. They have a number of advantages over many molecular markers, including their co-dominant inheritance, relative abundance, extensive genome coverage, easy detection by PCR, as well as reproducibility and locus specifi city (Nybom, 2004; Ellis and Burke, 2007).
In recent years, molecular markers have played an important role in the assessment of genetic diversity among populations. Microsatellite markers have shown a high potential for the detection
of variability in pea, due to the high allelic variation detected, allowing clear identifi cation of varieties (Smýkal, 2008; Sarikamiş, 2009). SSR markers were also used in evolutionary studies (Choumane et al., 2008; Ford et al., 2002) and to map loci responsible for the resistance to diseases or another important trait (Pilet-Nayel et al. 2002; Loridon et al. 2005).
Following a study of agronomic performance of 20 cultivars of fi eld pea (Pisum sativum L.) in Castelo Branco region, east centre of Portugal (Reis et al., 2010), we decided to carry out the identifi cation and quantify the genetic diversity of twenty cultivars of fi eld pea using microsatellite markers. Our aim was also the optimization and establishment of a rapid and effi cient DNA fi ngerprinting method to evaluate the effi ciency of high resolution agarose gel electrophoresis in pea genotyping using microsatellite markers.
MATERIAL AND METHODS Plant material and DNA extraction
Twenty cultivars of fi eld pea (Pisum
sativum L.) from European common
catalogue of varieties of agricultural plant species were studied (Table 1). Young leaves from three individuals per accession were taken for DNA extraction. Genomic DNA was extracted from young leaf tissues using the DNeasy Plant Mini Kit (Qiagen, 2006).
Simple sequence repeats analysis
Seven SSR markers, originated from a pea genetic map constructed by Loridon et al. (2005) were studied to detect polymorphisms and assess inter genetic diversity of the pea cultivars (Table 2). The
Table 1. Cultivars of fi eld pea (Pisum sativum L.).
Cultivar Country of offi cial acceptance and number of responsible for the maintenance
ALEZAN FR 8174 ALHAMBRA ES 225 ARTHUR FR 11539 AUDIT FR 13262 CARTOUCHE FR 9295, UK 182 CORRENT IT 2 CHEROKEE FR 11553 ENDURO FR 8444 GREGOR DE 147, FR 9295, UK 6136 GRISEL PT 2 GUIFILO ES 9 GUIFREDO IT 332 IDEAL ES 2041 ISARD FR 9504 JAMES FR 9295 KLEOPATRA DE 7627 LIVIA FR 8451 LUMINA FR 13262 ONIX FR 9295 PIXEL PT 2
ES – Spain; FR – France; DE – Germany; IT – Italy; PT – Portugal.
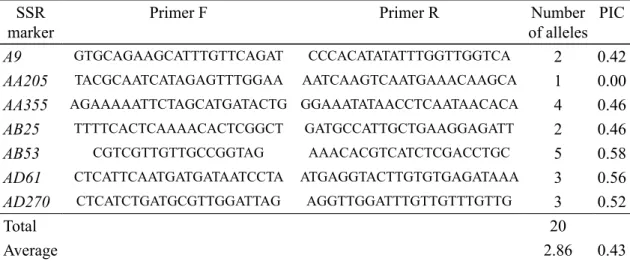
Table 2. Number of alleles and PIC generated by PCR using primers for seven pea (Pisum
sativum L.) loci.
SSR marker
Primer F Primer R Number
of alleles PIC
A9 GTGCAGAAGCATTTGTTCAGAT CCCACATATATTTGGTTGGTCA 2 0.42
AA205 TACGCAATCATAGAGTTTGGAA AATCAAGTCAATGAAACAAGCA 1 0.00
AA355 AGAAAAATTCTAGCATGATACTG GGAAATATAACCTCAATAACACA 4 0.46
AB25 TTTTCACTCAAAACACTCGGCT GATGCCATTGCTGAAGGAGATT 2 0.46
AB53 CGTCGTTGTTGCCGGTAG AAACACGTCATCTCGACCTGC 5 0.58
AD61 CTCATTCAATGATGATAATCCTA ATGAGGTACTTGTGTGAGATAAA 3 0.56
AD270 CTCATCTGATGCGTTGGATTAG AGGTTGGATTTGTTGTTTGTTG 3 0.52
Total 20
selection of the seven pea SSRs was based on their high polymorphism information content and the quality scores reported (Loridon et al., 2005). All analyses were performed at least twice to verify the results and check the reproducibility of allele scoring.
The polymerase chain reaction (PCR) mixture contained 20-40 ng template DNA, 0.2 µM of each primer, 0.2 mM of each dNTP, 0.6 U Ampli Taq Gold DNA polymerase (Applied Byosistems), 1.5 mM MgCl
2, and 1X PCR reaction buffer in
a total volume of 15 µl. Reaction mixtures without DNA were included as negative controls.
The amplifi cation conditions involved an initial step of 10 min at 95°C, followed by 35 cycles of 30 seconds at 95°C, 30 seconds at 51 or 56°C (Table 2) and 30 seconds at 72°C, with a fi nal extension at 72°C for 5 min. PCR amplifi cation was performed using the Biometra® PCR
System. PCR products were separated on a 3.5 % (w/v) MS8 (Condalab) agarose gel containing 1.0x TBE buffer. Gels were run at 90 V for 2 h and were stained with ethidium bromide at a concentration of 0.5µl/mg. MS8 is an agarose for molecular screening that improves resolution of small DNA fragments and PCR products and is used for applications that require effi cient separation of small DNA fragments and PCR products. DNA Ladder 100 bp (Biotools) was used for the approximate quantifi cation of the bands. The allele numbers per locus were determined based on their relative position in the gel.
Data analysis
Results were analyzed based on the presence (1) or absence (0) of amplifi ed fragments (amplicons) for each locus and
cultivar. The resulting binary data matrix was processed with the statistical software NTSYS-pc version 2.2 (Rohlf F. J. 1998), using the module SIMQUAL and Jaccard similarity coeffi cient (GSj), followed by cluster analysis UPGMA (Unweighted Pair-Group Method with Arithmetic Mean). Polymorphism information content (PIC) was calculated using the formula developed by Anderson et al. (1993).
RESULTS AND DISCUSSION
By employing high resolution agarose gel electrophoresis we were successful to clearly separate alleles for the seven microsatellite markers studied. Fig. 1 shows the separation of two alleles of the AB25 locus. Within the investigated group of 20 peas cultivars the number of alleles ranged from 1 (AA205) to 5 (AB53), detecting altogether 20 alleles (Table 2). The average number of alleles per locus was 2.86. PIC ranged from 0.42 (A9) to 0.58 (AB53), the average being 0.43. The PIC value allows evaluation of the discriminatory value of each locus, based not only on the number of alleles but also on their relative frequencies. In the AA205 locus only one allele was detected and its value as a marker for distinguishing cultivars was null. It was in AB53 and AA355 loci where a large number of alleles was detected, 5 and 4, respectively. In spite of the use of a relatively simple separation system, the six polymorphic loci studied provided precise identifi cation of almost all cultivars (Fig. 2). Only cultivars Ideal and Alezan had an identical set of bands profi les, presumably they might have been derived from the same pedigree. The similarity coeffi cients ranged from 0.083 to 0.857.
Figure 1. Agarose gel image of SSR amplifi cation profi les for AB25 locus. M – DNA Ladder 100 bp; 1 to10 – profi les for different fi eld pea cultivars; 11 – negative control.
The cluster analysis of SSR markers separated the pea genotypes into two distinct clusters. The fi rst cluster included the fi ve cultivars: Isard, Cartouche, Audit, Corrent and James. The second cluster included the remaining fi fteen cultivars and was further divided in two subclusters. The fi rst subcluster included
the Portuguese genotype Grisel while the second subcluster contained the remaining fourteen cultivars. In this subcluster Ideal and Alezan showed 100 percent similarity.
A high stability of cultivars was found, which can be assigned to the high degree of self-pollination in pea, as previously observed by Smýlak et al. (2008).
Figure 2. Phenogram based on Jaccard coeffi cients of similarity for 6 polymorphic SSR loci data in pea (Pisum sativum L.).
CONCLUSIONS
Molecular markers are useful in germplasm management as well as in genetic diversity studies as a tool for rapid variety identifi cation. The knowledge of genetic relationships is useful in plant breeding programs since it allows making informed decisions, especially regarding the choice of genotypes to cross for the development of new populations or to facilitate the identifi cation of parents to cross in hybrid combinations in order to maximize the expression of heterosis. In addition, molecular markers may be an important tool in plant variety protection.
In this study, molecular identifi cation of 20 cultivars of fi eld pea with microsatellites was carried out. By combined analysis of six polymorphic loci it was possible to distinguish almost all cultivars. However, the complete identifi cation of 20 cultivars implied the study of few additional loci. For the seven loci studied we detected 20 different alleles, AB53 and AD61 being the most informative loci for genetic variability.
Polyacrylamide gel electrophoresis, high resolution agarose gel electrophoresis and automated capillary electrophoresis can be used for microsatellite analysis. PAGE is a tedious and time-consuming process, while capillary electrophoresis can be performed more quickly and is good for high-throughput analysis but it is more expensive and requires more sophistication and expertise. Our results demonstrate that high resolution agarose gel electrophoresis is a reliable and appropriate approach for identifi cation of small length polymorphisms.
ACKNOWLEDGMENTS
This work was supported by the Operational Program for Cross-border Cooperation: Spain – Portugal, 2007-2013 (POCTEP), Project 0186_ AGROCELE_3_E.
REFERENCES
Anderson J A, Churchill G A, Autrique J E, Tanksley S D, Sorrells M E, 1993. Optimizing parental selection for genetic linkage maps. Genome, 36: 181–186.
Blair M W, Diaz J M, Hidalgo R, Dia, L M, Duque M C, 2007. Microsatellite characterization of Andean races of common bean (Phaseolus vulgaris L.). Theoretical and Applied Genetics, 116: 29–43.
Choumane W, Winter P, Baum M, Kahl G, 2004. Conservation of micro-satellite fl anking sequences in different taxa of Leguminosae. Euphytica, 138: 239–245.
Ellis J R, Burke J M, 2007. EST-SSRs as a resource for population genetic analyses. Heredity, 99: 125–132. Ford R, Le Roux K, Itman C, Brouwer
J. B, Taylor P W, 2002. Diversity analysis and genotyping in Pisum with sequence tagged microsatellite site (STMS) primers. Euphytica, 124: 397–405.
Jeffreys A J, Wilson V, Thein S L, 1985. Hypervariable ‘minisatellite’ regions in human DNA. Nature. 314: 67–73. Loridon K, McPhee k, Morin J, dubreuil
P, pilet-Nayel M L, Aubert G, Rameau C, Baranger A, Coyne C, Lejeune-Henaut I, Burstin J, 2005. Microsatellite marker polymorphism
and mapping in pea (Pisum sativum L.). Theoretical and Applied Genetics, 111: 1022–1031.
Nybom H, 2004. Comparison of different nuclear DNA markers for estimating intraspecifi c genetic diversity in plants. Molecular Ecology , 13: 1143–1155.
Pilet-Nayel M L, Muehlbauer F J, McGee R J, Kraft J M, Baranger A, Coyne C J, 2002. Quantitative trait loci for partial resistance to Aphanomyces root rot in pea. Theoretical and Applied Genetics, 106: 28–39.
Qiagen, 2006. DNeasy® Plant Handbook. www.qiagen.com.
Reis C, Rodrigues P, 2010. Study of agronomic performance of cultivars of proteaginous pea (Pisum sativum
L.) in Castelo Branco region, Portugal. Agroforum, 25: 5–11. Rohlf F J, 2002. NTSYS-pc. Numerical
Taxonomy and Multivariate Analysis System, Version 2.10. Exeter Software, New York. ISBN: 0-925031-28-3.
Sarikamiş G, Yasar F, Bakir M, Kazan K, Ergül A, 2009. Genetic characterization of green bean (Phaseolus vulgaris) genotypes from eastern Turkey. Genetics and Molecular Research, 8: 880–887. Smýkal P, Horácèk J, Dostálová R, Hýbl
M, 2008. Variety discrimination in pea (Pisum sativum L.) by molecular, biochemical and morphological markers. Journal of Applied Genetics, 49: 155–166.