Universidade de Aveiro 2007
Departamento de Economia, Gestão e Engenharia Industrial
Can Huang
China’s Innovation System and Industrial
2007 Industrial
Can Huang
China’s Innovation System and Industrial
Competitiveness in the Global Context
Tese apresentada à Universidade de Aveiro para cumprimento dos requisitos necessários à obtenção do grau de Doutor em Gestão Industrial, realizada sob a orientação científica do Professor Doutor Joaquim José Borges Gouveia, Professor Catedrático e a co-orientação científica da Professora Doutora Celeste Maria Dias Amorim Varum, Professora Auxiliar do Departamento de Economia, Gestão e Engenharia Industrial da Universidade de Aveiro.
Apoio financeiro da FCT e do FSE no âmbito do III Quadro Comunitário de Apoio.
O júri
presidente Prof. Dr. Jorge Carvalho Arroteia
Professor Catedrático da Universidade de Aveiro
Prof. Dr. Jorge de Carvalho Alves
Professor Catedrático da Universidade de Aveiro
Prof. Dr. Henrique Manuel Morais Diz
Professor Catedrático da Universidade de Aveiro
Prof. Dr. Joaquim José Borges Gouveia
Professor Catedrático da Universidade de Aveiro (Orientador)
Prof. Dr. José Carlos Dores Zorrinho
Professor Catedrático da Universidade de Évora
Prof. Dr. Manuel Fernando Cilia de Mira Godinho
Professor Associado da Faculdade de Ciências Económicas e Empresariais da Universidade Técnica de Lisboa
Profª. Drª. Aurora Amélia Castro Teixeira
Professora Auxiliar da Faculdade de Economia da Universidade do Porto
Profª. Drª. Celeste Maria Dias Amorim Varum
Agradecimentos I thank my advisor Prof. Borges Gouveia for his tremendous support and
patient guidance and co-advisor Prof. Celeste Amorim Varum for her inspiring discussion and advices over the past four and half years. I am indebted to my visiting research advisor Prof. Susan Cozzens in School of Public Policy, Georgia Institute of Technology in the United States of America for her relentless encouragement and great help. I am grateful to my close collaborators Prof. Yanyun Zhao, Prof. Naubahar Sharif, Prof. Mingqian Zhang, Ms. Zhe Qu, Dr. Xinxin Kong, Dr. Jiang Jiang, Dr. Jun Tu for their selfless and valuable aid in writing this thesis. I thank Prof. Augusto Medina for his help and support for many years. Without Prof. Augusto Media’s effort, I would not have chance to pursue my PhD study in University of Aveiro. I also thank Ms. Elena Harari for helping me translate the summary.
Palavras-chave Sistema Nacional de Inovação, Produtividade Cientifica, Empresa de Manufactura, China
Resumo O presente estudo compõe-se de quatro artigos científicos coerentemente organizados sob o tema geral do sistema de inovação Chinês e a competitividade industrial da China no contexto mundial.
Baseado nos conceitos da Teoria dos Sistemas Nacionais de Inovação, a presente pesquisa identifica os intervenientes na definição e implementação das politicas de inovação na China, comparando-os com um conjunto seleccionado de países membros da Organização para a Cooperação e Desenvolvimento Económico. O estudo utiliza as práticas destes países da OCDE como guia para analisar o sistema de inovação Chinês em cinco categorias: reforma das instituições públicas de Ciência & Tecnologia (C&T), politicas de financiamento, estrutura de suporte para a inovação no sector privado, politicas de recursos humanos, bem como acções legislativas. Através de uma análise detalhada, a pesquisa identifica os pontos fracos das políticas de inovação no país, nomeadamente: politica de educação e de recursos humanos, e direitos da propriedade intelectual.
Tendo por fundo o desenvolvimento do sistema de inovação Chinês, analisa-se com mais detalhe a transformação do analisa-sector de C&T herdado da economia centralizada. De modo a avaliar o impacto das reformas na eficiência do sector, quantifica-se produtividade científica dos institutos de C&T chineses. Os investimentos (inputs) e resultados (outputs) em termos de investigação e desenvolvimento (I&D) são analisados a nível nacional e regional através do modelo econométrico Polynomial Distributed Lag Model. Os resultados revelam uma taxa de crescimento da produtividade científica negativa nos institutos de pesquisa chineses desde a década de 1990.
A indústria e a política de inovação fortalecem a competitividade empresarial da China no mercado global. Utilizando dados de mais de 95.000 empresas de manufactura, o estudo analisa os factores que influenciam o recente crescimento das exportações de produtos manufacturados da China. A inovação de produto, a colaboração com investidores estrangeiros, e a forte concorrência no mercado nacional aumentam a probabilidade de entrada de empresas chinesas no mercado internacional. O custo unitário de mão-de-obra não aparece como factor decisivo para o sucesso das exportações das empresas chinesas. Investimentos em I&D também não contribuem para a competitividade das exportações chinesas, mesmo em sectores de alta tecnologia. Empresas estrangeiras dominam as exportações de produtos de alta tecnologia, mas têm investido menos em I&D do que as firmas nacionais. Visando analisar a inovação e a dinâmica industrial na China de uma
mútua entre a província de Guangdong e a Região Administrativa Especial de Hong Kong situada no sul da China. Os resultados mostram que entre 1997 e 2003, na província de Guangdong, a produtividade das empresas de manufactura de capital Chinês foi mais alta do que a das empresas estrangeiras - a maioria tem capital de Hong Kong. Há pouca evidência de que na província de Guangdong, a actividade económica das empresas estrangeiras de Hong Kong tenha contribuído para o crescimento da produtividade das empresas domésticas.
Sob o tema geral do sistema de inovação Chinês e da análise dos tópicos específicos ressaltam várias implicações para o futuro da política de inovação na China. Primeiro, argumenta-se que fortalecimentos do investimento em educação e dos regimes legais e administrativos de direitos de propriedade intelectual são prioritários. Segundo, reformas futuras do sector de C&T deve enfatizar melhoria do sistema de financiamento, fortalecimento da gestão interna das instituições de C&T e controlar as actividades ilegais. Terceiro, em termos de crescimento de produtividade e fortalecimento da competitividade industrial, o desenvolvimento de capacidade local é vital para uma economia em desenvolvimento como a da China.
Keywords National Innovation System, Scientific Productivity, Manufacturing Firm, China
Abstract This study is mainly composed of four research papers with different emphases, but coherently organized in the overarching theme of China’s innovation system and industrial competitiveness in the global context. This research identifies the stakeholders involved in the design and
implementation of China’s innovation policy and compares them with different government systems in the selected Organization for Economic Co-operation and Development (OECD) countries. It examines China's innovation policy in five categories: reform in the public S&T institutions, financial policy, business innovation support structure, human resource policy and legislative actions. Education and human resource policy and protection of intellectual property rights are identified as weak components of the Chinese innovation policy framework.
The study further examines the transformation of China’s Science &
Technology (S&T) sector inherited from the planned economy. To disclose the impact of the drawn-out reform on the efficiency of the whole sector, the research measures the scientific productivity of China’s S&T institutes. The R&D input and output data analysis is implemented at country aggregate and provincial level. Polynomial Distributed Lag model is used to uncover the structure of the lag between R&D input and output. The findings reveal that the growth rate of scientific productivity of China’s S&T institutes has been negative since the 1990s.
The successful industry and innovation policy significantly strengthens the competitiveness of Chinese enterprises in global market. Using the data of more than 95,000 Chinese manufacturing firms, the study explores the reasons for China’s recent manufacturing export growth. Product innovation,
collaboration with foreign investors and fierce competition increase the probability that Chinese firms enter international market. Unit labor cost and R&D investment are not decisive factors determining the export success of the firms, even in high-technology sectors. Foreign manufacturing firms dominated China’s high-technology product export, but they devoted less resource to R&D investment than domestic counterparts.
To study China’s innovation and industrial dynamics from the regional perspective, this study characterizes the context of mutual economic interdependence between Guangdong province and Hong Kong Special Administrative Region in Southern China. It shows that, in the years 1997-2003, domestic manufacturing firms in Guangdong gained on their foreign-funded counterparts—dominated by Hong Kong-based companies— in
productivity. Little evidence is found that the economic activity of Hong Kong-funded enterprises contributed to productivity growth in domestic manufacturing firms in Guangdong.
Covering the general and specific issues of China’s innovation system, the analyses of the thesis reveal several implications to the future innovation policy making in China. We argue firstly that strengthening investment in education and the legal and administrative regimes for intellectual property rights must be set as priorities. Secondly, China’s future S&T reform policy needs to
emphasize continuous improvement of the funding system, strengthen the internal management of the S&T institutions and fight misconduct activities. Thirdly, establishing indigenous innovation capability is vital for a developing country such as China in terms of boosting productivity growth and enhancing industrial competitiveness.
Table of Content
Chapter 1: Introduction... 1
Chapter 2 China’s Economic Transformation and Integration into Global Economy ... 7
2.1 Reform of the Economic Institution at Micro Level ... 10
2.2 Macro-economic Policy Reform ... 14
2.3 Policies Integrating China into the World’s Economy... 16
Chapter 3 Organization, Program, and Structure: An Analysis of the Chinese Innovation Policy Framework... 20
3.1 The Governance Models of Innovation Policy Matters in China and OECD Countries... 20
3.2 The Policy Actions Implemented in China for Promoting Innovation... 23
3.2.1 Reform of the Public S&T Institutions... 24
3.2.2 Financial Policy ... 25
3.2.3 Business Innovation Support Structure ... 32
3.2.4 Strengthening Human Resources Measures ... 34
3.2.5 Legislative Actions ... 35
3.3 The Analysis of China’s Innovation Policy in the OECD context ... 37
3.3.1 Education and Human Resources ... 42
3.3.2 Protection of Intellectual and Industrial Property... 46
Chapter 4 Scientific Productivity Paradox: The Case of China’s S&T system... 49
4.1 The Two Decades Reform of S&T System in China ... 51
4.1.1 The reform of the S&T funding system ... 56
4.1.2 The improvement of the R&D management in the S&T institutes ... 57
4.1.3 Strengthening the academy and industry relationship... 60
4.2 Scientific Productivity of Chinese S&T Institutes during the Reform... 61
4.2.1 Methodology... 61
4.2.2 Data... 64
4.2.3 Unit Root Test ... 66
4.2.4 Estimation Results ... 69
Chapter 5 Why the Manufacturing Firms in Developing Countries can be Competitive? The Evidence of China ... 74
5.3 Estimation Results and Discussion... 83
Chapter 6 Manufacturing Dynamics and Technological Catching-up: The Case of Guangdong Province and Hong Kong SAR... 95
6.1 The Economic Relationship between Hong Kong and Guangdong in Recent History. 95 6.2 Total Factor Productivity (TFP) and Labor Productivity Growth in Guangdong’s Manufacturing Sectors... 99
6.3 Identifying the Source of Manufacturing Sector Productivity Growth in Guangdong: Exploration of the Hong Kong Factor ... 102
6.4 Recent Policy Developments in Hong Kong and Guangdong ... 112
6.4.1 Discussion of Results... 112
6.4.2 The Recent Policy Reaction in Hong Kong and Guangdong ... 113
Chapter 7 Conclusion and Policy Implications... 121
List of Tables
Table 2.1: Breakdown of China’s Industry Added Value (Percentage): 1998-2004... 13
Table 2.2: Average Statutory Import Tariff Rate and Chinese Domestic Companies Authorized to Conduct Foreign Trade: 1978-2001 ... 18
Table 3.1: Chinese Reform Policy for Public S&T Institutions: 1978-2004... 26
Table 3.2: Transformation of Public R&D Institutions in China After 1999... 27
Table 3.3: China’s Current S&T Programs ... 28
Table 3.4: The Funding of Current Chinese S&T Program: 1996-2004 (Billion RMB) 30 Table 3.5: Development of the Chinese Science Parks and Incubators ... 33
Table 3.6: Comparison of Innovation Policy in China and the European Union Member States... 38
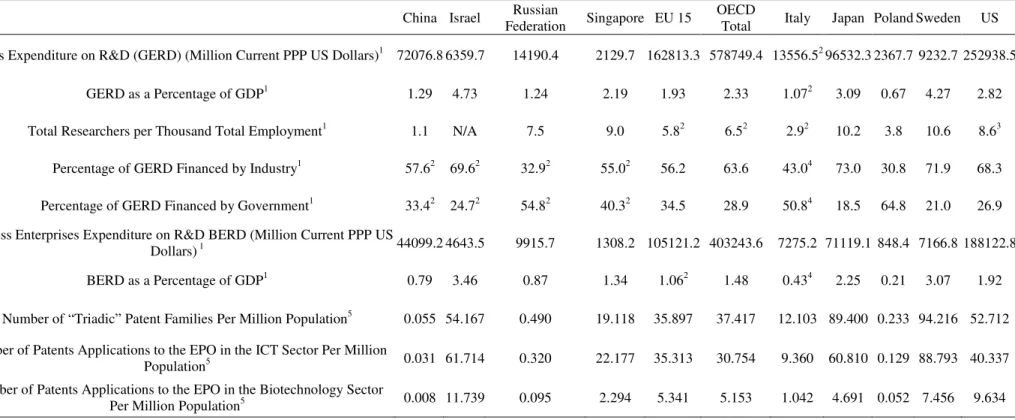
Table 3.7: Science and Technology Indicators for China and Selected OECD and non-OECD Countries... 41
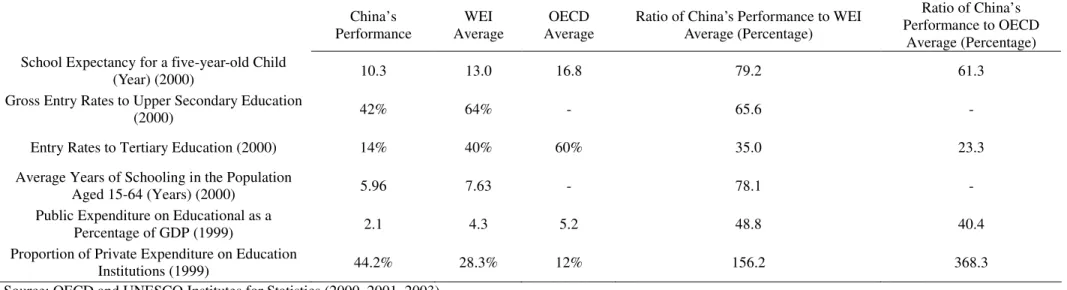
Table 3.8: China’s Education Performance in World Education Indicators Program.... 43
Table 3.9: China’s Budgetary Appropriation for Education in 1990s... 45
Table 3.10: Estimated Trade Losses (Million US Dollars) Due to Piracy and Piracy Rate (Percentage) in China: 1999-2003... 47
Table 4.1: Output Indicators for Chinese S&T System: 1991 – 2002... 50
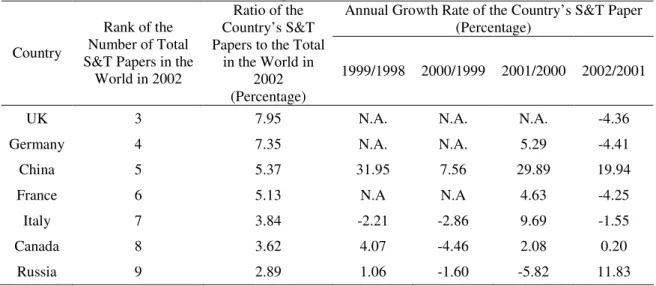
Table 4.2: S&T Papers Included in “Science Citation Index Expanded”, “Engineering Index” and “Index to Scientific & Technical Proceedings”: China and Several Other Countries... 50
Table 4.3: S&T Institutes in China’s Innovation System: 1987-2002 ... 52
Table 4.4: Centrally Planned S&T System and Market-Oriented S&T System ... 55
Table 4.5: Chinese Central Government’s Budgetary Expenditure and Appropriation for S&T: 1980-2002 ... 58
Table 4.6: R&D Input and Output of China’s S&T Institutes at Provincial Level ... 68
Table 4.7: Unit Root Test of the Aggregate Data Series: Kwiatkowski-Phillips-Schmidt-Shin Method ... 69
Table 4.8: Estimation Result of Function: International Paper and Patent Application. 70 Table 4.9: Scientific Productivity Growth Rate of China’s S&T Institutes: Aggregate Data... 72
Table 5.1: China’s Export Structure Change: 1985-2003 ... 77
Table 5.2: The Variables ... 80
Table 5.3: Summary Statistics ... 84
Table 5.4: Estimation Result: General Manufacturing Firms... 85
Table 5.5: Estimation Result: Foreign and Domestic Firms ... 86
Table 5.6: Estimation Result: Manufacturing Firms in Labor-intensive and High-technology Sectors... 87
Table 5.7: Foreign Enterprises in China’s High-tech Sectors: 1995 and 2002 Data... 89
Table 5.8: Harmonization of Manufacturing Sector Classification of ISIC Rev. 3.1, SITC, Rev. 3 and Chinese Industry Sector Classification GB/T 4754-2002 (Utilized in the Database) ... 93
Table 6.1: Percentage Contribution to GDP of Economic Activity in Hong Kong ... 96
Table 6.2: Percentage Breakdown of Industrial Gross Output Value in Guangdong Province, 1997 and 2003 ... 103
Table 6.3: Labor Productivity of State-owned, Collective, Shareholding, and Foreign Enterprises in Guangdong province (104 RMB/Person): 1997 and 2003... 104
Table 6.4: Average Annual TFP Growth Rate of State-owned, Collective, Shareholding, and Foreign Enterprises in Guangdong province (Percentage), 1997-2003... 105
Table 6.5: Regression of TFP Growth of Guangdong Domestic Manufacturing Firms on Several Potential Explanatory Factors: Fixed-Effect Model... 110
Table 6.6: Regression of TFP Growth in Guangdong Domestic Manufacturing Sectors on Foreign Capital Presence: 1999-2003 ... 111
Table 6.7: Average R&D Intensities of State-owned, Collective, Shareholding, and Foreign Enterprises in Guangdong Province (Percentage), 2001-2003 ... 116
Table 6.8: Several Innovation Indicators of State-owned, Collective, Shareholding, and Hong Kong/Macau/Taiwan-Invested and Foreign Enterprises in Guangdong: 2000 Data ... 117
Table 6.9: Harmonization of Manufacturing Sector Categorization ... 118
List of Figures
Figure 1.1: The Scheme of the Thesis ... 6
Figure 2.1: Engle’s Coefficient of Rural and Urban Households (Percentage) ... 8
Figure 2.2: Index of Net Income of Rural Households and Disposal Incomes of Urban Households ... 8
Figure 2.3: Inward Foreign Direct Investment in China ... 18
Figure 2.4: The Growth of China’s Export and Import Volume since 1980... 19
Figure 3.1: Chinese Innovation Policy Institutions ... 21
Figure 3.2: Chinese Innovation Policy Framework... 24
Figure 3.3: Human Resource Programs of Ministry of Education ... 36
Figure 4.1: Chinese S&T System in the Planned Economy... 53
Figure 4.2: Chinese S&T System in the Market Economy ... 54
Figure 4.3: China’s Gross Expenditure on R&D/GDP Ratio: 1978-2003 ... 59
Figure 4.4: R&D Input and Output in Chinese S&T Institutes: Aggregate Data... 67
Figure 5.1: Firm’s Export Price and Production Cost ... 76
CEEC Central and East European Countries CHTF China High-Technology Fair
EU European Union
GDP Gross Domestic Product
HKMT Hong Kong, Macau and Taiwan
ICT Information and Communications Technology IPO Initial Public Offering
IPR Intellectual Property Right
MOST Ministry of Science and Technology
OECD Organization for Economic Cooperation and Development PCC Productivity Promotion Center
SCI Science Citation Index SOE State-owned Enterprises S&T Science and Technology TFP Total Factor Productivity
TVE Township and Village Enterprises WEI World Education Indicators
WIPO World Intellectual Property Organization
WTO World Trade Organization
Chapter 1: Introduction
China started its reform of the planned economic system in the late 1970s. As described in Chapter 2 of this thesis, the gradual transformation of the Chinese economy began from the rural area first and then expanded to the industry sector. The reform overhauled the micro- and macro-level economic policies and the foreign trade and investment institution. Market oriented economic system has been established to govern the Chinese economy, though lasting effort is still needed to transform the remaining planned institution and improve the efficiency of the current system.
Over the past two decades, China intended to promote economic and social transformation through a coordinated Science & Technology (S&T) and innovation policy. Therefore, the Chinese innovation policy has experienced complicated and diverse changes. The transition of the Chinese innovation policy till the 1990s was described by the previous literature by International Development Research Center (1997), Gu (1999) and Lu (2000) etc. However, the swiftness in the evolution of China’s institutions and organizations has made the existing literature, to some degree, obsolete. To provide the updated analysis of the strengths and weaknesses of China’s current innovation system, we focus on the following questions in Chapter 3 of this study: Which government bodies have become responsible for innovation policy at the national level? Which organizations can be considered important participants in the process of policy making?
The Organization for Economic Co-operation and Development (OECD) (1996) indicates that an efficient innovation policy strategy must combine a number of macro-level policy actions. Its success depends on the validity of the policy framework and the mutual support among the different policy actions. The lack of coherent policy practices in certain aspects of national innovation system will limit the effect of other well-functioned policies, and thus harm the whole system. Few of the existing studies have adopted the OECD’s view to organize the analysis on the Chinese innovation policy by stressing the balance and the coordination of the policies in different areas. To what extent has China developed a coherent innovation policy? In which area of the innovation policy does China do well, and where does it lag behind compared with
international practices? To fill this gap of the literature and answer these questions, we examine various components of China’s innovation policy framework also in Chapter 3, with the comparison to the OECD countries’ practices. We identify several weak parts of the Chinese innovation system and intensively analyze two of them: education and human resource policy and protection of intellectual property rights.
The Chinese government made tremendous effort to reform the S&T system in order to establish an effective and efficient innovation system. The S&T system reform constitutes a critical part of the transformation of the whole national innovation system. The reform was launched in 1985 when “The Resolution of the Central Committee of the Communist Party of China on the Structural Reform of the Science and Technology System” was issued. Through this reform, Chinese leaders were eager to expand the successful changes in the agriculture sector that took place in the late 1970s to the industrial and S&T sectors. One of the direct impacts of this reform is that many new R&D units had been established and developed inside universities and enterprises. The S&T institutes which had formerly undertaken almost all the R&D activities in the planned era have been losing their dominance in the country’s innovation system since 1985.
China’s two-decade reform of its S&T system is not unique in the world. A similar transformation also took place in the post-socialist Central and Eastern European Countries (CEECs). The low efficiency of the planned S&T system in the CEECs was widely addressed by Hanson and Pavitt (1987), Meske (1998), OECD (1969) and Radosevic (1999), etc. Due to the similarities lying in the Chinese and the CEECs’ planned S&T systems, we believe that before the reform, the scientific productivity of China’s S&T institutes also remained at a low-level. Since a low scientific productivity prevailed in the planned system in China, it is inquisitive to ask whether the systematic reform has enhanced the efficiency of China’s S&T sector. Most of the recently published literature such as those by Zhou and Leydesdorff (2005), OECD (2002) and Cao (2002) either focuses on the progress of China’s scientific research and technological development measured respectively by publication and patent application, or dwells on the reform policy actions. Few of them examine the causal relationship between the policy and its performance. Is the explosive increase of China’s scientific
only because of the larger amount of the governmental investment? To answer these questions, in Chapter 4 we measure the scientific productivity of China’s S&T institutes through adopting the econometric methodology elaborated in Adams and Griliches (1996a, 1996b) and Crespi and Geuna (2004). The findings indicate that the average annual growth rate of scientific productivity of China’s S&T institutes has been negative since the 1990s, though the rapidly growing investment from the governments flew into the sector.
In market economy, firms are the driving force of innovation. Fostering and promoting innovation in firms is one of the primary tasks of a national innovation system. The global competitiveness and innovation performance of firms thus indicate the effectiveness and efficiency of a country’s innovation policy. Given the vital role which firms play in a country’s innovation system, in this study we give particular attention to the innovation performance of the Chinese firms to shed light on the issues such as how the innovation or industry policy affects the firms’ performance and what type of policy should be implemented to improve the industrial competitiveness. In Chapter 5 we focus on the Chinese manufacturing firms’ export competitiveness to identify which factors contribute to the recent surge of manufacturing exports from China. We also study the dynamism of manufacturing sectors and innovation policy actions in Guangdong province and Hong Kong Special Administrative Region (SAR) in Southern China in Chapter 6.
Since the second half of the 1990s, China’s merchandise export has grown two times faster than that of the world average. In 2004, China became the biggest exporter of Information and Communications Technology (ICT) goods (180 billion US Dollars), surpassing Japan and the European Union in 2003 and taking the lead over the United States in 2004 (OECD, 2005). Since the technology- or knowledge-intensive sectors were traditionally dominated by firms in developed countries, we would like to identify the factors that contributed to the international competitiveness of these manufacturing sectors in developing countries such as China. A majority of the studies in this area examine cases of exportation in industrialized countries. Only a handful of studies such as those by Aggarwal (2002) on Indian firms, Zhao and Li (1997) and Liu and Shu (2003) on Chinese industry, and Ozcelik and Taymaz (2004) on Turkish firms have focused on the export industry in developing countries. These papers in general indicate
that the success of the export business in developing countries has been attributed to the low cost of labor. However, how important labor costs are compared with other factors that determine export performance? The literature also indicates that multinational firms have been responsible for a significant portion of manufacturing transfer to developing countries. However, once they acquire transferred export business, it is not clear if the developing countries can develop the technological competence necessary to move up the ladder in the global value chain through learning by doing or technology transfer.
In Chapter 5 we answer the above questions by evaluating data of more than 95,000 Chinese manufacturing firms. We find that neither unit labor cost nor R&D investment has been a contributing factor to the export success of Chinese firms, even in high-technology sectors. Although foreign enterprises dominate high-tech exports in China, domestic firms are more committed to R&D than their foreign counterparts. However, the primary reason why Chinese firms have increased exports to foreign markets is their product innovation, connection to foreign capital, and the fierce competition among them.
Among developing countries, China has attracted the most foreign direct investment (FDI) over the last two decades. Around one-third of FDI to China over the period 1985-2003 went to Guangdong province. Guangdong was able to attract 30 percent of China’s total FDI in large part because of its geographical and cultural proximity to Hong Kong, Macau, and Taiwan (hereafter referred to as HKMT), all three of which have invested heavily in China over the past 25 years. From Hong Kong’s perspective, Guangdong province is the most important investment destination in China. Since the mid 1990s, Hong Kong-based entrepreneurs have allocated almost half of their investments in China to Guangdong province. We regard that the dynamism of manufacturing sectors in Guangdong can be used as a good case to study the Chinese manufacturing firms’ technological catching-up and their interaction with foreign invested companies given the fact that FDI has strong impact on China’s industrial competitiveness and innovation policy. More interestingly, the productivity growth of the domestic manufacturing firms in Guangdong vis-à-vis that of the foreign invested firms which are controlled principally by the Hong Kong entrepreneurs influence the innovation policy making in these two neighboring regions.
To understand Hong Kong’s economic interdependence with Guangdong, many scholars have thus far either dedicated themselves to analyzing Hong Kong’s economic transition in the context of manufacturing cross-production in Guangdong (see, for example, Eng, 1997; Hollows, 1999; Kwong, et al., 2000) or focused on the two regions’ economic integration from an exclusively Hong Kong perspective (Tuan and Ng, 1995, 2004). Few studies have examined the development of Guangdong’s domestic manufacturing firms and their interaction with foreign counterparts, given the context that foreign businesses, principally Hong Kong-run enterprises, have flourished in Guangdong. Yeung’s articles (2001, 2002) are exceptions in linking Guangdong’s industrial development to the Hong Kong factor, but these studies consist almost entirely of qualitative analyses.
In Chapter 6 we center our analysis on the productivity performance of Guangdong’s locally and foreign-funded manufacturing sectors over the period 1997-2003. By highlighting changes in productivity that vary with changes in manufacturing firm ownership, we reveal that domestic (Guangdong) firms have been catching up with their foreign counterparts, including Hong Kong-based firms, even though foreign firms have successfully strengthened their dominant position in Guangdong’s manufacturing sectors. We then explore the potential impact of economic activity undertaken by foreign firms—both HKMT-funded and non-HKMT-funded firms—on productivity growth in Guangdong’s manufacturing sectors, but find no evidence of a significant positive impact.
The rest of the thesis is organized as shown in the following Figure 1.1. Chapter 2 outlines the milestone steps of China’s transformation to the market oriented economy and its gradual integration into the global economy. Chapter 3 analyzes China’s innovation policy framework and compares China’s practice with those of advanced OECD countries. Chapter 4 studies the reform of S&T sector in China. Through Polynomial Distributed Lag model, we measure the scientific productivity of the Chinese S&T institutes in the reform period. Chapter 5 explores the factors contributing to competitiveness of the Chinese manufacturing firms in export market. Chapter 6 takes Guangdong province and Hong Kong SAR as a case to examine the manufacturing dynamics and technological catching-up that took place in the region of Southern China. Chapter 7 concludes the thesis.
Figure 1.1: The Scheme of the Thesis
Chapter 1 Introduction
Chapter 2 China’s Economic Transformation
Chapter 3 China’s Innovation Policy Framework
Chapter 4 Reform and Productivity of China’s S&T Institutes
Chapter 5 Export Competitiveness of the Chinese Manufacturing Firms
Chinese Innovation System: Reform and Performance
Chapter 6 Technological Catching-up of Manufacturing Firms in Guangdong Province
Chapter 7 Conclusion
Industrial Competitiveness and Technological Dynamics
Chapter 2 China’s Economic Transformation and
Integration into Global Economy
China’s transformation into a dynamic market economy and its integration into global economic system have been dramatic in the last quarter of the 20th century. Along with the transformation, China achieved unprecedented economic growth. Official statistics show that Gross Domestic Product (GDP) grew from 658 Billion RMB in 1978 to 6776 Billion RMB in 2004 (1990 constant price), expanding by more than 10 times. GDP per capita increased from 148 US Dollars in 1978 to 1700 US Dollars in 2005 (World Trade Organization, 2006). In 1978, on the eve of economic reform, China was the world’s 32nd ranked exporting country (Lardy, 1992). In 2004 China already became the 3rd largest merchandise trader in the world after the United States and Germany (National Bureau of Statistics, 2005; World Trade Organization, 2005). China not only weathered the impact of Asian financial crisis in 1997, but also became an important source of growth for the world economy. During 2001-2003, China accounted for about 24 percent of world growth (PPP-based GDP)(Prasad and Rumbaugh, 2004).
The drastic economic development significantly ameliorates the living condition of the people in the country. Measured by World Bank’s 1 US Dollar per day poverty criterion, the population below the poverty line is estimated to drop from about 490 million in 1981 to 88 million in 2002 (World Bank, 2003). Rural and urban households’ ratios of expenditure on food to all expenditure, known as Engle’s coefficient, both declined in the past two decades. The Engle’s coefficient of rural households decreased from 67.7 percent in 1978 to 47.2 percent in 2004. The coefficient of urban households fell from 57.5 percent to 37.7 percent (The change for the 1989-2004 period is seen in Figure 2.1). In line with the faster decline of Engle’s coefficient of urban households, the disposal income of urban households increased more rapidly than the net income of rural households (Figure 2.2). In 2004, the disposal income of urban households and the net income of rural households were almost five times higher than their levels in 1978, respectively.
Figure 2.1: Engle’s Coefficient of Rural and Urban Households (Percentage) 35 40 45 50 55 60 1 9 8 9 1 9 9 0 1 9 9 1 1 9 9 2 1 9 9 3 1 9 9 4 1 9 9 5 1 9 9 6 1 9 9 7 1 9 9 8 1 9 9 9 2 0 0 0 2 0 0 1 2 0 0 2 2 0 0 3 2 0 0 4
Engle's Coefficient of Rural Households
Engle's Coefficient of Urban Households
Source: Various issues of China Statistical Yearbook.
Figure 2.2: Index of Net Income of Rural Households and Disposal Incomes of Urban Households
0 100 200 300 400 500 600 1978 1980 1985 1990 1995 2000 2004
Index of Net Income of Rural Households
Index of Disposable Income of Urban Households
The past twenty five years growth at an annually average 9.5 percent made China a 2 trillion US Dollars economy. In 2006 China surpassed the United Kingdom to become the fourth largest economy in the world. The size of Chinese economy may look less impressive given the fact that the country has a population of 1.3 billion. Nevertheless, the transformation taking place in the past quarter of the century is undoubtedly spectacular. The reform policy implemented in China gradually transformed the planned economic system to market oriented system. The open policy broke down the self-isolation and steadily integrated China into the world economy.
China’s transformation from planned to market economy started shortly after the third plenary session of the 11th central committee of Communist Party of China in 1978. At the outset of the reform, there was no blueprint other than aspiration to modernize the country and raise living standard of the people in the leaders’ agenda. There was no successful experience existing in other large economies, either, which could guide the transition in China. The incremental and trial and error reform process was vividly described by the late leader Deng Xiaoping as “crossing the river by groping the stones”. In 1982, a concept of “building the socialism with Chinese characteristics” was put forward by the leadership as an overarching target for all kinds of reform policies. Although “the socialism with Chinese characteristics” was iterated in the addresses of the leaders, its connotation and denotation have been rather ambiguous, which provides evidence that since the outset the economic transition in China had no predetermined strategy to follow.
According to Lin et al. (2003), China’s gradual transition from planned to market economy is close to Pareto improvement or Kaldor improvement. The economic agents such as enterprises and rural households were bestowed autonomy in the reform. With the incentives, they were motivated to produce more, bringing more benefit to state and themselves. This type of Pareto improvement made no one in the economic system worse off. Although some reform measures would be unavoidably against the interest of certain classes in the society, government could compensate them with the gain generated by the reform. This process is known as Kaldor improvement. The gradual transition in the nature of Pareto and Kaldor improvement diminished the resistance to the policies and contributed the political stability during the reform period.
2.1 Reform of the Economic Institution at Micro Level
The household responsibility system was the first successful reform initiative implemented across the country, particularly in China’s rural area. Before its implementation, production team was the basic unit of accounting and production in rural China (Choe, 1996). The net team income was allocated to farmers who were also team members at the end of a year, based on the work points each farmer accumulated during the period. Work points were granted according to the labor days, peers’ assessment of the quality of the work and the pre-assigned grade to each team member. It was extremely difficult to supervise the quality of the work in the production team system since the work points by and large were determined by the labor days, regardless of the effort that individual made in the collective agriculture work.
Under the system of household responsibility, land was allocated to households according to the number of their members. Farmers’ work was neither evaluated by work points nor by labor days. Farmers were entitled to keep the production residual after paying the state tax, fulfilling the procurement quota, and contributing to public fund or welfare. They were thus motivated to increase output to have more at their disposal and accordingly there was no need to supervise farmers’ work. The household responsibility system significantly boosted the agriculture production. The net value of agricultural product and grain output grew at 7.7 percent and 5 percent annually in the period of 1978-1984 (Lin, 1997). The system also greatly enhanced the living standard in rural area, so it gained popularity among farmers shortly after its implementation.
Transforming the planned industry sector in China was implemented through two parallel channels, which are reforming state-owned enterprises (SOEs) and facilitating the establishment of firms with diverse ownership such as collective, private and foreign firms, etc. As Zhang (1997) argued, the reform of state-owned enterprise at the early 1980s aimed to distribute the decision rights and residual claim from central planned authority to managers of enterprises. The policies launched in the period allowed SOEs to retain part of profit as bonus to managers and employees, decentralized fiscal
of which enhanced the autonomy of SOEs. In the mid and late 1980s, the reform policy advanced to replace the profit remittance of SOEs by corporate tax. Direct fiscal appropriation was changed to indirect bank loans. The contract system was implemented in large and medium SOEs and some small ones were allowed to be leased (Qian and Wu, 2003).
However, even with these measures SOEs still lost market share in the competition with private and foreign firms. The governments had continuously subsidized SOEs through appropriating fiscal funds or indirect bank loan until the late 1990s. Policy makers realized that merely enhancing autonomy of SOEs was not enough for improving their productivity and efficiency to the extent that they could compete effectively against private and foreign companies. Therefore, in 1997 a drastic reform policy of shedding small SOEs and retaining the control of large ones was carried out. The number of SOEs in industry sector dropped precipitously from 110000 in 1997 to 53489 in 2000. Frazier (2006) estimated that about half of the Chinese SOEs, which were typically small, were privatized, shut down or converted to the firms with different ownership. Along with this dramatic restructuring of the state sector, 40.3 million people were laid off between 1995 and 2002, but non-state-owned sectors only created 16.8 million jobs at the same time (Frazier, 2006).
As the reform of state-owned industry sector went further, how to manage the remaining state-owned assets, many of which are large enterprises, became a high prioritized issue in the leaders’ agenda. State-owned Assets Supervision and Administration Commission was established in 2003 to assume the responsibility of “investor” of state-owned assets. The Commission aims to preserve and increase the value of state-owned asset through enhancing management of the enterprises, establishing effective corporate governance system and strategic adjustment of the structure of state sector.
While reforming SOEs, the Chinese government removed the restriction of setting up non-stated-owned enterprises such as private and cooperative companies after the late 1970s. It also allowed foreign firms to establish joint ventures with Chinese partners. Less plagued by principal agency problem and operated under the harder budget constraints, non-owned enterprises achieved higher productivity than their
state-owned counterparts (Jefferson et al, 1996; 2000). The diversification of ownership triggered the subsequent high-speed expansion of private and foreign sectors. The non-state-owned enterprise soon became the engine of economic growth and industrialization. The output of SOEs accounted for 78 percent of national industrial output in 1978, but the proportion was down to 43 percent in 1993, and it continuously declined in the second half of the 1990s (Table 2.1). The share of SOEs in commerce sector decreased from 55 percent in 1978 to 40 percent in 1993 (Qian and Wu, 2003).
Among the non-state enterprises, the local government-controlled collective enterprises, known as township and village enterprises (TVE), grew remarkably in the 1980s and early 1990s. Kung and Lin (2007) summarized several reasons accounting for the extraordinary development of TVEs in rural China, which include the political institution in the 1980s favored market-oriented but public owned enterprises such as TVEs; Fiscal decentralization provided incentives for local cadres to promote the development of public enterprises under their purview; once the oppressed demand for consumer products was released in the early 1980s, abundant market opportunities were created for TVEs; and regulated by relatively hard budge constraint and winning the favor of state-owned banks, TVEs received massive loans from banking system. Due to the above reasons, from 1980 to 1995, the output of TVEs grew at an average annual rate of more than 30 percent. In 1995, TVEs produced 44 percent of total industry added value and employed 28 percent of China’s total rural labor force (Ministry of Agriculture, 1998). However, since the mid 1990s, as the governments progressively removed the restriction on the private sector, majority of TVEs were either privatized or turned into shareholding companies.
Table 2.1: Breakdown of China’s Industry Added Value (Percentage): 1998-2004
1998 1999 2000 2001 2002 2003 2004 State-owned or State-controlled Enterprises 57 56 54 52 48 45 42
Collective Enterprises 30 26 22 18 16 14 12 Shareholding Enterprise N.A. N.A. 29 37 40 42 44 Foreign Enterprises including Hong Kong, Macau and Taiwan-invested Enterprises 21 22 24 25 26 28 28 Private Enterprises N.A. N.A. 5 8 10 13 15 Source: Various issues of China Statistical Yearbook
2.2 Macro-economic Policy Reform
The reform aiming to establish market-oriented macro-economic institution includes price reform, foreign exchange rate reform, tax and fiscal reform and financial system reform. Different from the “shock therapy” policy implemented in Russia, China adopted a “dual track” mechanism to transform its “planned price”. The price of planned quantities that enterprises produced was maintained in the reform period while the price of the products at the margin was freed up. The economic agents had incentive to produce more after that their obligations defined by the planned system were fulfilled (Lau et al., 1997). This incremental reform was successful in the sense that the change is Pareto-improving and the planned track was gradually phased out in the early 1990s. By 1993, 82.7 percent of agriculture products, 84.6 percent of consumer goods, 81 percent of industrial production materials and 30 percent of service charges had been traded with market price (Garbaccio, 1995).
China’s reform on foreign exchange rate unfolded in 1979. Internal Settlement Rate, which came into force in 1981, was applied to trade-related foreign exchange transactions, and a more appreciated official exchange rate was used to non-trade-related transactions such as remittances and tourism (Lin and Schramm, 2003). This Internal Settlement Rate was abandoned in 1985 because it brought severe distortions to the foreign exchange market. In about the same time, the foreign exchange swap market was established, where foreign-funded enterprise and domestic institutions could swap actual foreign exchange. On January 1, 1994 the official and swap market rates were unified at the swap market rate of RMB: US Dollar = 8.7:1 that prevailed at the end of 1993. It was in 1996 when China allowed the convertibility of current account. And one decade later in July 2005 China moved one step further toward full convertibility by replacing the peg of RMB against the US Dollar with the linkage of the exchange rate of RMB to a basket of foreign currencies.
China’s fiscal system reform between the late 1970s and 1994 was characterized by revenue sharing and fiscal decentralization. In the fiscal reform, the role of public
budget authority through a series of negotiation with the central government, and the revenue sharing arrangements with central government differ greatly among different provinces. In 1994, a new round of fiscal reform was launched, which aimed to strengthen the central government’s fiscal authority over the localities and restrained the bargaining between the central and local governments. The new fiscal system distinguished the national and local taxes and collected them separately by national tax bureau and local tax bureau. The reform curbed the decline of the ratio of budgetary revenue to GDP and the ratio of central government’s budgetary to total budgetary revenue (Loo and Chow, 2006).
China’s financial institutions were merely established in the late 1970s. People’s Bank of China was separated from Ministry of Finance in 1978 and soon designated as central bank. The government re-established the Agriculture Bank of China, the Bank of China, and the China Construction Bank and set up the Industrial and Commercial Bank in the same period to take over the lending responsibilities of mono-banking system. Although the effort had been made to improve profit incentives of the aforementioned four state-owned banks and quality of their portfolios, policy loans, mainly to state-state-owned enterprises, still accounted for a significant proportion of their lending till the early 1990s (Park and Sehrt, 2001). Because of the policy lending to loss-making SOEs, a significant amount of the non-performing loans were accumulated in the four state-owned banks, which accounted for about 26 percent of total outstanding loans in 2001. Furthermore, the average capital ratios of the four state-owned banks, which were 7 percent in 2001, were lower than the Bank for International Settlements minimum of 8 percent (Deutsche Bank Research, 2002).
To reform the fragile banking system in China which is largely composed by the four state-owned banks, the government implemented a set of measures since the late 1990s. In 1999 and 2000, 169 Billion US Dollars non-performing debts of the state-owned banks were transferred to asset-management companies. In April 2003, China Banking Regulatory Commission was established to assume the supervisory responsibility that was previously performed by the central bank. The state-owned banks were required to strengthen credit assessment and loan recovery. Moreover, a consensus of reforming the four state-owned banks through listing them in stock markets was formulated among policy stakeholders. It was expected that after Initial Public Offering (IPO), the banks
would be able to raise capital, diversify the ownership structure and improve management and governance under the pressure of financial market.
To execute the strategy, the central bank lent 45 billion US Dollars of its foreign exchange reserves to recapitalize two of four major state-owned banks, i.e. the Bank of China and the China Construction Bank. The capital injection lifted up the capital asset ratio of the Bank of China from 7 percent in 2002 to 8.6 percent in 2004 and the ratio of the China Construction Bank from 6.5 percent to 9.4 percent. In addition, the two banks’ non-performing loan ratios were drawn down from 6.3 percent and 9.3 percent to 5.1 percent and 3.7 percent, respectively in the same two years period (Leung and Chan, 2006). The capital injection was an important step as part of a broader strategy for the reform of state-owned banks, which finally led to the successful Initial Public Offering of the China Construction Bank in Hong Kong stock market in October 2005 and the public listing of the Bank of China in May of 2006. The reform model of these two banks provided a solution example for the biggest state-owned bank, Industrial and Commercial Bank of China, which was public listed in October of 2006, and also for the Agriculture Bank of China.
2.3 Policies Integrating China into the World’s Economy
In order to welcome foreign investors, Chinese government in the 1980s set up five special economic zones, namely Shenzhen, Zhuhai, Xiamen, Shantou, Hainan to encourage overseas Chinese’s investment. A lot of favorable policies, including tax and non-tax incentives, were enacted by central and local governments to facilitate foreign investors to establish companies in the special economic zones (Wei, 2003). The business income tax rate for the foreign firms located in the zones was merely 15 percent, compared to 33 percent for domestic firms. In addition, these taxes were not levied during the first two years of operation (Branstetter and Feenstra, 2002). China’ huge market, governments’ favorable Foreign Direct Investment (FDI) policy, low cost for manufacturing constituted the centripetal force to attract the inward FDI to China. Hence, China’s inward FDI grew rather steadily from 1.26 Billion US Dollars in 1984 to 4.37 Billion US Dollars in 1991. After the government took a firmer stand to court
increased drastically since then. In 2004, China received 60.63 billion US Dollars FDI (Figure 2.3) and continued to be the most popular FDI destination among the developing countries.
Beyond welcoming FDI, Chinese government also took measures to dismantle the planned foreign trade system. The trading rights were expanded to a large number of state-owned companies and further to foreign and private companies. The number of commodities of which the trading rights were limited to state-owned trading companies was reduced. At the end of 1981, the 10 largest state-owned foreign trade corporations managed 76.6 percent of the Chinese exports and 81.3 percent of imports, but their shares dropped to 10 percent and 16.9 percent in 1992, respectively (Lin and Schramm, 2003). The statutory tariff rates were reduced significantly since the 1980s (Table 2.2), which promoted technological transfer in China by facilitating importing advanced machinery and equipment. More importantly, an open economy environment was created by the tariff reduction, which is critical for nurturing the competitiveness of domestic firms.
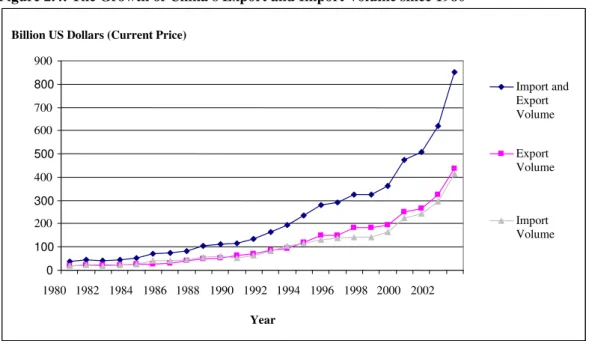
To attract foreign investors to manufacture in China, Chinese government provided foreign exchange on favorable terms, tax concessions and easy access to domestic raw materials to the firms engaging in the business of assembling imported parts and components and re-exporting final products. Laws and regulations with regard to foreign investment were formulated to protect foreign investors’ assets, profit and legitimate rights. These measures promoted rapid expansion of export processing business in China. After China entered WTO in 2001, China has been further integrated into global production networks of multinational corporations, indicated by the export and import volume surge after 2001 (Figure 2.4). Many producers in high income economies, particularly in East Asia, such as Japan, South Korea and Taiwan, outsourced their manufacturing business or transferred their production departments to China in order to retain market share in the keen global competition. According to China’s Ministry of Commerce’s report, the share of processing trade export accounted for 55 percent of China’s total export in 2004 (Xinhua Net, 2004).
Figure 2.3: Inward Foreign Direct Investment in China 0 10 20 30 40 50 60 70 1984 1986 1988 1990 1992 1994 1996 1998 2000 2002 2004
Actually-used Foreign Direct Investment (Billion US$)
Source: Various issues of China Statistical Yearbook.
Table 2.2: Average Statutory Import Tariff Rate and Chinese Domestic Companies Authorized to Conduct Foreign Trade: 1978-2001
Year Average Statutory Import Tariff Rate
Chinese Domestic Companies Authorized to Conduct Foreign
Trade 1978 N.A. 12 1982 55.6 N.A. 1985 43.3 800 1986 N.A. 1200 1988 43.7 5000 1991 44.1 N.A. 1992 43.2 N.A. 1993 39.9 N.A. 1994 35.9 N.A. 1996 23.0 12000 1997 17.0 15000 1998 N.A. 23000 1999 N.A. 29258 2000 16.4 31000 2001 15.3 35000 Source: Lardy (2002).
Figure 2.4: The Growth of China’s Export and Import Volume since 1980
Source: Various issues of China Statistical Yearbook.
To sum up, the gradual transformation of the Chinese economy in the past two decades started from the rural area and then expanded to the industry sector. The reform overhauled the economic institutions at micro- and macro-level. Market oriented economic system has been established to govern the country’s economy, though lasting effort is still needed to transform the remaining planned institution and improve the efficiency of the current system. The reform and transformation significantly enhanced the productivity of the firms in the country and strengthened their competitiveness in the global market. They constitute the backdrops of the issues that we study and analyze in the following chapters.
0 100 200 300 400 500 600 700 800 900 1980 1982 1984 1986 1988 1990 1992 1994 1996 1998 2000 2002 Year Billion US Dollars (Current Price)
Import and Export Volume Export Volume Import Volume
Chapter 3 Organization, Program, and Structure: An
Analysis of the Chinese Innovation Policy Framework
1In this chapter, innovation policy is defined as a set of policy actions aiming to raise the quantity and efficiency of innovative activities. “Innovative activities” refers to the creation, adaptation and adoption of new or improved products, processes, or services (European Commission, 2000). Highlighted in the “National Innovation System” theory (Freeman, 1987; Lundvall, 1992; Nelson, 1993; Edquist, 1997), a country’s innovation performance is largely determined by the policy which fosters creation, transfer and absorption of technology, knowledge and skills in industry and S&T organizations. It also depends on the policy influencing the interplay between these two sectors. The innovation policy can be developed and implemented at the local, regional, and national levels. The Chinese innovation policies, which are addressed in this chapter, are mainly established and executed by the Chinese central government at the national level.
3.1 The Governance Models of Innovation Policy Matters in China and OECD Countries
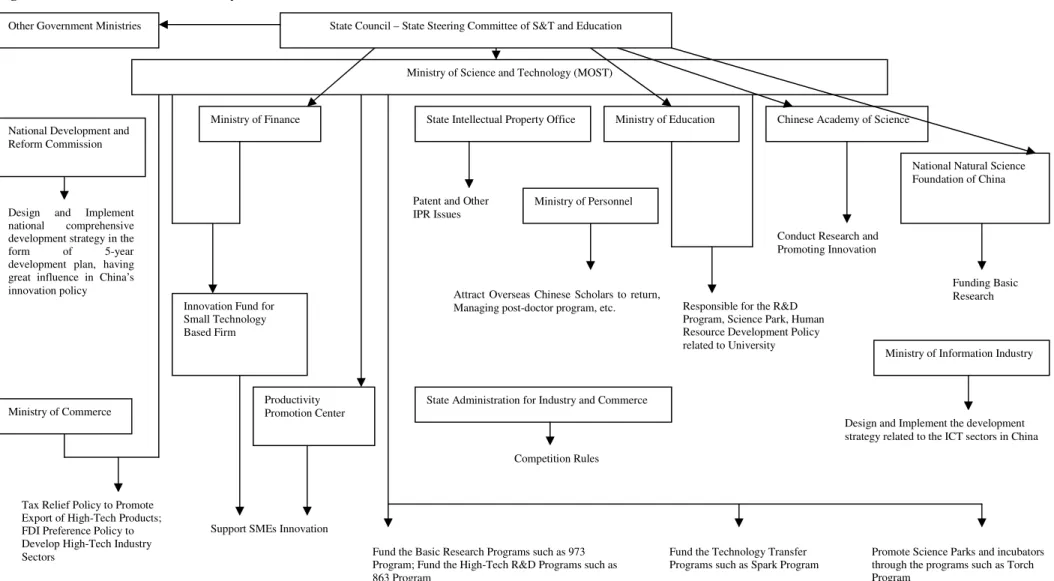
After 1978, the basic principles of market-oriented economy were introduced into China’s S&T policy reform. China’s S&T and innovation system experienced a series of multi-level administration reforms in combination with shifts in administrative power between different government bodies and agencies (US Embassy Beijing, 2002; OECD, 2002; Sociedade Portuguesa de Inovacao, 2002). The main executive stakeholders with regard to the Chinese innovation policy framework are shown in Figure 3.1.
Figure 3.1: Chinese Innovation Policy Institutions
Ministry of Education
Ministry of Personnel Patent and Other
IPR Issues
Chinese Academy of Science Ministry of Science and Technology (MOST)
Ministry of Commerce
Ministry of Finance
Innovation Fund for Small Technology Based Firm
Fund the Basic Research Programs such as 973 Program; Fund the High-Tech R&D Programs such as 863 Program
State Intellectual Property Office
Productivity Promotion Center
Conduct Research and Promoting Innovation
Support SMEs Innovation
Responsible for the R&D Program, Science Park, Human Resource Development Policy related to University
Tax Relief Policy to Promote Export of High-Tech Products; FDI Preference Policy to Develop High-Tech Industry Sectors
State Council – State Steering Committee of S&T and Education
Fund the Technology Transfer Programs such as Spark Program Other Government Ministries
Promote Science Parks and incubators through the programs such as Torch Program
Attract Overseas Chinese Scholars to return, Managing post-doctor program, etc.
State Administration for Industry and Commerce
Competition Rules
National Natural Science Foundation of China
Funding Basic Research National Development and
Reform Commission
Design and Implement national comprehensive development strategy in the
form of 5-year
development plan, having great influence in China’s innovation policy
Ministry of Information Industry
Design and Implement the development strategy related to the ICT sectors in China
In the Chinese innovation system, there exists a coordination mechanism in the State Council, called the State (National) Steering Committee of S&T and Education (Guo
Wu Yuan Ke Ji Jiao Yu Ling Dao Xiao Zu), founded in 1998, which is the highest
ranked innovation policy coordination body in China. The State Council Premier plays a role of coordinator for national strategy of S&T and education. From June 2003, the group had been leading in designing and developing an outline document “2006-2020 Chinese National Science and Technology Development Strategy”, which was announced finally in March 2006. Compared with the Chinese structure, the co-ordination structure at ministerial level with the similar task can be found in the OECD countries, for example in Finland. The Finish Science & Technology Council, chaired by the Prime Minister is composed of seven Ministers and ten representative organizations (European Commission, 2001a).
In 1998 the State Science and Technology Commission changed its name to the Ministry of Science and Technology (MOST) and became a principal propeller in China’s technological endeavors. Now, MOST is regarded in China as having a high competence with regard to the design and implementation of innovation policy. Through its executive body, it implements several programs to fund basic and applied R&D, serve enterprises, especially SMEs to innovate, manage and promote the science parks and incubators throughout China and develop human resources in the S&T field.
Models of governance differ among the OECD countries. In some countries, there is no separation between the government departments that design policy and those that implement measures. For instance, in the UK, the Department of Trade and Industry is at the center of innovation governance system. It designs science policy and also “operates and/or funds a number of schemes for the promotion of innovation in companies” (European Commission, 2002a), which is very similar to China’s governance system. Differently, in countries like Ireland, policy is framed by ministries but delivered by semi-autonomous agencies. There is a distinction between the responsibilities of the Department of Enterprise, Trade and Employment and Enterprise Ireland, which is the implementing agency (European Commission, 2002b). In Austria, Belgium, Germany, Spain, the countries with federal structure, innovation policy
framework is more complex with the interaction of federal and local governments (European Commission, 2002c).
The Chinese Academy of Science is another important stakeholder in the Chinese innovation policy framework. It has been an essential part of China’s S&T system in the planned economy, founded in 1949 by following the Soviet Union’s model. After the years’ reform and restructuring, by the end of 2002 it still had a huge size, composed of 112 institutes, including 84 scientific research institutes, one university, one graduate school and 4 documentation and information centers and two media and publishing organizations (Chinese Academy of Science, 2002a). Distributed over various parts of the country, the Chinese Academy of Science had a total staff of over 45,600 of whom 67.2 percent are scientific personnel (Chinese Academy of Science, 2002b). The statistical data show that the Chinese Academy of Science is the major beneficiary of China’s governmental S&T funding. In 2002 it received 20 percent of total funding of National Nature Foundation of China and conducted 12 of a total of 26 projects of Program 973; in 2001 and 2002, it received 14.1 percent of total funding of Program 863 (Chinese Academy of Science, 2002c). (The S&T programs in China are discussed in section 3.2.2)
3.2 The Policy Actions Implemented in China for Promoting Innovation
Through the “National Innovation System” approach, some scholars endeavored to create a theoretical scheme to compare the different national innovation systems in the diversified social and economic context (Nelson, 1993; Edquist, 1997; Liu and White, 2000; Shyu et al., 2001; Chang and Shih, 2004). However, the collected literature has not provided a comparative framework for describing the Chinese innovation policies in transition, which miss some typical policy components of the systems in the established market economies, but at the same time possesses the others inherited from planned economy. Particularly, the literature does not provide insight into the question such as in which area the Chinese policy has been catching up with international advanced level and in which area it is still weak. Therefore, we propose an analytical scheme for China’s innovation policy framework and examine each policy category respectively (Figure 3.2).
Human Resources Policy
• Education Development Policy for Basic Education
• “211 Project” for Higher Education • Human Resource Programs of Ministry of Education
Legislative Actions
• IPR and Competition Legislation • S&T Legislation
• Education Legislation
Financial Policy
• Current S&T Programs (Grants, Loans, Interest Subsidiary, etc.) • Tax Preference Policy related to FDI • Venture Capital and Stock Market
Business Innovation Support Structure • Science Park and Incubators • China High-Tech Fair
• Productivity Promotion Centers
Reform in the Public S&T Institutions Figure 3.2: Chinese Innovation Policy Framework
3.2.1 Reform of the Public S&T Institutions
Similarly to the transformation taking place in China, the reform of public S&T systems also occurred in the post-socialist central and eastern European countries (Dyker and Radosevic, 1999). To transform the R&D system highly detached from industry and to strengthen the industrial innovation capability are the tasks that these countries needed to accomplish in the transformation. Gokhberg (1999) summarizes the policy chosen by the central and eastern European countries during the transitional period such as increasing government’s funding for R&D, maintaining and developing the basic research and improving the collaboration between S&T institutions, universities and
The similar policy measures were also implemented in China. Gu (1995) discusses intensively the policy reform of the S&T System in China by dividing the evolution of the reform policy into several phases. Suttmeier and Cao (1999), Liu and White (2001), Liu and Jiang (2001) and Cao (2002) extend the observation of policy initiative to cover the period after 1995. However, the analysis on the newest round reform since 1999, called “the transformation of the R&D institutes”, has not been analyzed intensively in the published literature. In Table 3.1 and 3.2, we synthesize the above works and the result of the survey done by MOST in 2002 May on the 290 newly transformed R&D institutions, depicting a preliminary picture of China’s latest reform of public S&T institutions after 1999.
3.2.2 Financial Policy
Starting in the 1980s, China’s government intensively utilized a series of programs with different objectives to fund S&T activities. The initial time, priorities and characteristics of these programs are discussed in Table 3.3. The growing budgets of these programs demonstrate that China’s government was persistently committed to the financial support to S&T and R&D activities (Table 3.4). Furthermore, the central government set up its strategy of attracting the financial input from local governments and enterprises to co-fund the S&T program. A typical case is Spark Program. The funding of Spark Program was mainly from the bank loan and the own capital of enterprises. Since 1990 the government appropriation for this program had hardly surpassed 5 percent. In 2004, the 863 Program, Key Technology R&D Program and 973 Program emerged as the biggest three funding programs led by MOST, accounting for 72 percent of the R&D funding managed by MOST.2
2
National Natural Science Foundation of China is independent from MOST and reports directly to State Council.
Table 3.1: Chinese Reform Policy for Public S&T Institutions: 1978-2004
Period Objectives of Policy Actions Policy Actions
Reformation of Planning Practice (1978-1984)
Recover and develop the R&D system and integrate it into the planned economic practices.
• Rehabilitation and improvement of R&D institutions in the post-Culture Revolution (1966-1976) period;
• Integration of R&D activities into the 6th National Five-Year Plan (1980-1985).
Performing S&T activities in the “Market”
(1985-1991)
Establish the horizontal cooperation between S&T sector and enterprises.
• Replace the planned S&T funding mechanism with the merit-based project competition mechanism;
• Reduce fiscal appropriation to R&D institution to force them to cooperate with industry;
• Create a “Technology Market” to legitimize transactions of technology transfer and set up the agencies to promote technology transfer;
• Enhance the autonomy of R&D institutions and mobility of the S&T Personnel;
• Attempt to merge the R&D institutions into enterprises; • Support the spin-off enterprises.
Integrating S&T activities into “ Socialist Market Economy”
(1992-1998)
Run non-basic research R&D institutions as run enterprises.
• Endow the R&D institutions the comprehensive economic autonomy as the same hold by enterprises;
• Encourage spin-off activities through developing science parks and incubators;
• merge the R&D institutions into enterprises.
Large Scale Transformation of R&D institutions
(1999 till now)
Transform nearly all of the government-owned R&D institutions.
• Transform the R&D institutions into enterprises, non-profit organizations, intermediary organizations or merge them into universities.