UNIVERSIDADE DO ALGARVE
INSTITUTO SUPERIOR DE ENGENHARIA
F
AULT
D
ETECTION
S
YSTEM FOR
I
NTERNAL
C
OMBUSTION
ENGINES
SISTEMA DE DETEÇÃO DAS FALHAS PARA MOTORES DE COMBUSTÃO INTERNA
Sergey Nogin
Dissertação para a obtenção do grau de Mestre em Engenharia Eléctrica e Electrónica
Especialização em Tecnologias de Informação e Telecomunicações
Orientador: Professor Doutor Jânio Miguel E. Ferreira Monteiro Orientador: Professor Doutor Jorge Filipe Leal Costa Semião
Title: Fault detection system for internal combustion engines
Título: Sistema de Deteção das Falhas para motores de Combustão Interna
Authorship: Sergey Nogin Autor: Sergey Nogin
I hereby declare to be the author of this original and unique work. Authors and references in use are properly cited in the text and are all listed in the reference section.
Declaro ser o autor deste trabalho, que é original e inédito. Autores e trabalhos consultados estão devidamente citados no texto e constam da listagem de referências incluída.
_________________________________ Sergey Nogin
Copyright © 2017. All rights reserved to Sergey Nogin. The university of Algarve owns the perpetual, without geographical boundaries, right to archive and publicize this work through printed copies reproduced on paper or digital form, or by any other media currently known or hereafter invented, to promote it through scientific repositories and admit its copy and distribution for educational and research, non-commercial, purposes, as long as credit is given to the author and publisher.
Copyright © 2017. Todos os direitos reservados em nome de Sergey Nogin. A Universidade do Algarve tem o direito, perpétuo e sem limites geográficos, de arquivar e publicitar este trabalho através de exemplares impressos reproduzidos em papel ou de forma digital, ou por qualquer outro meio conhecido ou que venha a ser inventado, de o divulgar através de repositórios científicos e de admitir a sua cópia e distribuição com objetivos educacionais ou de investigação, não comerciais, desde que seja dado crédito ao autor e editor.
ACKNOWLEDGMENTS
I would like to thank my thesis advisors, Prof. Jânio Monteiro and Jorge Semião for all support provided during the elaboration of this dissertation and study process.
I would like to thank Mauro Bomtempo, Prof. Nelson Sousa and Henrique Catarino for the help in conducting practical experiments.
R
ESUMOO desenvolvimento de dispositivos para Internet das Coisas abre novas oportunidades na área de manutenção preditiva. A ideia geral da Internet das Coisas é ligar tudo à Internet, permitindo criar assim sistemas escaláveis suportados pelo processamento remoto, centralizado ou decentralizado. Com a utilização de módulos de baixa potência e de baixo custo, esses sistemas são também eficazes em termos de custo.
Alguns estudos indicam que nos próximos anos a manutenção preditiva das máquinas será a principal aplicação da análise de dados na indústria, baseada em Internet das Coisas. Apesar de existirem vários tipos de máquinas, as mais importantes são os motores elétricos e os de combustão interna. Os motores elétricos são amplamente utilizados em diversos setores. Já os motores de combustão interna, por sua vez, são principalmente utilizados nas indústrias automóvel e marítima.
Tipicamente, os motores modernos de combustão interna têm uma unidade de controlo computadorizado com capacidade de autodiagnóstico. Contudo, ao contrario da indústria automóvel que utiliza o sistema de On-board diagnostics, a indústria marítima não possui uma norma definida, ou pelo menos uma norma dominante. Isso acarreta a utilização de equipamentos de preço elevado para extrair informação sobre o estado do motor da unidade de controlo. Além disso, a monitorização é intermitente, obrigando ao proprietário de uma embarcação a efetuar a extração dos dados periodicamente para posterior análise.
A monitorização das características de operação de um motor um processo fundamental numa manutenção preditiva, sendo que, pela monitorização de um ou mais parâmetros de uma máquina (incluindo a vibração, temperatura, etc.), tenta identificar uma mudança significativa na mesma, que, por sua vez, possa indicar o aparecimento de uma falha. A estratégia de monitorização preditiva assegura que as atividades de manutenção são executadas apenas quando são realmente necessárias, mas para tal é necessário monitorizar periodicamente ou constantemente o equipamento, processar os dados e analisar os resultados. Este método tem, no entanto, as suas desvantagens. O custo do equipamento portátil de monitorização, ou de um sistema estacionário que esteja permanentemente instalado, depende do tipo de variáveis monitorizadas, da precisão de medida, do ambiente de trabalho, ou até do nível de desenvolvimento do sistema. Para além disso, o defeito pode não ser detetado, ou então ser detetado um defeito não existente (um falso positivo, ou uma falsa detecção).
Para efectuar uma monitorização preditiva, podem ser utilizados um ou mais métodos de monitorização. Os métodos principais são: análise de vibração, análise de óleo, análise de desempenho, termografia, ferrografia ou análise dos sinais acústicos. De entre todos, a análise de vibração é particularmente interessante, por ser um método não intrusivo e por permitir não só detetar as falhas, mas também classificá-las. Para monitorizar as vibrações de uma máquina utilizam-se transdutores de deslocamento, de velocidade ou de aceleração (acelerómetros). Os transdutores de deslocamento utilizados na indústria permitem medir apenas o deslocamento relativo, o que nem sempre é conveniente. Os preços dos transdutores industriais de velocidade são relativamente altos. Os acelerómetros piezoelétricos industrias também têm um preço elevado. Se as condições ambientais não forem exageradas (por exemplo, temperaturas elevadas) podem ser utilizados acelerómetros MEMS (Microelectromechanical system). Os acelerómetros do tipo MEMS não têm a resposta em frequência tão ampla como os piezoelétricos, no entanto a diferença de preço em relação às restantes opções é muito significativa, e os acelerómetros MEMS, hoje em dia, são praticamente todos digitais, o que simplifica o sistema. Outra alternativa é a película piezoelétrica feita a partir de polyvinylidene
difluoride (PVDF). A resposta em frequência desta pelicula é por vezes melhor do que a dos
acelerómetros piezoelétricos, com frequências de ressonância acima de 10 MHz. O preço de uma película PVDF depende das dimensões da película, mas é normalmente maior do que o preço de um acelerómetro MEMS, sendo ainda assim muito menor do que um acelerómetro piezoelétrico. É importante referir que há modelos de acelerômetros piezoelétricos que incluem amplificador, mas no caso da película PVDF requerem um circuito de condicionamento do sinal. Para além disso, no caso da película PVDF, tem que ser considerada a sensibilidade à interferência eletromagnética.
Dado este contexto, o trabalho realizado nesta Tese resulta de uma proposta feita por uma empresa interessada em automatizar este processo, que entrou em contato com universidade para encontrar uma possível solução. O sistema desenvolvido baseia-se no conceito Internet das Coisas, efetuando a monitorização autónoma da condição do motor, de forma independente do sistema de autodiagnóstico que possa existir.
Este trabalho tem, genericamente, três objetivos: (i) desenvolver um módulo de contabilização do número de horas de funcionamento do motor; (ii) desenvolver um módulo de monitorização de ocorrência de falhas num motor de combustão interna através da medição e análise de vibrações; (iii) investigar e analisar os resultados de monitorização, para identificar desvios de parâmetros de funcionamento e detetar de forma preditiva a ocorrência de falhas (antes que as mesmas ocorram realmente).
O sistema, que compreende os módulos (i) e (ii), será montado no motor, comunicando com um dispositivo do cliente (por exemplo, um smartphone ou tablet) através de uma interface sem fios. Neste caso optou-se por utilizar uma ligação sem fios baseada na tecnologia
Bluetooth Low Energy.
Para implementação do módulo de contabilização do número de horas de funcionamento, recorreu-se a um sensor do tipo MEMS, por ter um consumo muito baixo. Já o módulo de módulo de monitorização de ocorrência de falhas recorre a um sensor do tipo PVDF, por permitir elevadas definições temporais na captura do sinal de vibração.
Para efectuar a análise de dados que permite a identificação da ocorrência de falhas, foram testados e comparados um conjunto de 16 algoritmos de análise conjunta de dados no tempo e na frequência, suportando a identificação de falhas e a diferenciação entre tipos de falhas. Os algoritmos foram avaliados com base em dados reais, obtidos por falhas induzidas num motor de combustão interna, permitindo por essa via encontrar os algoritmos que melhor servem o objetivo proposto.
PALAVRAS-CHAVE:Internet das Coisas, Deteção de Faltas, Motores de Combustão Interna, Análise Tempo-Frequência.
A
BSTRACTThe purpose of this work is to develop a non-intrusive low-cost system capable of detecting faults and register working hours of Internal Combustion (IC) engines. The system should allow the monitoring of combustion engines usage, detect faults remotely, and is focused on IC engines for maritime applications. As explained in the following it consists of two parts. The first part involves the development of the device, which should be capable of performing a continuous monitoring of an engine’s activity and register its working periods. This decision is made based on the vibration analysis. As a requirement, the developed device must be low-cost, portable and have a low energy consumption to provide at least two years of autonomy. The second part involves fault’s detection and, like the first part, it requires information from the engine’s vibrations. A low power accelerometer will be used to monitor the engine’s activity, and a piezoelectric polyvinylidene fluoride film is used to record the engine’s vibration, for fault detection. The data is then sent via Bluetooth to the user’s smartphone, which forwards it to the Internet, for further analysis. Bluetooth Low Energy is used to support the required autonomy. The developed technique for fault detection includes data acquisition, analog and digital pre-processing, and digital processing. The most important part of the digital processing, in this case, is a Time-Frequency Analysis. Several Time-Frequency Analysis algorithms were tested with real data to select the best solution to detect faults in such engines.
KEYWORDS: Internet of Things, Fault detection, internal combustion engine, time-frequency analysis.
T
ABLE OF CONTENTS 1. Introduction ... 1 1.1 Motivation ... 2 1.2 Objectives ... 3 1.3 Dissertation overview ... 3 2. State of Art ... 5 2.1 Hour meter ... 52.2 Fault detection in IC engines ... 7
2.2.1 Monitoring method ... 7
2.2.2 Vibration sensing ... 8
2.2.3 Signal processing ... 8
2.3 Communication solutions ... 15
3. Non-Intrusive Monitoring System ... 17
3.1 Proposed System Architecture ... 17
3.2 Sensors and components selection for the IoT Device... 19
3.2.1 Key characteristics ... 19
3.2.2 Architecture of the IoT device ... 21
3.2.3 MEMS accelerometer ... 22
3.2.4 PVDF film ... 23
3.2.5 RTC ... 24
3.2.6 Non-volatile memory ... 25
3.2.7 BLE MCU module ... 27
4. Prototyping ... 31
4.1 Hour meter prototype ... 32
4.1.2 Firmware ...33
4.2 Prototype of the condition monitoring block ...36
5. Fault detection Trough Vibration Analysis ...45
5.1 Test Set-Up for Fault-Detection Analysis ...45
5.2 Data Analysis and Methods for Fault Detection ...50
5.2.1 Time domain...51
5.2.2 Frequency domain ...52
5.2.3 Time-Frequency Methods’ comparison ...54
6. Conclusions and Future Work ...63
6.1 Conclusions...63
6.2 Future work ...64
6.3 Publications made during the Thesis ...65
L
IST OFF
IGURESFig. 1. Hour meter with vibration based working principle. ... 6
Fig. 2: Mechanic’s stethoscope. ... 7
Fig. 3. Mother wavelets. ... 10
Fig. 4. System architecture ... 17
Fig. 5. Device architecture. ... 21
Fig. 6. Modified system architecture. ... 22
Fig. 7. PDVF film sensor frequency response, obtained from [58] ... 24
Fig. 8. PVDF film sensors: version without leads on the left and shielded version with coaxial cable on the right. ... 24
Fig. 9. CYBLE-212019-00 module. ... 30
Fig. 10. Device schematic. ... 31
Fig. 11. Layout of the hour meter prototype. ... 32
Fig. 12. Service structure. ... 33
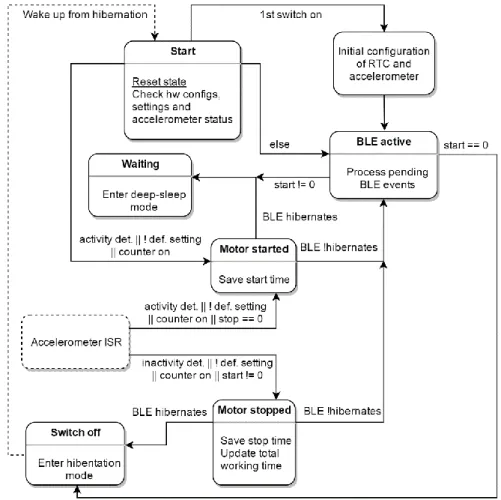
Fig. 13. Software states and logic. ... 34
Fig. 14. Buffer stage of the conditioning circuit. ... 37
Fig. 15. AC transfer characteristic of the buffer stage. ... 38
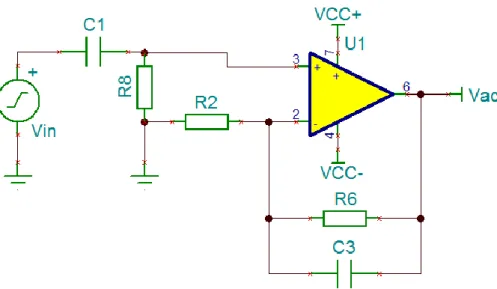
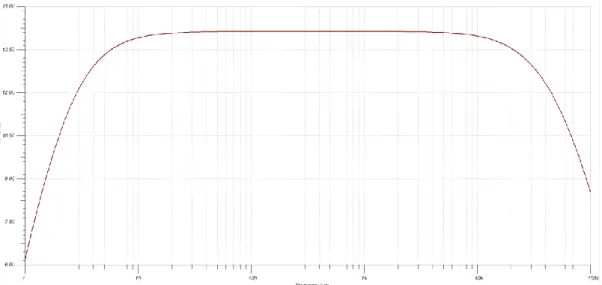
Fig. 16. Amplification stage of the conditioning circuit. ... 38
Fig. 17. AC transfer characteristic of the amplification stage. ... 38
Fig. 18. DC sweep stage of the conditioning circuit. ... 39
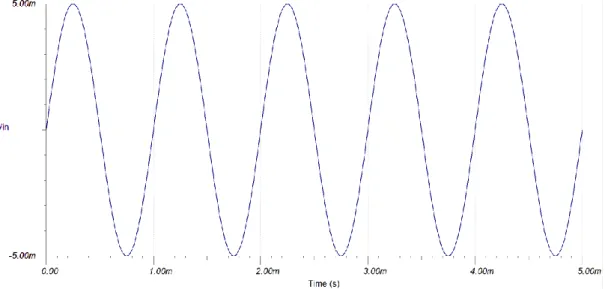
Fig. 19. Transient analysis. ... 40
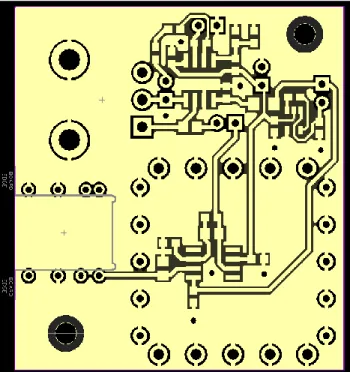
Fig. 20. Layout of the prototype PCB for the condition monitoring block... 41
Fig. 21. Prototype board with the sensor (on the left)... 42
Fig. 22. Sensitivity test: heart rate sensing. ... 43
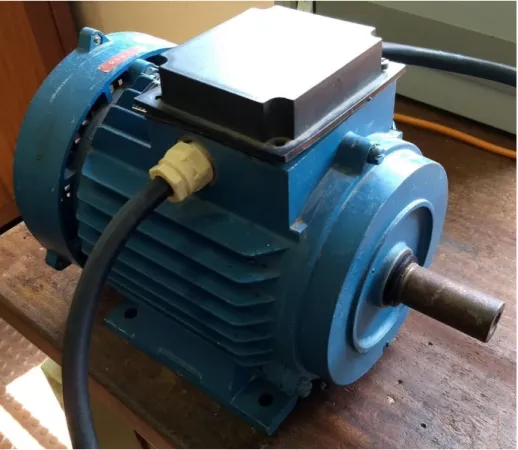
Fig. 23. Three-phase AC motor. ... 43
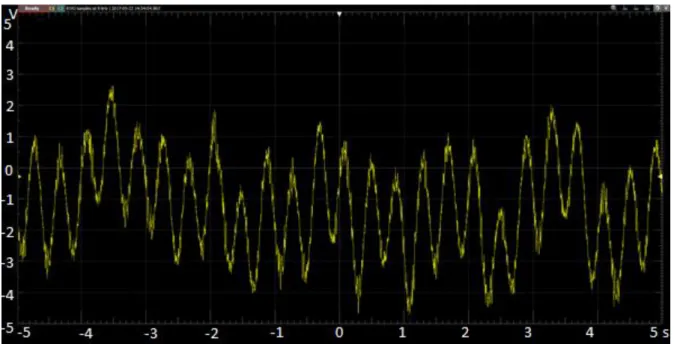
Fig. 24. Sensitivity test: AC motor’s vibration sensing (time domain). ... 44
Fig. 25. Sensitivity test: AC motor’s vibration sensing (frequency domain). ... 44
Fig. 26. Sensor mounting. ... 46
Fig. 27. Spectrum of the signal for 800 RPM. ... 47
Fig. 29. Spectrum of the signal for 2000 RPM. ...48
Fig. 30. Spectrum of the signal for 3500 RPM. ...49
Fig. 31. Enlarged portion of the spectrogram. ...49
Fig. 32. The spectrum of the captured vibration signal. ...50
Fig. 33. Normal condition, time domain. ...51
Fig. 34. Lack of spark in the first cylinder, time domain. ...51
Fig. 35. Blocked injector in the first cylinder, time domain. ...52
Fig. 36. Normal condition, frequency domain. ...53
Fig. 37. Lack of spark in the first cylinder, time domain. ...53
Fig. 38. Blocked injector in the first cylinder, time domain. ...54
Fig. 39. Rényi entropy for normal condition and Sp1 fault calculated by each of the methods. ...56
Fig. 40. Rényi entropy for normal condition and Sp4 fault calculated by each of the methods. ...57
Fig. 41. Rényi entropy for normal condition and Inj1 fault calculated by each of the methods. ...57
Fig. 42. Rényi entropy for normal condition and Inj4 fault calculated by each of the methods. ...57
Fig. 43. Morlet scalogram: normal condition (left side), blocked fuel injector in the fourth cylinder (right side). ...58
Fig. 44. WVD: normal condition (left side), blocked fuel injector in the fourth cylinder (right side). ...59
Fig. 45. SP: normal condition (left side), blocked fuel injector in the fourth cylinder (right side). ...59
Fig. 46. SPWV: normal condition (left side), blocked fuel injector in the fourth cylinder (right side). ...60
Fig. 47. ZAM: normal condition (left side), blocked fuel injector in the fourth cylinder (right side). ...60
Fig. 48. MHS: normal condition (left side), blocked fuel injector in the fourth cylinder (right side). ...61
Fig. 49. BJ: normal condition (left side), blocked fuel injector in the fourth cylinder (right side). ...61
Fig. 50. BUD: normal condition (left side), blocked fuel injector in the fourth cylinder (right side). ...62
Fig. 51. CW: normal condition (left side), blocked fuel injector in the fourth cylinder (right side)... 62
L
IST OFT
ABLESTab. 1. CC2650STK characteristics. ... 20
Tab. 2. Characteristics of chosen MEMS accelerometers. ... 23
Tab. 3. Non-volatile memory components comparison. ... 26
Tab. 4. BLE MCU modules comparison. ... 28
Tab. 5. Characteristics of the selected op-amp. ... 41
A
CRONYMSIoT Internet of Things ECU Engine Control Unit OBD On-board diagnostics
IC Internal Combustion
PVDF Polyvinylidene fluoride BLE Bluetooth Low Energy
API Application Programming Interface
M2M Machine-to-Machine Communication
HMI Human-Machine Interface
TFA Time-Frequency Analysis
MEMS Microelectromechanical system
EMI Electromagnetic Interference FFT Fast Fourier Transform
TF Time-frequency
ARMA Auto-Regressive Moving Average STFT Short-time Fourier transform CWT Continuous Wavelet Transform DWT Discrete Wavelet Transform
WV Wigner-Ville
WVD Wigner-Ville distribution
PWVD Pseudo-WVD
SPWVD Smoothed-pseudo WVD
ZAMD Zhao-Atlas-Marks distribution
IrDA Infrared Data Association
NFC Near-field communication
EDR Enhanced Data Rate
LE Low Energy
COAP Constrained Application Protocol
MQTT Message Queuing Telemetry Transport
HTTP Hypertext Transfer Protocol
TI Texas Instruments
MCU Microcontroller unit
RF Radio Frequency
EEPROM Erasable Programmable Read-Only Memory
NVRAM Non-Volatile Random-Access Memory F-Ram Ferroelectric Random-Access Memory
RTC Real-Time Clock
ODR Output data rate
I2C Inter-Integrated Circuit SPI Serial Peripheral Interface
MRAM Magnetoresistive random access memory IDE Integrated Development Environment
PMU Power Management Unit
PPI Programmable peripheral interconnect
SDK Software development kit
GUI Graphical user interface
ISR Interrupt Service Routine
JFET Junction gate field-effect transistor
Op-amp Operational amplifier
PCB Printed Circuit Board
1. I
NTRODUCTIONConsidering the typical maintenance strategies for a machine, there are four options to consider: (1) run to failure, (2) preventive maintenance, (3) predictive maintenance, and (4) proactive maintenance. In the case of the first strategy (i.e. run to failure), the engine runs until there is a fault. The repair is done or the damaged components are replaced when a complete stop of the engine occurs (or just before). The advantage is that the engine components run to the end of their life cycle, and the engine is withdrawn from service only when repair is really necessary. However, the disadvantage of this strategy is that it may likely cause significant damage to the engine. In addition, the process of buying and/or replacing the component that caused the breakdown can take a significant amount of time and, during this time, the engine will not be working [1][2].
In the case of a preventive maintenance strategy, the management or replacement of the engine elements is performed periodically using the recommendations of the engine manufacturers. The advantage of this method is that it typically avoids significant damage to the machine. The disadvantage is that the period between maintenance activities results from a typical average value and it may happen that, in some cases, maintenance can be done later, lowering costs, while in other cases, it should be done earlier [1].
The predictive maintenance strategy solves these previous problems because maintenance activities are performed only when they are really needed. In this case, it is necessary to periodically or constantly monitor the equipment, process the data and analyze the results. This method has, however, disadvantages. The cost of the portable monitoring equipment or a stationary monitoring system depends on the type of monitored variables, accuracy, working environment and system’s development state. In addition, the defect may not be detected, or a non-existent defect may be detected. System adjustments and monitoring can be carried out by qualified technicians [2].
The proactive maintenance strategy, involves both preventive and predictive strategies, along with a mechanism that attempts to detect the source of failure. Typically, it uses a stationary system that monitors several parameters. In addition to detecting the fault, it ensures that the repair was appropriate and advises the user in case of needing to modify or change the
INTRODUCTION
equipment. The advantages and disadvantages are generally the same: thorough monitoring of the equipment. This strategy minimizes failures and increases machine reliability. However, this is a high complex monitoring system, and it requires high qualification technicians to handle the specific monitoring equipment [2].
Choosing the appropriate maintenance strategy to use is done by analyzing the criticality of the system and also the economic factors [2]. Nowadays, run to failure and preventive strategies are becoming obsolete, while the predictive strategy is starting to be widely used. Regarding the proactive maintenance strategies, although very promising for the future, they have still a long way to go in order to be widely adopted.
In the case of predictive or proactive strategies, one or more monitoring methods may be used. The main methods are vibration analysis, oil analysis, performance analysis, thermography, ferrography or acoustic signal analysis [3]. From these methods, vibration analysis is particularly interesting, because it is a non-intrusive method and because it allows not only to detect the faults but also to classify them [4].
1.1 M
OTIVATIONAs stated in [1], Condition Monitoring is a major component of a predictive maintenance process that, by monitoring a parameter of machinery (including vibration, temperature, etc.), tries to identify a significant change, which is indicative of a developing fault.
The development of the Internet of Things (IoT) devices and concept opens up new opportunities in the field of such predictive maintenance. The idea of IoT is to connect everything to the Internet, and it allows the creation of scalable systems, supported by a centralized or distributed data processing. Due to the use of low-power and low-cost modules these systems are also cost effective.
According to [5], in the next few years, the predictive maintenance of machinery will be the main application of Industrial Analytics based on IoT. Machinery involves various kinds of machines, however, due to their prevalence, the most important machines are electrical motors and Internal Combustion (IC) engines. Electrical motors are broadly used in many different sectors. IC engines are extensively employed in the automotive and marine industry.
Modern marine IC engines have a computerized engine control unit (ECU) which generally has a self-diagnostic capability. However, different from the On-board diagnostics (OBD) of
INTRODUCTION
the automotive industry, in marine systems, there is no dominant standard, and expensive equipment is required to retrieve the information about the engine’s condition from the ECU. Also, the monitoring is intermittent, with the boat’s owner needing to make periodic data retrieval and analysis.
Given this context, the work done in this Thesis results from a proposal made by a company that is interested in automating this process, which has contacted the university to find a possible solution. The developed system uses the IoT approach for autonomous monitoring of the engine’s condition without using the self-diagnostic mechanism of the ECU.
1.2 O
BJECTIVESThe purpose of this work is to develop a non-intrusive low-cost system capable of detecting faults and register working hours of IC engines. The main objectives state that the system should allow the monitoring of combustion motors usage, detect faults remotely, and is focused on IC engines for maritime applications. Therefore, this work consists of two parts, as explained in the following. The first part involves the development of the device, which should be capable of performing a continuous monitoring of an engine’s activity and register its working periods. This monitoring is made based on the analysis of vibration. The second part involves faults’ detection and, like the first part, requires information from the engine’s vibrations. As additional objectives, the developed device must be low-cost, portable and have a low energy consumption to provide at least two years of autonomy.
1.3 D
ISSERTATION OVERVIEWThe dissertation is divided into six chapters. This chapter is dedicated to introduce the problem, describe the objectives and motivation of the work, as well as the structure of the dissertation.
In the following chapter, the state of the art concerning the working principle of hour meters, faults detection in IC engines and the options for wireless connectivity of IoT devices is presented.
INTRODUCTION
The third chapter describes the selection process of components and sensors. It begins with the description of the system architecture and the architecture of the device used for the engine monitoring. Then, the main components are selected for each block of the described architecture.
In chapter four, the prototypes of the hour meter and the condition monitoring units are described. It starts by describing the schematic which is based on a modified system architecture, and previously selected components. It then describes the hour meter prototype. After describing the hardware part, the logic of the device firmware is explained. It begins with the description of the Bluetooth Low Energy (BLE) service designed to provide the interface with the hour meter block. Two types of calibration required for the normal operation of this block are explained next. Then the firmware algorithm is described. The consumption is evaluated in the end.
Chapter five begins with the description of the data acquisition system. In the following, the variation of vibration signal according with the rotational speed of the crankshaft is studied. Experimental conditions are described next, together with the description of the faults caused by the IC engine and used to evaluate the performance of different Time Frequency (TF) methods. In the next sub-chapter the results of the tests are presented, and the performance of the TF methods are compared based on the variation of Rényi information for different conditions.
2. S
TATE OFA
RTIn order to perform a continuous condition monitoring of engines, maintenance procedures need to be combined with communication technologies.
Maintenance procedures can either be classified in preventive or predictive methods. In terms of preventive procedures, they depend on the equipment’s usage, which therefore needs to be measured. This approach, however, cannot assure unexpected failures, which may happen between preventing interventions. Predictive strategies, on the other hand, are based on regular condition monitoring and thus allow the detection of faults on their early stages [6], avoiding breakdown.
In the following, the description of some of the work done in both strategies is provided. It starts by describing the working principle for different types of hour meters, needed in preventive strategies. Afterward the state-of-the-art in fault detection for internal combustion engines is described. The implemented device can be used in predictive strategies. Finally, in the last subchapter, the communication solutions that can be used to transmit these data to an Internet based server are described.
2.1 H
OUR METERAn hour meter is a device used to count the running time. Maintenance procedures of engines are many times based on this information. In the case of the marine engines, construction equipment like cranes or bulldozers, diesel generator or turbine generators, the estimation of the equipment’s condition is done based on their working hours rather than in odometer readings. This is because the movement on the ground of this machinery is not the main work that they do [7].
Hour meters could be differentiated into three main types, according to with the kind of connection they require.
The first types are based on devices connected to some critical switching circuitry, for example, to an engine’s kill switch [8]. Because the engine’s status depends on the switch
STATE OF ART
position, this type of hour meter is simple and reliable. However, it is intrusive, and the understanding of the ignition system or at least of the switch circuit is required in order to install the device properly.
The second type of devices identify the state of the engines, either using a capacitive or an inductive pickup circuit. In both cases, the sensors are non-intrusive and clamped around high-voltage cables between the spark plug and ignition coil or magneto [9]. This method is less reliable because typically only the signal of one spark plug is used and if the firing voltage for some reason is not generated (in the corresponding wire) while the engine is working, the counter will not be incremented. The main disadvantage, however, results from its application, which is confined to petrol engines only.
The third type uses vibration’s analysis. This method uses a simple fixed threshold, or some other algorithm, to detect the engine’s state. It is non-intrusive, and the installation process is simple. In order to obtain accurate results the counter should be installed as close as possible to the engine. An hour meter of this type is compatible with any engine, and it can be used with any other kind of machinery, that produces vibrations. The only challenge could be the accuracy of the detection. Commercial solutions based on this solution are already available [10]. The solution shown in figure 1 constitutes a tiny device with a minimum current consumption of 6 µa, which allow achieving an autonomy of 2.5 years with a CR2032 battery. The device allows the selection of two levels of sensitivity. This hour meter provides useful information, but it requires a periodical reading of the information shown on display. This supervisory task, however, can be automated.
STATE OF ART
2.2 F
AULT DETECTION INIC
ENGINES2.2.1 MONITORING METHOD
Predictive detection strategy in engines can use different monitoring methods, namely: vibration analysis, oil analysis, performance analysis, thermography, or ferrography analysis. Among them, vibration analysis is a particularly interesting technique because it not only enables a non-intrusive monitoring but also the identification/classification of faults. It can also be used to support periodic and constant monitoring of engines.
Vibration analysis has about 60 years of history [11]. Originally, this type of analysis was mostly used in potentially dangerous industries like petrochemical and nuclear where machinery condition is critical. The series of unfortunate accidents in these industries during several decades and its significant economic consequences gave rise to the growth of this type of analysis [12]. Subsequent evolution of piezoelectric material and advances of microprocessors and microelectromechanical systems (MEMS) made this analysis one of the most common in the area of machine condition monitoring.
An early example of vibration analysis for fault detection in IC engines can be found in a mechanic’s stethoscope (see Fig. 2).
Fig. 2: Mechanic’s stethoscope.
This tool allows the detection of different problems, including worn bearing and blocked injector. Thus, the automation of this process can improve reliability and bring the ability to detect more complex issues.
STATE OF ART
2.2.2 VIBRATION SENSING
Vibrations are characterized by their displacement, velocity, and acceleration. Non-intrusive sensors are used to obtain each of these characteristics. However, in the case of displacement, existing sensors can only measure relative values [1]. Moreover, the nature of mechanical systems is such that appreciable displacements only occur at low frequencies, therefore in the general study of mechanical vibration, displacement measurements are of limited value [13].
There are two types of acceleration transducers or accelerometers: piezoelectric and MEMS. MEMS-based accelerometers are cheap and have a digital interface but have a cutoff frequency of nearly 1 kHz, or less, whereas piezoelectric accelerometers are expensive and have wider bandwidths (generally about 10 kHz).
The price and performance of velocity transducers are close to the piezoelectric accelerometers. However, their typical frequency limit is only of a few kHz. Apart from higher frequency ranges, a piezoelectric accelerometer has a higher dynamic range and does not have internal moving parts [9].
PVDF piezo films constitute another option. They combine acceptable prices with a wide scale of bandwidth measurements. They, however, are very sensitive to Electromagnetic Interference (EMI) and require protection in harsh environments.
2.2.3 SIGNAL PROCESSING
In the case of IC engines, regardless of the type of sensor used to capture vibrations, the signal is non-stationary and multicomponent. Due to the number of components that compose the signal, time domain analysis is complicated. Some components can change their amplitude or frequency over time, and these variations are a primary source of information about the engine condition. Frequency domain analysis tools like Fast Fourier Transform (FFT) show different components but do not indicate their changes. However, time-frequency (TF) analysis allows tracking variations on time and frequency domains simultaneously, and that is why it is commonly used in this area.
Several methods can be used for TF analysis, but the improvement of existing ones and the addition of new ones does not stop. Some works have been dedicated to describe and classify these existing methods [14][15][16]. According to [16], all methods can be classified into six groups: (1) linear TF representation, (2) bilinear TF distributions, (3) time-varying higher
STATE OF ART
order spectra, (4) TF Auto-Regressive Moving Average (ARMA) model, (5) adaptive parametric and (6) non-parametric TF analysis.
Despite the diversity of methods, the most used ones belong to linear TF representation and to the Cohen’s class distributions, which are part of bilinear time distributions. In the following, these methods are described considering their original mathematical expressions expressed as a function of continuous signals.
2.2.3.1 Linear TF representation
The two main methods of the linear TF representation are Short-time Fourier transform (STFT) and the Wavelet transform.
2.2.3.1.1 Short-time Fourier transform
In the case of STFT, the signal is firstly divided into short segments, and a Fourier transform is afterward applied to each segment, giving a variation of the spectrum with time:
𝑆𝑇𝐹𝑇𝑥(𝑡, 𝑓, ℎ) = ∫ 𝑥(𝑢)ℎ∗(𝑢 − 𝑡)𝑒−𝑗2𝜋𝑓𝑢
+∞ −∞
𝑑𝑢 (1)
In this equation, t represents the time, f the frequency and h(t) is a short time analysis window.
The fixed window length does not allow obtaining the same resolution in the time domain for low-frequency and high-frequency components. Due to the Heisenberg-Gabor inequality, it is also not possible to obtain a fine resolution in the time domain and frequency domain simultaneously [17]. Due to these disadvantages, this method is rarely used. The only work that was found to use the STFT, applied it in the detection of faults in a jet engine [18]. On the other hand, STFT is sometimes used as a reference, i.e. to evaluate the performance of other methods, like for instance in [19].
2.2.3.1.2 Wavelet transform
The wavelet transform decomposes a signal into wavelets, in the form of functions obtained by dilations or translation of a prototype function called mother wavelet:
(𝑇𝑓)(𝑎, 𝑏) = |𝑎|−1/2∫ 𝑑𝑡𝑓(𝑡)𝜓 (𝑡 − 1
STATE OF ART
In this equation, defined as Continuous Wavelet Transform (CWT), 𝑎 represents a translation parameter and 𝑏 a dilation parameter. Different mother wavelets 𝜓(𝑡) can be used. The following figure shows some of them (see Fig. 3).
Fig. 3. Mother wavelets.
Unlike STFT, the window length of wavelet transform varies with the frequency, which allows maintaining the same resolution for low and high frequencies.
A discrete version or Discrete Wavelet Transform (DWT) is shown below:
𝑇𝑚,𝑛(𝑓) = 𝑎0−𝑚/2∫ 𝑑𝑡𝑓(𝑡)𝜓(𝑎0−𝑚𝑡 − 𝑛𝑏0) (3) In this equation 𝑛 represents the translation parameter, m is the dilation parameter and 𝑎0 , 𝑏0 vary according with the wavelet used.
Several works have successfully used a discrete wavelet transform to detect faults in IC engines. In [20] misfire detection using wavelet transforms have shown to be more effective than traditional methods. In [21] a Morlet wavelet was used for acoustic signal processing to provide information about IC engine condition. The authors used four directional microphones, which were installed in different positions to capture a data, before applying a wavelet transform. According to the results, the fault detection accuracy rate depends strongly on a microphone’s position, reaching an accuracy of nearly 80-90% for the best position. The work done in [22] illustrates the advantage of the wavelet analysis as a time-frequency method
STATE OF ART
when compared with the analysis in the frequency domain. In [23] and [24] successful use of DWT for fault detection in IC engines was done allowing a real-time monitoring.
In order to be able to compare the performance of the wavelet transform, with other TF methods, a scalogram is used. A scalogram is a method of visualization of the wavelet transform in the TF domain:
𝑆𝐶𝑥(𝑡, 𝑎; ℎ) = ∫ ∫ |𝑇𝑥(𝑡, 𝑎; 𝜓)|2𝑑𝑡𝑑𝑎 𝑎2 +∞ −∞ +∞ −∞ (4) The relation between wavelet transform and wavelet scalogram is similar to the relation between STFT and Fourier spectrogram.
2.2.3.2 Cohen’s class distributions
The Fourier spectrogram, Wigner-Ville (WV) and derivatives of WV are Cohen’s class distributions which include some parametrization function to remove or, at least, attenuate interference terms.
2.2.3.2.1 Fourier spectrogram
The Fourier spectrogram is a squared modulus of the STFT:
𝑆𝑃𝑥(𝑡, 𝑣) = |∫ 𝑥(𝑢)ℎ∗(𝑢 − 𝑡)𝑒−𝑗2𝜋𝑣𝑢 +∞ −∞ 𝑑𝑢| 2 (5) It represents a spectral energy density, with a time-frequency resolution equal to the STFT. In [25] the spectrogram was used to detect a broken rotor bar of an induction motor. In [26] the spectrogram was also used for fault detection in a wind turbine. Several distributions are compared in this later article, with the spectrogram showing a good readability, but also the lowest time-frequency resolution.
2.2.3.2.2 Wigner-Ville distribution
The Wigner-Ville distribution (WVD) is a key distribution of Cohen’s class, expressed by: 𝑊𝑉𝑥(𝑡, 𝑓) = ∫ 𝑥 (𝑡 + 𝜏 2) 𝑥 ∗(𝑡 −𝜏 2) 𝑒 −𝑗2𝜋𝑓𝜏𝑑𝜏 = +∞ −∞ = ∫ ∫ 𝐴𝑥(𝜏, 𝑣)𝑒−𝑗2𝜋(𝑣𝑡+𝑓𝜏)𝑑𝑣𝑑𝜏 +∞ −∞ +∞ −∞ (6)
STATE OF ART 𝐴𝑥(𝜏, 𝑣) = 1 2𝜋∫ 𝑥 (𝑡 + 𝜏 2) 𝑥 ∗(𝑡 −𝜏 2) 𝑒 −𝑗2𝜋𝑣𝑡𝑑𝑡 +∞ −∞ (7)
WVD has a good TF resolution, but by being a bilinear function, suffers from cross-terms. In the simplest case, two signal components contribute to an interference term which is located in the middle point between signal components. The interference term has an oscillating nature, and its oscillation frequency is proportional to the distance between signal components. Thus, readability decreases with the increase of signal components.
In [27] the WVD was used for fault detection in mechanical reducer gearset, reaching a high recognition rate. In [28] this method was used for fault detection in power transformers. WVD was also used for IC engine fault diagnosis [29][30]. Results showed a high diagnostic accuracy. In [29] vibration acceleration was used for diesel engine condition monitoring whereas in [30] acoustic signal was used for scooter’s engine condition monitoring.
One of the ways to reduce cross-terms is to use some parametrization function 𝑓(𝜏, 𝑣) to provide smoothing. There is a considerable number of distributions that use some parametrization functions and one drawback is common to all: smoothing is done at cost of time-frequency resolution.
In this field, the pseudo-WVD (PWVD) uses a window to attenuate interference terms: 𝑃𝑊𝑉𝑥(𝑡, 𝑓) = ∫ ℎ(𝜏)𝑥 (𝑡 + 𝜏 2) 𝑥 ∗(𝑡 −𝜏 2) 𝑒 −𝑗2𝜋𝑓𝜏𝑑𝜏 +∞ −∞ (8)
The smoothed-pseudo WVD (SPWVD) typically allow achieving better suppression of interference terms: 𝑆𝑃𝑊𝑉𝑥(𝑡, 𝑓) = ∫ ℎ(𝜏) ∫ 𝑔(𝑠 − 𝑡) +∞ −∞ +∞ −∞ 𝑥 (𝑠 +𝜏 2) 𝑥 ∗(𝑠 −𝜏 2) 𝑒 −𝑗2𝜋𝑓𝜏𝑑𝜏 (9) In [31] and [32] WVD, PWVD, and SPWVD were used for detecting rotor faults. In both articles, the performance of these methods was compared and SPWVD, as well as PWVD, did provide effective suppressing of cross-terms.
Another member of the Cohen’s class is the Rihaczek distribution: 𝑅𝑥(𝑡, 𝑓) = 𝑥(𝑡)𝑋∗(𝑓)𝑒−𝑗2𝜋𝑓𝑡
(10) This distribution returns complex values, and for some applications, real values are more suitable. For this reason, the Margenau-Hill distribution was developed, which corresponds to the real part of Rihaczek distribution:
STATE OF ART 𝑀𝐻𝑥(𝑡, 𝑓) = 𝑅𝑒{𝑥(𝑡)𝑋∗(𝑓)𝑒−𝑗2𝜋𝑓𝑡} = = ∫ 1 2(𝑥(𝑡 + 𝜏)𝑥 ∗(𝑡) + 𝑥(𝑡)𝑥∗(𝑡 − 𝜏))𝑒−𝑗2𝜋𝑓𝜏𝑑𝜏 +∞ −∞ (11)
In [33] the Margenau-Hill distribution was used for evaluating arterial elasticity. According to the authors, this method was able of obtaining a notable difference between healthy volunteers and patients with the already diagnosed cardiovascular disease.
For better cross-terms rejection a pseudo-Margenau-Hill distribution was developed: 𝑃𝑀𝐻𝑥(𝑡, 𝑓) = ∫ ℎ(𝜏)
2 (𝑥(𝑡 + 𝜏)𝑥
∗(𝑡) + 𝑥(𝑡)𝑥∗(𝑡 − 𝜏))𝑒−𝑗2𝜋𝑓𝜏𝑑𝜏 +∞
−∞ (12)
In [34] this distribution was used for damage detection in bimetal composite pipes and was able to identify them.
There is also the Margenau-Hill spectrogram: 𝑀𝐻𝑆𝑥(𝑡, 𝑓) = 𝑅𝑒{𝐾𝑔ℎ−1𝐹
𝑥(𝑡, 𝑓; 𝑔)𝐹𝑥∗(𝑡, 𝑓; ℎ)} (13)
where 𝐾𝑔ℎ = ∫ ℎ(𝑢)𝑔∗(𝑢)𝑑𝑢, and 𝐹𝑥(𝑡, 𝑓; 𝑔) is the STFR of x (analysis window g).
In [35] this method was used to obtain a TF resolution similar to the Fourier spectrogram. The next distributions belong to the group of reduced interference, which is a part of the Cohen’s class.
2.2.3.2.3 Choi-Williams distribution
Choi-Williams distribution is one of these distributions: 𝐶𝑊𝑥(𝑡, 𝑓) = 2 ∫ ∫ √𝜎 4√𝜋|𝜏|𝑒 −𝑓2𝜎/(16𝜏2)𝑥 (𝑡 + 𝑓 +𝜏 2) 𝑥 ∗(𝑡 + 𝑓 −𝜏 2) 𝑒 −𝑗2𝜋𝑓𝜏𝑑𝑓𝑑𝜏 +∞ −∞ (14)
This distribution was used in cardiovascular diseases detection [36][37] and in the study of gearbox prognosis [38]. In [39] this method was also used for chirping mode signals visualization in Tokamak plasmas, and Choi-Williams distribution provided better TF resolution comparing to Fourier spectrogram.
2.2.3.2.4 Born-Jordan distribution
The Born-Jordan distribution also belongs to the reduced interference distribution group: 𝐵𝐽𝑥(𝑡, 𝑓) = ∫ 1 |𝜏| +∞ −∞ ∫ 𝑥 (𝑠 +𝜏 2) 𝑥 ∗(𝑠 −𝜏 2) 𝑑𝑠 𝑡+|𝜏|/2 𝑡−|𝜏|/2 𝑒−𝑗2𝜋𝑓𝜏𝑑𝜏 (15)
STATE OF ART
It was used in the medicine area for electrocardiogram analysis [40] and electromyographic signal [41]. In [41] it showed a TF resolution similar to the Choi-Williams or Cone-Shaped Kernel distributions, better than the Fourier spectrogram or scalogram. Also, it showed fewer cross-terms, when compared with the WVD method.
2.2.3.2.5 Zhao-Atlas-Marks distribution
Zhao-Atlas-Marks distribution (ZAMD) or Cone-Shaped Kernel distribution is another member of the reduced interference distribution group:
𝑍𝐴𝑀𝑥(𝑡, 𝑓) = ∫ [ℎ(𝜏) ∫ 𝑥 (𝑠 +𝜏 2) 𝑥 ∗(𝑠 −𝜏 2) 𝑑𝑠 𝑡+|𝜏|/2 𝑡−|𝜏|/2 ] +∞ −∞ 𝑒−𝑗2𝜋𝑓𝜏𝑑𝜏 (16)
In [42] it was used for stator short circuits detection in permanent magnet synchronous motors. In [43] this distribution was also used for broken rotor detection through vibration analysis. In [44] different TF distributions were compared including WV, Choi-Williams, Born-Jordan, and ZAMD. Up to a certain noise level, the last three distributions effectively reduce cross-terms. Among the three methods, the ZAMD also needed less computational time. In [45] ZAMD and other distributions were tested in the detection of rotor faults in brushless DC motors. According to the authors’ conclusions, ZAMD provided high cross-term suppression, but Choi-Williams offers a better compromise between TF resolution and cross-term suppression.
2.2.3.3 Evaluation of the methods
While the above methods can be used to generate TF representations of the measured signals, this by itself do not allow the detection of faults. In order to detect faults, they need to be complemented with other methods. Several methods can be used to assess and compare these TF representations. In the following, three main methods are described: visual analysis, Rényi entropy and pattern recognition accuracy [46].
2.2.3.3.1 Visual analysis
Visual analysis was used in most of the references shown in the previous chapter. This method is very popular because it allows performance comparison of different methods based on various properties, including the TF resolution, cross-terms presence, the number of components and its dynamic change. It, however, relies on human assessment and a person engaged in the processing of results must have certain skills and experience to achieve a
STATE OF ART
correct interpretation of the results. Even so, some subjectivity sometimes takes place. Thus, automatic methods should be considered like the ones that we will describe in the following. 2.2.3.3.2 Renyi Entropy
The Rényi entropy (for the discrete outputs) is defined as: 𝑅𝑥𝛼 = 1 1 − 𝛼𝑙𝑜𝑔𝑏(∑ ∑ ( 𝑇𝐹(𝑛, 𝑘) ∑ ∑ |𝑇𝐹(𝑛, 𝑘)|𝑛 𝑘 ) 𝛼 𝑘 𝑛 ) (17)
where 𝛼 represents the entropy order.
In [47] this method showed to be a promising method for TF information content measure. 2.2.3.3.3 Pattern recognition
A different approach is to perform the comparison of methods based on the accuracy of the pattern recognition. This is a popular method. It consists in the classification of extracted features. The feature extraction is the essential part of the process of fault detection, and it strongly influences the recognition accuracy. This method is used in some of the works referenced in the last chapter, as for instance in [27] and [28].
In [46] a direct correlation between Rényi entropy and pattern recognition was also found.
2.3 C
OMMUNICATION SOLUTIONSIn the process of fault detection, the data obtained from the engine needs to be transmitted to a server on the Internet. At this level, several solutions can be used. By adding wireless connectivity to hour meters, client devices/applications can periodically request the readings, informing users about the required maintenance procedure. Also, besides the total number of working hours, the corresponding working intervals can be collected for statistical analysis.
A smartphone, tablet or smartwatch are considered as a possible client device in this work. These devices have different wireless interfaces, which can be used to communicate with the hour meter. The infrared port is one of the oldest mobile phone interfaces. It uses the infrared region of the electromagnetic spectrum and requires a direct line of sight. Because of this limitation, this interface is rarely used. The standardization was provided by the Infrared Data Association (IrDA) group [48], but there are many devices with proprietary protocols. Nowadays, this interface is mainly used for the control of home appliances.
STATE OF ART
Near-field communication (NFC) is a short-range communication that uses electromagnetic induction. It operates on 13.56 MHz frequency at a typical working distance of about 4 cm, with speed rates of 106, 212 or 424 kbit/s [49]. It is mostly used in payments, file sharing or as a pairing method for Bluetooth low energy.
Bluetooth is another short-range wireless technology. It includes several versions or specifications, all within the same operation frequency – 2.4 GHz. The most common versions are the 2.1 and 4.x [50]. Version 2.1 supports Basic Rate (BR) mode – 1 Mbps and Enhanced Data Rate (EDR) mode 2 Mbps. It is mostly used for constant connections as with a mouse, a keyboard, a headset or as a cable replacement. Version 4.x is also known as Low Energy (LE). It is focused on power saving, and its maximum data rate is 1Mbps. The low power version has many applications as home automation, fitness metering, and beacons. These two versions are incompatible, and their data rates cannot be compared directly.
The Wi-Fi technology, different from the previous ones, can transport Internet Protocol (IP) packets, and thus provide direct access to the Internet [51]. It operates on a frequency level of 2.4 or 5 GHz and includes four standards: a, b, g, n. Wi-Fi is typically used to provide wireless access to the Internet, and so it truly embraces the IoT logic. However, its power consumption is much higher than the Bluetooth or NFC interfaces.
At the higher layers different solutions can be used to communicate between the mobile terminal and the server that processes data like Constrained Application Protocol (CoAP) [52], or Message Queuing Telemetry Transport (MQTT) [53], in addition to WebAPIs RESTful based on Hypertext Transfer Protocol (HTTP), for communication with IP servers using JSON ou XML. As for communication with the sensors, the MQTT is one of the protocols that has gained more scope.
Since the aim of this project is to automate the hour metering process, the infrared interfacing and NFC were not considered as a viable solution due to their restricted range. Also, the Wi-Fi connection was considered as consuming too much to enable more than a year of autonomy. Among the several solutions, since the power consumption is a critical issue, the Bluetooth, especially the LE version, was considered to be better suited.
3. N
ON-I
NTRUSIVEM
ONITORINGS
YSTEMThis chapter presents the proposed solution for the non-intrusive monitoring system, and also the analysis for the selected components to be used.
3.1 P
ROPOSEDS
YSTEMA
RCHITECTUREAs previously mentioned, this work proposes an IoT solution for a non-intrusive low-cost monitoring system to detect faults and register working hours of IC engines, focusing boat engines. Fig. 4 illustrates the proposed system. An IoT device is installed in a boat engine to collect engine’s vibration data and send it to a user’s smartphone via Bluetooth communication interface. The smartphone can pre-process this data and also send it to the internet, to a cloud-based server, where all the data is stored and continuously analyzed. The smartphone can also serve as a user interface with the system, which should include an app to allow the user to view all data results or be advised about the engine’s maintenance procedures.
Fig. 4. System architecture
After the mounting of the device on the engine, the pairing procedure must be performed between the client device (user’s smartphone) and the developed IoT device, establishing a
NON-INTRUSIVE MONITORING SYSTEM
connection between these two devices. Following this procedure, a calibration routine should be executed for correct detection of the engine’s state. Moreover, this calibration routine must be executed after each battery replacement, as the position in which the module was installed can be different and a reliable detection of the engine’s state is not guaranteed without the calibration procedure. After the calibration, the IoT device starts the constant monitoring of the engine state, in order to track working hours and for the BLE module to start its advertising routine each time the engine is started. During an advertising period, a client device can connect to the IoT device, it in order to retrieve the information using a software application. This user’s app, after being connected to the IoT device and after the motor starts running, initiates a periodical data monitoring routine on the vibration data, which is stopped if the client device is not within the motor’s range.
A low power accelerometer will be used to monitor the engine’s activity, and a piezoelectric polyvinylidene fluoride (PVDF) film is used to record the engine’s vibration, for fault detection. Two devices are used because the system has to be low-power and allow faults to be identified. Therefore, the low-power accelerometer is used to be periodically activated and record the engine’s working hours (providing a low-frequency rate vibration data signal). However, the piezoelectric sensor, which needs more power requirements due to the electronic circuit necessary to amplify and capture its data, will be activated sparsely in time to record a high rate vibration signal, to allow a fault detection analysis. In the next section, the component selection will be explained, providing more in-depth information on the sensors and system requirements.
As boats can have more than one engine, different implemented IoT devices are installed in every boat’s engines to capture the vibration’s information, which will then be sent to a smartphone or another client device using a Bluetooth Low Energy (BLE) interface. Each device has a distinct ID. After receiving the data, the client device forwards it through a Wi-Fi or mobile network connection to a cloud server on the Internet, for further processing. This is done using a Web Application Programming Interface (API) where the device’s ID acts as a unique key. The server then processes the received data, notifying the client’s terminal in case it detects any fault. It also increments the number of hours that the engine has been working, making this information available to the mobile terminal and notifying the user in case a routine maintenance is needed. Besides processing it, the server also stores the data for statistical purposes, i.e. the user can access historical data about the engine(s) usage. The client’s mobile device and application simultaneously act as an Internet gateway of Machine-to-Machine Communications (M2M) and Human-Machine Interface (HMI).
NON-INTRUSIVE MONITORING SYSTEM
The developed technique for fault detection includes data acquisition, analog and digital pre-processing and digital processing. The most important part of the digital processing, in this case, is a Time-Frequency Analysis (TFA). Several TFA algorithms are tested with real data to select the best solution to detect faults in such engines.
3.2 S
ENSORS AND COMPONENTS SELECTION FOR THEI
OT
D
EVICEThis section begins with a more detailed definition of the requirements and key characteristics. After that, based on these requirements, the architecture of the IoT device is defined, and for each block the required components are selected. The selection of components is done according with the characteristics which are considered relevant for the corresponding module, and considering that this is a first prototype intended to make a proof-of-concept.
3.2.1 KEY CHARACTERISTICS
The main requirements imposed to the IoT device are low price, small size, two years autonomy and a wireless connectivity by Bluetooth.
One example a device that corresponds to these requirements is the SensorTag kit CC2650STK from Texas Instruments (TI) [54]. It is a reference design built around CC2650 wireless microcontroller unit (MCU) which includes an ARM Cortex-M3 microprocessor and a series of peripherals. There are few remarkable features like autonomous sensor controller, support for different protocols (BLE, ZigBee, 6LoWPAN, and ZigBee RF4CE) and ultra-low power (1 µA in a standby mode and 100 nA in a shutdown mode). Apart from MCU, this kit comprises a number of sensors which allow to measure ambient or object temperature, the intensity of light, humidity, absolute barometric pressure. It also has an accelerometer, gyroscope, compass, digital microphone and reed sensor. Next table resumes characteristics of the kit which are essential for this work (see Tab. 1).
NON-INTRUSIVE MONITORING SYSTEM
Tab. 1. CC2650STK characteristics.
Price $29
Battery type Coin cell (CR 2032)
Range 50 m
Battery lifetime One year (1-second report interval)
Size (W x H x D) 5 x 6.7 x 1.4 cm
These characteristics will be used as a reference during development. Usage scenario also imposes several requirements. The sensing of the working periods is done by a constant monitoring of the engine’s state. The Bluetooth connectivity on the IoT device is switched on when the engine starts. This allows the update of the information on a client’s device only when the engine is working. In addition to it, a client device can initialize the engine’s condition check procedure.
Vibration analysis can be used to check both, the on/off state of the engines and its condition. However, the identification of the on/off state imposes a much lower power consumption of the hardware, which is partially compensated by lower performance needs. Thus, it can operate continuously due to the fact that it consumes little.
In the case of the condition monitoring, the sensitivity of the sensor is more important than the power consumption - because this check is only occasionally done. It is then difficult to implement a system that meets both requirements while assuring low hardware costs. In order to do it, a distinct hardware block for each of these tasks is used. A time counting block is required to provide the information about current time. Also, the information about working hours should be retained when the power goes down which implying the integration of a non-volatile memory, to save this information. A Bluetooth module is also needed for communication purposes, and also a control block, to implement all the control procedures and interface with other peripheral blocks.
NON-INTRUSIVE MONITORING SYSTEM
3.2.2 ARCHITECTURE OF THE IOT DEVICE
The architecture that results from the requirements described in the previous subsection is shown in figure 5.
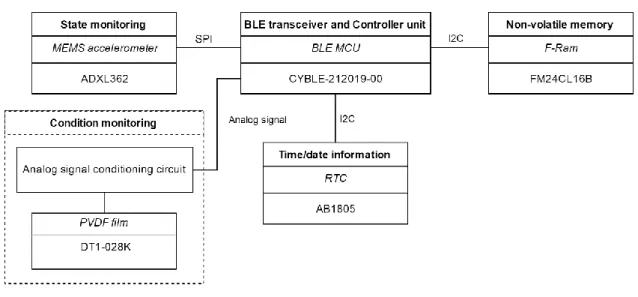
Fig. 5. Device architecture.
After the study of the market, it was concluded that for the Bluetooth transceiver and controller unit an MCU that incorporate a Radio Frequency (RF) Transceiver and a microcontroller would be the best solution because they usually have low power consumptions and high levels of integration. Furthermore, there are pre-certified modules that apart from the mentioned MCU include all the necessary analog circuitry for the RF. Another advantage is the minimal number of external components.
As for the non-volatile memory, there are four principal types: Electrically Erasable Programmable Read-Only Memory (EEPROM), flash memory, Non-Volatile Random-Access Memory (NVRAM), and Ferroelectric Random-Random-Access Memory (F-Ram).
The timer of the MCU can be used as a time counter. However, for saving working intervals, the knowledge about current time/date is required. For this purpose, Real-Time Clocks (RTC) are typically used.
MEMS accelerometers are better suited for engine’s state monitoring whereas PVDF films are a better choice for condition monitoring. Still, the PVDF films needs a signal conditioning circuit.
NON-INTRUSIVE MONITORING SYSTEM
The system architecture was modified taking into consideration the described solutions. It is shown in figure 6.
Fig. 6. Modified system architecture.
3.2.3 MEMS ACCELEROMETER
After analyzing the solution available in the market, two candidates were selected for a more detailed comparison. Their characteristics are summarized in the following table (Table 2).
The IIS328DQ [55] provides wider temperature range and output data rate (ODR), when compared with the ADXL362 [56]. It also supports an Inter-Integrated Circuit (I2C) interface, in addition to a Serial Peripheral Interface (SPI), and comprises a programmable high-pass filter. The high-pass filter can be used to remove static acceleration. The cost of the ADXL362 is twice the cost of the IIS328DQ. However, its current consumption is far lower than the one of the IIS328DQ or any other accelerometer available in the market. The ADXL362 provides additional features, like autonomous interrupt processing, standalone sleep/wake transition and embedded FIFO. These features allow the reduction of the number of communications between the MCU and the accelerometer and thus, the current consumption.
Given these advantages, we opted to use the ADXL362, despite the difficult of assembly it imposes and its significantly higher price.
NON-INTRUSIVE MONITORING SYSTEM
Tab. 2. Characteristics of chosen MEMS accelerometers.
Characteristic IIS328DQ ADXL362
Price for 1000 pieces € 2.20 € 4.86 Supply voltage range 2.16 – 3.6 V 1.6 – 3.5 V
Temperature range -40 ˚C to +105 ˚C -40 ˚C to +85 ˚C
Resolution 12 bits 12 bits
Measurement range ±2g/±4g/±8g ±2g/±4g/±8g
Output data rate 50, 100, 400, 1000 Hz 12.5, 25, 50, 100, 200, 400 Hz
Interface SPI/I2C SPI
Interrupt 2 2 Current consumption modes at 3.3 V voltage supply Normal: 250 µA Low-power: 10 µA Power-down: 1 µA
Ultralow noise: 15 µA Low noise: 4.5 µA
Normal: 2.7 µA Wake-Up: 270 nA
Standby: 10 nA
Extra features Programmable high-pass
filter
Autonomous interrupt processing, standalone sleep/wake transition, embedded FIFO, on-chip
temperature sensor
Soldering ++ +
3.2.4 PVDF FILM
Only one suitable PVDF film sensor was found. It is a rectangular element of piezo film with silver ink screen printed electrodes [57]. Its operating temperature ranges from -40 to 60 °C. There are two versions with or without lead wires attached. Different film dimensions are available. The film without leads can be fixed using double-sided tape or epoxy, providing direct attachment to the PCB. The sensor is also low-cost – version without leads costs € 2.38 for 1000 pieces. There isn’t any information about frequency response, however, in the datasheet of a similar film of the same manufacturer [58] a frequency response chart is shown (see Fig. 7).
NON-INTRUSIVE MONITORING SYSTEM
Fig. 7. PDVF film sensor frequency response, obtained from [58]
The transfer characteristic of the film is similar to the frequency response of a high-pass filter, and its cut-off frequency depends on the input impedance of the connected circuit. It can be seen that the curve is flat up to 10 MHz. This film is folded over on itself providing shielding and coaxial cable attached to the sensor. Both films are shown in figure 8.
The shielded version with coaxial cable is better suited for tests because the hardware can be changed independently, but also since the shield protects against EMI [59].
Fig. 8. PVDF film sensors: version without leads on the left and shielded version with coaxial cable on the right.
3.2.5 RTC
Among the huge number of components in the market, there is one that stands out for its extremely low current consumption and reasonable price. The AB18X5 [60] from Abracon has a minimum current consumption of 14 nA if an integrated RC oscillator is used and costs
NON-INTRUSIVE MONITORING SYSTEM
€0.854 when 1000 pieces are bought. Current consumption in other two modes is also very low: 55 nA with an external crystal oscillator and 22 nA when an internal RC oscillator is used (and periodical autocalibration is performed using external crystal oscillator as a reference). Despite its low consumption, this component not only provides basic timekeeping functions but also: (1) allows the definition of alarms, (2) generates output clock or reset signal, and (3) controls external components using integrated power switch which can be controlled manually or by interruption signal. Interruption signal generation is also available as well as a watchdog timer. A 256 bytes volatile RAM is also available. The availability of a communication interface depends on its version and can be I2C or SPI. It supports industrial temperature ranges. Its operating voltage ranges from 1.5 to 3.6 V. Hot air station can be used for soldering when using the QFN-16 package.
3.2.6 NON-VOLATILE MEMORY
Before analyzing the components available in the market, we started by defining the required size of the memory. The non-volatile memory, like already was mentioned, is required to hold the total working time and working intervals in the future. It also can be used to store calibration data or other information. Considering that the accumulated working time is expressed in seconds, a 32-bit unsigned integer seems to be an appropriate choice as it allows storing 4294967296 seconds, or 1193046 hours, which is about 136 years. Also, for each working interval, a start and stop time instants must be stored. The system should be capable of storing at least the last 100 working cycles. Start and stop instants can be stored in the Unix time format, and thereby 32 bits are required for each instance or 64 bits for each working cycle. By reserving ten 32-bit numbers for future use, the minimum size of the memory will be 32 + 64 × 100 + 32 × 10 = 6752 bits.
As was mentioned earlier, there are four main non-volatile memory types: EEPROM, flash, NVRAM, F-Ram. In each of these types of the memory a component was chosen, before performing a deeper comparison. Table 3 summarizes the relevant characteristics of the compared components.
![Fig. 7. PDVF film sensor frequency response, obtained from [58]](https://thumb-eu.123doks.com/thumbv2/123dok_br/18631351.911072/48.893.140.733.129.477/fig-pdvf-film-sensor-frequency-response-obtained.webp)