Effect of type of food and culture density on
the rearing of Seriola dumerili
T
IAGOE
STEVESJ
ORGEV
ERÍSSIMODissertation to obtain the degree in
Masters in Aquaculture and Fisheries
Specialty in Aquaculture
2
Effect of type of food and culture density on
the rearing of Seriola dumerili
TIAGO ESTEVES JORGE VERÍSSIMO
Masters in Aquaculture and Fisheries
Specialty in Aquaculture
Thesis coordinated by:
António de Vilhena Andrade Ferreira Sykes, PhD
Virginia Martín, PhD
Salvador Jerez, PhD
Covadonga Rodríguez González, Senior Lecturer
3
EFFECT OF TYPE OF FOOD AND CULTURE DENSITY ON THE REARING OF SERIOLA
DUMERILI
“Declaração de autoria do trabalho”
“Declaro ser o autor deste trabalho, que é original e inédito. Autores e trabalhos consultados estão devidamente citados no texto e constam da listagem de referência incluída”
“Copyright”
“A Universidade do Algarve tem o direito, perpétuo e sem limites geográficos, de arquivar e publicar este trabalho através de exemplares impressos reproduzidos em papel ou de forma digital, ou por qualquer outro meio conhecido ou que venha a ser inventado, de o divulgar através de repositórios científicos e de adquirir a sua cópia e distribuição com objectivos educacionais ou de investigação, não
comerciais, desde que seja dado crédito ao autor e editor.”
____________________________________ (Tiago Esteves Jorge Veríssimo)
4
Acknowledgements
Nenhum Homem é uma Ilha”
Quando comecei os agradecimentos nem sabia por onde começar. Aconselharam-me a voltar “atrás no tempo” de maneira a lembrar-me de todo o processo e todas as pessoas que foram influentes no desenrolar desta aventura. A verdade é que o tempo passou e já vai longe o dia em entrei pela primeira vez no escritório do Professor António Sykes perguntando pela proposta de tese no grande e majestoso Lírio, a levar a cabo em uma das exóticas ilhas “africanas”, que todas juntas formam o Arquipélago das Canárias.
Mas agora que penso bem, talvez não seja por aí que devo começar a lembrar-me dos nomes de quem por direito, deve perdurar nesta folha para sempre, com o reconhecimento de ter contribuído à sua maneira para esta dissertação. Creio que seria demasiado redutor…
Redutor porquê? Pois, porque tudo o que fiz na vida teve a sua ligação com o passado, onde cada aventura é uma página, cada experiência uma aprendizagem e cada pessoa que conhecemos, uma ponte para novas aventuras e por aí afora. Dou hoje importância não só àqueles que me apoiaram durante esta minha aventura, como a todos os que conheci durante a mesma, para o bem e para o mal, pois arrisquei-me a atravessar a ponte, a sair da minha bolha, a minha ilha e ir atrás de novas paragens.
Voltei e hoje digo “Obrigado”:
A todas as pessoas com quem trabalhei no Instituto Oceanográfico Espanhol e na Universidade de La Laguna que me ajudaram na elaboração deste trabalho.
To my supervisors Covadonga, Salvador and Virginia, for all the help and availability throughout the dissertation, from the first day to the last. Without you it would not have been possible to finish! Salvador, I miss those cigarettes smoked in "our balcony" where conversations flowed between laughs. Taking into account the potential of MEDREGAL for aquaculture production, maybe someday we work together ... who knows?
Lupe, Deiene, Sara and the whole team of the Laboratory for the love you gave me, all the smiles and laughs! You made me feel at home! Lupe, the lab without your vibrant and energetic person is not the same thing!
Irma! I dedicate to you a special and unique "Gracias”. You were a friend, a colleague, a confidant ... You were extraordinary at all levels and would gladly work with you every day in the lab (no lunch hours!)! I remember fondly all the laughter and the moments you helped me. You made job become a funny thing to do! But all good fun is over ... Sorry for the hurry on the day I walked away, because I was never very good at goodbyes and tears were knocking on the door in the rush of leaving, due to the fact that I was not going to see you so soon.. For you, that Portuguese word: “Saudade” mi amiga. A la Real!
To all my ERASMUS colleagues who made this experience even more fantastic!! La FAMILIA: Mirjana Sredojević, Jerneja Leban, Fay Fameliti, Despina Papargiriou, Tiago Santos an Manuel Azevedo. Magic, Magic, MAAAAAGIC!
5
Professor António Sykes a si lhe agradeço a perseverança, dedicação e as horas intensas de trabalho comigo! Nas alturas em que mais precisava de apoio e conselhos nunca me falhou e apesar de não ser uma pessoa preguiçosa, nos momentos em que me encostava, tinha sempre uma palavra de aviso, um alerta e um “comentário word” implacável à minha espera! Obrigado pelo método e exigência, obrigado pela aprendizagem!
Aos meus CHEIOS. Vocês sabem quem são! São vocês que me fazem ser muito da pessoa que sou hoje. O nosso grupo é cativante, empreendedor, esforçado … temos sonhos, lutamos por eles e a nossa maior força está na amizade e nas “pontes” que nos ligam. Tem sido uma caminhada intensa, mas fantástica meus amigos. Vamos continuar! Só temos uma direcção e um só objectivo: Sucesso.
A todos aqueles que me acompanharam nesta vida académica, em especial aos meus colegas da Faculdade de Ciências da Universidade de Lisboa. Viva Biologia porque “Biologia é uma alegria”. Mais que isso é conhecimento e sabedoria. Tenho a certeza que de um de vós sairá um Nobel.
À PRAXE e todos os bons ensinamentos que ela traz: Disciplina, hierarquia, sacrifício, amizade e dedicação.
Serei sempre e para sempre um Académico orgulhoso. DURA PRAXIS SED PRAXIS
Às minhas “pontes” Filipa Grilo, Ana Rita Leitoguinho, Maria Rita Carvalho, Joana Revez, Minia Antelo, Inês Baptista, Maria Leonor Gouveia e Maria Bettencourt. Antes perto, agora longe. Vivemos intensas aventuras, dramas e alegrias. Sei que falhei mas vivo para vos orgulhar do padrinho que escolheram. Viva a Família do Alguidar!
Aos meus irmãos Vasco Veríssimo e Maria Bettencourt por todo o amor incondicional e paciência nas minhas alturas de stress e impaciência. A responsabilidade é grande, quando sei que vocês olham para o caminho que trilho, como o caminho a seguir. Tenho acompanhado o vosso desempenho e estou muito orgulhoso de vocês. Repito: Tenho muito orgulho no que vocês atingiram e espero ansiosamente por mais. Amo-vos do fundo do coração meus pequeninos. “ We have the magic within us”.
Uma palavra de amizade para a “minha gente do Norte”. Uma amizade que nasceu numa empresa e cresceu fora dela, atingiu o cume nos últimos tempos em que me mudei para a cidade Invicta. “Somos grandes gigantes com dez metros de altura” porque somos os campeões da boa disposição! Minhas queridas Wing Girls obrigado por todo o carinho e atenção. Aos “duros” Rui Fonseca e João Bernardo Thierstein sei que palavras sentidas não vos tocam, se sim, espero que chorem sozinhos e longe de olhares indiscretos após ouvirem as minhas palavras, pois tenho para convosco uma dívida gigante que demorará a saldar (se alguma vez conseguir) por me fazerem sentir em casa no Porto, como se em Lisboa estivesse. Nunca amarei o Porto como amo Lisboa, mas sinto hoje, graças a vós, uma paixão que aumenta todos os dias pela cidade onde vivo agora, onde vou crescer, onde me vou aventurar e estou entusiasmado e sem medo pois tenho amigos como vós. E tudo isto me faz sorrir, e tudo isto é amizade. Usss…!
Não me esqueço da minha querida e carinhosamente preguiçosa cidade algarvia e todos os que aí conheci: Faro. Tudo aí começou, e tudo aí irá acabar! Adoro Faro, adoro os “farenses” (à minha maneira) tendo eu inclusive sangue algarvio, mas conhecendo-me bem digo-vos de boa verdade que ficar em Faro seria o fim, pois o bom tempo, a boa gente, o sentimento
6
despreocupado, a praia a 5min, a “baixa farense” fariam de mim mole e acomodado. O menino betinho da linha voltará, não num dia de nevoeiro, mas num dia de sol! Impecável! Leandro Sá, meu amigo e companheiro de batalha. Obrigado por toda a amizade e companheirismo durante esta caminhada! Muito falámos e desabafámos sobre a tese e o quarto que ocupei sempre que fui a Faro por dois dias, irá ser pago um dia numa jantarada em que pediremos finalmente a desejada Dourada de 60euros! Eu pago! Espero ansiosamente pela tua explosão meu amigo. Sei que acontecerá em breve pois a sorte protege os audazes. Família é tudo nesta vida, e se tinha dúvidas, hoje tenho certezas! Sei que sou o “primeiro” filho, sobrinho, neto, primo…responsabilidade é muita. Espero ter estado dentro das expectativas! Obrigado por puxarem por mim Tios, Avós e primos!
Ao meu Avô. Meu querido, vibrante e fantástico Avô Carlos Jorge que me acompanhou durante toda a minha vida. As lágrimas traem-me enquanto escrevo este texto em tua honra e agradecimento por tudo o que fizeste na construção da minha pessoa. Tenho um grande pesar que não estejas aqui hoje, mas a vida continua e sei que estás algures a velar por mim. Meu querido avô…Consegui! E vou continuar, assobiando alegremente pela rua fora com um passo confiante e sorriso na boa. Porque foi assim que me ensinaste. A ti dedico este sucesso. Deixo para último “aquele obrigado” especial aos meus pais Paulo Veríssimo e Maria Luísa Jorge. A imensidão do meu obrigado não tem como ser expresso em palavras. Amo-vos. São um exemplo todos os dias e uma imagem de tudo o que quero na vida: família, amor e sucesso. Foram pais, amigos e colegas desde que nasci até hoje. Há uns tempos pensei que o meu maior objectivo era ter sucesso na vida, mas mais que isso é fazer-vos orgulhosos de mim daquilo que sou e do que atingi. Obrigado por tudo e sobretudo pela paciência e a insistência em tirar o melhor de mim. Vocês são “aquele treinador” que nunca desiste do jogador. O vosso “acreditar” faz de mim um ser Humano com uma autoconfiança gigante. Vocês criaram um monstro de sucesso e vou passar o resto da vida a provar-vos isso!
Fernando Pessoa disse “Cumpriu-se o Mar, e o Império se desfez. Senhor, falta cumprir-se Portugal”. Não sei o que será necessário, mas eu vou fazer a minha parte.
Para ti minha pátria amada. Para ti, Meu Portugal. “Bora equipa”
7
“Viver é fácil, o difícil é saber viver”
Aos meus pais, irmão e cão Paulo Veríssimo Maria Luísa Jorge
Vasco Veríssimo Baite
8
Resumo
Esta tese teve o intuito de estudar o efeito de três tipos de alimento diferentes em duas densidades diferentes para seleccionar um regime de alimentação ideal para o crescimento, a sobrevivência, os parâmetros plasmáticos, e para a composição lipídica do músculo e fígado dos juvenis de Seriola dumerili (Risso 1810) de maneira a cobrir todas as necessidades nutricionais e optimizar o custo-produção. A esse respeito, um total de 145 juvenis de Seriola
dumerili com um peso médio de 117.54 ± 54.98 g, foram distribuídos aleatoriamente em três grupos de 15 peixes / tanque (densidade baixa, LD) e 3 grupos de 25 peixes / tanque (alta densidade, HD) e alimentados com três diferentes tipos de alimentos: ração comercial para Sparidae, Alfa Biomar dieta (SP), ração comercial para S. dumerili (Skretting) (SE) e cavala congelada (MA). O estudo foi conduzido por 86 dias. As variáveis estudadas foram o tipo de regime alimentar e a densidade de produção.
A sobrevivência foi distinta e maior nos grupos alimentados com SE, enquanto que a Taxa de Crescimento Específico (SGR) não mostrou estatisticamente nenhuma diferença (P> 0,05) entre os grupos. Os grupos alimentados com a dieta MA tiveram os maiores valores de Ingestão Diária de Alimento (DFI), durante o estudo (9,59 ± 3,56 g / peixe em HD e 8,46 ± 5,00 g / peixe em LD), que embora com uma maior Taxa de Conversão de Alimento (FCR) (9,59% em LD e 8,46% em HD), aparentemente não conseguiram transformar eficientemente a ingestão em biomassa, demonstrado pelo respectivos valores de B% de 0,18% em LD e -0,35% em HD, sendo menor do que os grupos alimentados com SE a LD (0,41%).
No presente estudo, a composição bioquímica do S.dumerili foi semelhante à relatada em trabalhos anteriores. Quanto maior o teor de humidade, menor o teor de lípidos. Apesar de a dieta à base de MA ter um maior conteúdo de gordura em bruto (38,11%) que todas as outras dietas, os grupos alimentados com dieta MA, em ambas as densidades, apresentaram um menor valor total de lípido.
O Total de Lípidos Polares (TPL) e o Total de Lípidos Neutros (TNL) não mostraram quaisquer diferenças significativas (P <0.05) entre dietas em ambos os tecidos (P>0.05). Entre as classes de TNL, apesar de DAG, CHO e FFA terem sido significativamente diferentes (P <0.05), TAG foi a classe de lípido mais abundante, e onde nenhuma diferença significativa (P>0.05) entre os diferentes grupos foi encontrada.
Relativamente à composição de ácidos gordos, nomeadamente ao 18:1n-9, os grupos alimentados com MA foram os únicos significativamente diferentes (P<0.05), e obtiveram os
9
mais baixos valores (P<0.05), mesmo tendo em consideração que na natureza a dieta do S.
dumerili é composta principalmente por vários peixes ósseos ricos em 18:1n-9. Pode-se
deduzir que, ou houve uma degradação da qualidade do MA, enquanto armazenado para a respectiva alimentação dos grupos, que afectou directamente a qualidade e quantidade de 18:1n-9 acumulado nos seus tecidos.
O facto de os valores mais baixos de 18:2n-6 terem sido detectados nos grupos alimentados com MA, enquanto os valores mais elevados foram detectados nos grupos alimentados com SE (P<0.05), e tendo em conta o facto de o 18:2 n-6 ser o representativo mais elevado de n-6 nos ácidos gordos da dieta, que é o ácido gordo responsável pelas modificações mais prejudiciais para a composição de ácidos gordos em peixes de cultura, sugerem que este ácido gordo está em excesso na composição da dieta SE.
Os grupos alimentados com MA apresentaram as maiores quantidades de ARA (P<0.05) e os valores mais baixos de EPA (P<0.05), sendo que os grupos alimentados com SE apresentaram as menores quantidades de ARA e DHA (P<0.05). A menor quantidade de EPA e o menor ratio EPA/ARA (P<0.05) foram encontrados em grupos alimentados com MA. Devido à competição pelas mesmas enzimas para esterificar ácidos gordos em estruturas fosfolipídicas, entre EPA e DHA, a acumulação excessiva de EPA pode ser prejudicial, e terá provavelmente afectado a produção de DHA nos grupos alimentados com SE, que teve as mais baixas quantidades de ARA e DHA, o que deverá ter provocado uma maior ratio de EPA/ARA (P<0.05), sugerindo que o ratio entre eles está desequilibrado e existe demasiada acumulação de EPA, afectando a produção de ARA.
No presente estudo, apesar de o grupo alimentado com a MA a HD ter obtido a maior quantidade de DHA (P<0.05) no tecido do fígado, a relação DHA/ARA mesmo assim não apresentou diferenças significativas (P>0.05), indicando um equilíbrio estável entre as quantidades disponíveis de DHA e ARA nas dietas.
Este estudo sugere que o perfil de ácidos gordos dos diferentes grupos refletiu a composição de ácidos gordos das dietas, ou seja, as quantidades de 18:1n-9, 18:2-6 e 20:5n-3, 20:4n-6 e 22:6n-3 que têm efeitos nos ratios entre DHA, EPA e ARA, afectando o equilíbrio entre eles, o que afectou directamente o crescimento
No que diz respeito à análise de plasma sanguíneo, a proteína total foi o único parâmetro onde foram detectadas diferenças estatisticamente significativas (P<0.05) entre as dietas e densidades. O facto de os grupos alimentados com dieta SE e MA, mostrarem maior teor de proteína, pode estar relacionado com o facto de estas duas dietas terem níveis mais elevados de proteína (48 g / l e 51,25 g / l, respectivamente).
10
A partir dos resultados do presente estudo, podemos deduzir que a composição de ácidos gordos das rações afectaram o perfil lipídico do S.dumerili, assim como o desenvolvimento do mesmo, o que pede um melhor equilíbrio entre a ácidos gordos essenciais na composição da dieta, para garantir melhor eficiência energética e promover o crescimento.
Considerando os resultados obtidos relativamente aos grupos alimentados com SE, tudo indica que esta dieta parece ter sido a mais adequado para S.dumerili no presente estudo.
Palavras-chave: Crescimento, ácidos gordos essenciais, Seriola dumerili; densidade, DHA, ARA,
11
Abstract
This thesis intended to study the effect of three different types of food and two different densities, on growth, survival, plasmatic parameters and lipid composition of muscle and liver of Seriola dumerili (Risso 1810) juveniles, in order to select an optimal feeding regime for growth, covering the nutritional requirements, and optimizing the commercial cost-effectiveness of the production. Regarding this, a total of 145 juvenile of Seriola
dumerili with and average weight of 117.54 ± 54.98 g, were randomly distributed in 3 groups of 15 fish / tank (low stocking density LD) and 3 groups of 25 fish / tank (high stocking density HD) and fed with three different types of food: commercial pellets for Sparidae, the Alpha Biomar diet (SP), commercial pellets for S. dumerili (Skretting) (SE) and frozen Mackerel (MA). The study was conducted for 86 days. The study variables were the feeding regime and stocking density.
The survival rates were higher in the groups fed with SE, while the Specific Growth Rate (SGR) showed no statistical differences (P>0.05) between groups. The groups fed with MA diet had the higher amounts of Daily Food Ingested (DFI), (9.59±3.56 g/fish at HD and 8.46±5.00 g/fish at LD) during the study, although with a higher Food Conversion Rate (FCR), (9.59 % at LD and 8.46 % at HD), not efficiently turn that ingestion in biomass, as for example the value of B% at groups fed with MA at LD (0.18 %) and at HD (-0.35%) show, being lower than the groups fed with SE at LD (0.41%).
The biochemical composition of the fish in the present study was similar to the one reported in previous works, explaining that the more moisture content in the tissue, the less lipid it has in it.
The Total Polar Lipids (TPL) and Total Neutral Lipids (TNL) did not show any significant differences (P<0.05) between different diets in both tissues (p>0.05). Among the total neutral lipids (TNL), despite DAG, CHO and FFA were significantly different (P<0.05), TAG was the most abundant lipid class, which is generally the major lipid class in the diet of marine fish, and there was no significant differences (P<0.05) between the different groups.
Regarding fatty acid composition, namely 18:1n-9, the groups fed with MA were the only significantly different (P<0.05), and the lowest amounts in this study (P<0.05), even taking in consideration that, in the wild, the S. dumerili diet is composed mainly by several finfish rich in 18:1n-9. We can deduce that or there was a degradation of the quality of the
12
MA while stored to be fed to the groups, which affected directly the quality and quantity of the 18:1n-9.
The fact that 18:2n-6 had its lower amounts in groups fed with MA, and the higher amounts in groups fed with SE (P<0.05), and taking in account that 18:2n-6 is the higher representative of n-6 fatty acid in diets, that is the fatty acid responsible for the most detrimental modifications to the fatty acid composition of cultured fish, suggest that this fatty acid is in excess in SE diet composition.
The groups fed with MA presented the highest amounts of ARA (P<0.05) and the lower amounts of EPA (P<0.05), and the groups fed with SE presented the lower amounts of ARA and DHA (P<0.05). The lower amount of EPA and lower EPA/ARA ratio (P<0.05) found in groups fed with MA, could positively affect certain physiological functions. Due to the EPA and DHA competition for the same enzymes to esterify fatty acids into phospholipid structures, excessive accumulation of EPA could be prejudicial. In the groups fed with SE, the production of DHA was probably affected by it. The fact they had the lower amounts of ARA and DHA, inducing to a higher EPA/ARA ratio (P<0.05), suggests that the ratio is unbalanced and there is too much EPA accumulation, to insure ARA production
Even though the group fed with MA at HD had the higher amount of DHA in this study (P<0.05), still the ratio DHA/ARA had no significant differences (P<0.05), indicating a stable balance between DHA and ARA amounts.
This study suggests that the fatty acid profile of the different groups reflected the fatty acid composition of the diets, namely regarding 18:1n-9, 18:2n-6 and 20:5n-3, 20:4n-6 and 22:6n-3. that had effects in the ratios of DHA, EPA and ARA, affecting the balance between them, which had directly affected the growth.
Regarding the plasma analysis, total protein was the only displaying statistical differences between diets and densities, and the fact that the groups fed with SE and MA diet, showed higher protein content, could be related to the fact those diets have higher protein levels (48g/l and 51.25 g/l respectively).
From the present results it seems that the fatty acid composition of the pellets and frozen atlantic mackerel, affected the fatty lipid profile of S. dumerili, and so it development, so better balance between EFA diet composition while probably insure better energy efficiency and promoting growth.
Considering the results obtained with SE, it seems to be the most appropriated for S.
13
14
Table of Contents
Acknowledgements ... 4 Resumo ... 8 Abstract ... 11 Table of Contents ... 14 1. Introduction ... 151.1 Current State of World Fisheries and Aquaculture ... 16
1.2 Seriola dumerili ... 17
a. Biology, Ecology and Distribution of species ... 17
b. Growth ... 17
c. Reproduction ... 18
d. Food and Nutrition ... 19
e. Plasma biochemical parameters in culture fish ... 19
F. Nutritional requeriments for S. dumerili ... 20
2. Objectives ... 23 3. Methods ... 24 3.1. Experimental Conditions ... 24 3.2 Biochemical determinations ... 29 3.3 Data Analysis ... 30 4. Results ... 32
4.1. Growth and Survival ... 33
4.2. Biochemical Determinations ... 36
4.3. Fatty Acid Composition ... 39
4.4. Plasma Biochemical Parameters... 47
5. Discussion ... 48
6. Final Considerations ... 55
15
1. Introduction
16
1.1
Current State of World Fisheries and
Aquaculture
The global population is increasing and, in order to maintain at least the current level of per-capita consumption of aquatic foods, the world will require an additional 23 million tons by 2020 (FAO, 2012). According to FAO (2012), the fisheries and aquaculture sector supplied 148 million tons of fish in 2010, of which about 128 million tons was used as food for human consumption, and preliminary data for 2011 indicate an increased in production to 154 million tons, being China the main leading country owning to the substantial increase in its fish production, particularly from aquaculture, reach 31.9 kg per capita in 2009, due to a growing domestic income and an increase in the diversity of fish available. (FAO, 2012). World fish food supply increased from an average 9.9 kg per capita (live weight equivalent) in the 1960s to 18.4 kg in 2009.
Aquaculture production is vulnerable to adverse impacts of disease and environmental conditions. Disease outbreaks in recent years have affected farmed Atlantic salmon in Chile, oysters in Europe, resulting in partial or sometimes total loss of production. Most of the cases, as a consequence, production has contracted or stagnated in Japan, the United States of America, Spain, France, the United Kingdom of Great Britain and Northern Ireland, Canada and Italy. An exception is Norway, where, thanks to the farming of Atlantic salmon in marine cages, aquaculture production grew from 151 000 tonnes in 1990 to more than one million tonnes in 2010, at an average growth rate of 12.6 percent in the 1990s and 7.5 percent in the 2000s.
Aquaculture is evolving regarding to technological innovation and adaptation, in order to face the new world challenges. According to Cairo (2004) the introduction of a new species, must fulfill some criteria such like the high market price, high nutritional value and growth rate, tolerance to rearing densities and knowledge of their biological needs, in order to improve the production. The culture of new species could be one of the keys to the future development of this sector.
Still according to FAO (2012), in 2010, global production of farmed food fish was 59.9 million tons, up by 7.5% from 55.7 million tons in 2009 (excluding aquatic plants and non-food products). One-third of the global production was achieved without the use of feed, mainly through the production of bivalves and filter-feeding carps.
17
In the last three decades (1980-2010), world food fish production of aquaculture has expanded by almost 12 times, at an average annual rate of 8.8%, and its contribution to world total fish production raise from 20.9% in 1995 to 40.3% 2010. This means a contribution to world food fish production for human consumption of 47% in 2010 compared with only 9% in 1980, which is an amazing achievement. On the top of the 10th biggest producers in the world, China produced 36 million tons per year, representing 61.35% of total production. In Europe, Norway is leading the table with an annual production around 1 million tons, representing 39,95% of the total production, followed by Spain and France, being the 7th biggest producer in the World (FAO, 2012).
According to Portuguese National Statistical Institute fisheries report (2011), in Portugal, on the year of 2012 the production was 8013 tons, which means an increase of 0.2% since 2009, where sea bream, turbot and clam represent, the most produced species. With Norway leading the table, in 2 th place is Spain with a production of 253784 tons that is almost 32 fold the Portuguese production, (Eurostat, 2011) showing the huge gap between both countries, even tought Spain has more territory to production.
1.2 Seriola dumerili
a.
Biology, Ecology and Distribution of species
The Seriola gender is an highly active carnivore pelagic marine fish in Canary Islands in Spain, but also distributed worldwide in temperate and tropical water (Rodriguez-Barreto et al 2012). Seriola dumerili (Risso, 1810) is a teleostei perciforme fish, from the Carangidae family. The species is known to be an epibenthic and pelagic fish, surrounding reefs or offshore shallows, generally between 18 and 72 meters depth, but can occur at greater depths (Smith-Vaniz, 1986).
b.
Growth
According to Kozul et al (2001), wild individuals with one year old and having 32-45 cm in total length, triple its size at 4 years (93-106 cm) in nature. In culture conditions, a size of 35-45 cm at 1 year old and 85-95 cm at 4 years were reported by Garcia and Diaz, (1995). The pre-fattening and fattening of the juveniles in captivity, using commercial pellets for turbot, have shown some good results, such as an average weight of 453.5 g at 8 months of production, and average weights of 2.5 and 8.5 kg with 1, 2 and 3 years respectively. (Jerez et
18
al 2003). Overall, S. dumerili has shown a good adaptation to captivity, as well as high growth and survival rates fed on low value-fish or dry pellets (Jerez et al., 2003, 2006).
Stocking density (D) is a key factor in determining the productivity and profitability of commercial fish farms. It's also important to recognize that the welfare of farmed fish can represent the physical and health state of an animal in relation to its environment. Fish must be stocked at appropriated densities to their size, water temperature and flow, available oxygen, production cycle stage and fish holding unit type to minimize the risk of poor water quality, physical damage, stress and disease. Considering the previous, commercial farmers are using a combination of intuition and experience to decide which D (kg m-3) is more appropriate, when it comes to finding a balance between welfare and productivity (Ellis et al, 2002). The season is crucial on the amount of D. For example, during winter months, when the water temperature is lower, there will be higher dissolved oxygen. The correct D, will also depend on the correct water exchange rate and/or additional aeration (Buss et al, 1970).
c.
Reproduction
S. dumerili is a dioecious species; both sexes are separated, with a sex ratio of 1:1
(Lazzari and Barbera, 1989). The individuals can be sexual differentiated at 4 to 5 months old (Marino et al, 1995a), and sexually mature males and females are detected at the minimum standard length of 61 cm (24 months) and 80 cm (36 months), respectively. The spawning season takes place with the water temperature rise in spring, although its duration depends on the geographical area (Lazzari and Barbera, 1989). In captivity conditions, 4 to 5-year-old fish (80 cm length) display the start of vitellogenesis in December and the deposition of vitellogenin in May. Eggs are pelagic, have 1mm in diameter, and are fertilized by males in the water, known as broadcast spawners, being ovapartity reproducers. At 22ºC and after 48 hours, eggs originates larvae with 3mm in length. However, reproduction and spawning in captive conditions have been achieved in a spontaneous way (Jerez 2006). Due to the difficulties in reproduction of S. dumerili in captivity, in general commercial culture have been based to date, mainly, on the capture of fingerlings from the wild to be fattened until reaching marketable size. Successful maturation and spawning has been achieved more recently with the use of gonadotropin-releasing hormone agonist (GnRHa) loaded into IGled-release devices (Mylonas et al. 2004).
19
d.
Food and Nutrition
Due to its carnivorous nature, the first juvenile captured wild stocks were fed on raw frozen fish, such as Sardinella aurita. However, this type of feeding is not environmentally sustainable, much less in a more intensive industrial regime (Garcia, A. et al. 1995).
The greater amberjack fingerlings don't have the ability to shift from live prey, with high moisture content, to commercial dry diets (pellets) so easily, resulting in low growth rates during weaning (Masumoto 2002). Some studies, as Mazzola (2000), have shown that the greater amberjack is able to accept pellets, but when making a direct comparison of moist against extruded pellets, fish fed on dry pellets were found to display inferior growth results.
According to Garcia and Diaz (1995), the nutritional demand in terms of proteins, lipids, carbohydrates, vitamins, minerals and energy content of S. dumerili is currently unknown. Research is needed to determine a suitable and healthy type of food.
e.
Plasma biochemical parameters in culture fish
At the 70's, a metabolic profile was created to better understand the nutritional aspects and digestion of fish, making possible to see nutritional changes that were not possible to identify in any other way (Cappa, 1988), that made possible to avoid health problems and enhance a balance feeding scheme (Pavlidis et al., 1997), allowing a better production.
One of the the primary stress response in fish involves the release of catecholamines and activation of the hypothamalic-pituitary-interenal (HPI) axis (Ashley et al., 2007). HPI activation results in energy source mobilization, depletion of glycogen stores, and an increase in plasma levels of glucose, along with high muscle activity, anaerobic glycosis and an increase in plasma lactate. Therefore, the levels of both glucose and lactate in the plasma are often used alongside cortisol to assess stress levels. (Acerete, L. et al 2004). This is due to an increase of glucose concentration in the liver where the glycogen is quickly converted to glucose, increasing the glucose concentration, which is a result of energy demand that occurs under stress conditions (Barton and Iwama, 1991). These stress conditions are normally due to confinement conditions, namely density (Melotti et al., 2004), that could also promote a decline in plasma protein levels on teleosts (Jeney et al, 1997). On the other hand, the variation of plasma triglycerides and cholesterol concentration are more related to adequate food and changes of energy metabolism (Pfeffer, 1995).
Plasma analysis can also bring a lot of knowledge when it comes to nutrition. An incrising of plasma glucose concentration and low levels of triglycerides and cholesterol can
20
be related to an high concentration of carbohydrates in the diet (Montero et al., 1999), which is probably due to an unbalanced diet or of low quality food (Mazeaud et al. 1997). Diets with high concentration levels of lipids and carbohydrates promote fish growth, but also increase cholesterol concentration in plasma, that can influence the physiological status and immune system of fish (Torstensen et al. 2000).
f.
Nutritional requeriments for S. dumerili
Even tough successful maturation and spawning has been achieved more recently with the use of gonadotropin-releasing hormone agonist (GnRHa) loaded into IGled-release devices (Mylonas et al. 2004), the research group (IEO: Research Group of Aquaculture - Canary Islands Oceanographic Centre – Spanish Institute of Oceanography), has also obtained the natural spawning of this species without hormonal induction at its facilities (Jerez et al., 2006). This research at IEO began in 1996, by capture of wild juveniles that were kept in captivity, and after 6 years, the stock of broodstock spawned naturally in the spring-summer of 2002. The annually spawns obtained since then, have allowed the development of several studies concerning reproduction, larval culture and weaning, and growth performance of this species, as well as the formation of an important stock of potential captive bred broodstock.
The studies concerning nutritional requirements for S. dumerili are scarce, but there are several studies on the effect of different dietary formulations for other Seriola species, including Seriola quinquerradiata, Seriola lalandi and S. dumerili (Rodríguez-Barreto et al., 2012) and most of them related to the optimization of dietary protein inclusion rates, or substitution of fishmeal with other animal or plant protein sources.
According to Sargent (2002), highly unsaturated fatty acids (HUFA) revealed influence on growth, reproduction and egg quality, and among the components of a diet, lipids have an essential role on the fish’s nutrition. They are important to provide energy through oxidation of fatty acids, as on the synthesis of structural lipids, such as cholesterol and phospholipids, main components of the cell membranes, which regulate their fluidity and functions. (Sargent et al 2002).
The essential fatty acid (EFA) requirements of marine fish species have been extensively studied over the past 20 years and are known to vary both qualitatively and quantitatively, having a crucial role on the reproduction process, embryo ontogeny, vitellum composition and early stages of larval development (Sargent et al., 1989, 2002). The dietary essentiality of the n-3 highly unsaturated fatty acids (HUFA), docosahexaenoic acid (22:6n-3),
21
(DHA), and eicosapentaenoic acid (20:5n-3), (EPA), is of major importance for successful production of marine fish. Considering the higher biological value for DHA than EPA during first feeding of marine species such as red seabream and turbot (Watanabe et al., 1989) it is suggested that the n-3 HUFA requirements might not only be a function of the total amount of these fatty acids in the diet, but also of the relative proportions of DHA and EPA.
In marine fish, EPA and, especially, DHA are regarded as EFA due to their requirement for good growth and the inability of all marine fish studied to date being barely able to convert 18:3n-3 to EPA and DHA if at all (Sargent et al., 1989, 2002). EPA and DHA are the major HUFA in cell membranes, involved in maintaining their structure and function, although EPA is selectively catabolized with respect to DHA to provide energy during ovary maturation prior spawning (Tocher, 2003).
Also considered as an EFA, ARA has been largely neglected, and is in part due to the assumption that the ARA requirement would be very low and would be met by the small, but significant amount of ARA found in marine fish meals and oils. It is known that eicosanoids derived from ARA are physiologically active in fish, as series-2 prostaglandins derived from ARA have long been used to induce spawning in fish (Sargent et al., 1989, 1995), and have critical role in many areas of cellular signal transductions (Sargent et al., 1989).
These three EFA with their eicosanoids derivatives, have a wide range of functions in fish reproduction, i.e. EPA along with ARA, act as precursors in the formation of eicosanoids that act as autocrine hormones, regulating many physiological processes, such as osmoregulation, and immune and inflammatory response (Tocher, 2003); and DHA that specifically plays an important role in neural tissue membranes (brain and retina) in which reaches high concentrations.
Many of the difficulties in understanding essential fatty acid biochemistry and optimising the essential fatty acid content of the diet stems from competitive interactions between a different series of fatty acids, such as competitions between n-6 and n-3 polyunsaturated fatty acids (PUFA) and also monosaturated fatty acids; and between fatty acids of different chain lengths and degrees of unsaturation within a given series, such as competitions between EPA and DHA (Sargent et al., 1999). The DHA and EPA competition results from both molecules using the same enzyme to esterify fatty acids into phospholipid structures (Mourente et al., 1991; Sargent et al., 1999).
ARA and EPA compete for the same enzymatic complex to generate different series of prostanoids with different biological activities. These two EFA, ARA and EPA, compete for the cyclo-oxygenases and lipoxygenases that produce, respectively, 2-series prostanoids and
22
4-series leukotrienes from ARA, and 3-series prostanoids and 5-series leukotrienes from EPA (Sargent et al., 1999). The difference is that eicosanoids produced from ARA are generally more biologically active than those produced from EPA and both compete for the same cell membrane receptors. Considering this, it is essential for the a good development of the fish, that a adequate EPA/ARA ratio exists.
As mentioned before, the requirements of fish for their growth vary qualitatively and quantitatively. Considering that, in this study to better understand the Seriola dumerili needs, different diets were characterized to study the performance of those, in the growth and quality of the fish, in different densities.
23
2. Objectives
The aim of this study was to evaluate the effect of three different types of food (commercial pellets for Sparidae, SP, commercial pellets for S. dumerili, SE, and frozen Mackerel, MA) and two stocking densities on:
a) Growth and survival;
b) Lipid composition of muscle and liver focusing on the lipid classes and fatty acid composition
24
3. Methods
3.1. Experimental Conditions
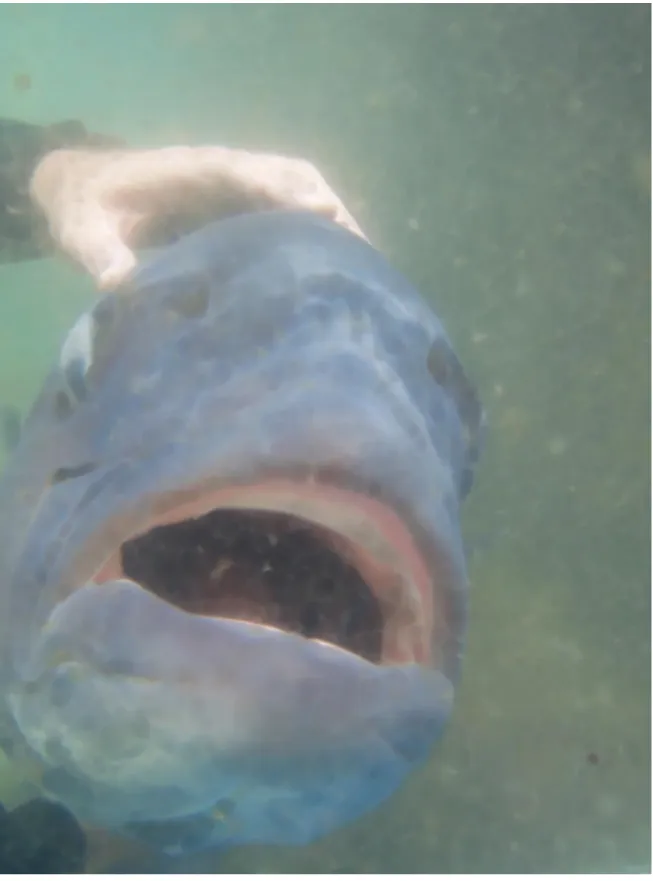
Figure 2 –S. dumerili adult in a culture tank, Spanish Institute of Oceanography
A total of 145 juveniles of S. dumerili bred and kept in captivity in the experimental facilities of the Spanish Institute of Oceanography (Tenerife, Canary Islands, Spain), with an average weight of 117.54 ± 54.98 g were used. Individuals were randomly distributed in 3 groups of 15 fish / tank (low stocking density LD) with 1900±74 g, and 3 groups of 25 fish / tank (high stocking density HD) with 2800±66 g. All fish were anaesthetized with clorobutanol (200 mg/l) prior to tagging with a Passive Integrated Transponder, commonly known as PIT tag . Fish were anaesthetized and individually tagged with PIT tags of 13,3 x 2,1 mm in size and 0,1 g in weight. PIT tagging was carried out with tags intramuscularly introduced using a sterile syringe. PIT codes were detected by an ISO MAX V portable reader (Datamars S.A., Lugano, Switzerland).
Each group of fish was stocked in a 1 m3 circle and balck indoor tank, in a closed system, with a continuos seawater input flow of 15 L/min to ensure an oxygen level close to saturation. Fish were reared under a natural photoperiod, water temperature of 21.70±0.86ºC and salinity of 37.5‰. As shown by Figure 3, three different types of food fish groups were established, itwo different stocking densities (High Density and Low Density): commercial pellets for Sparidae (Alpha Biomar - SP), commercial pellets for S. dumerili (Skretting - SE)
25
and frozen Atlantic mackerel Scomber sconbrus (MA). Fish were fed on a daily basis, twice a day, and at a 3% tank biomass. The Initial group (IG), the control diet for this study, was being fed by a pellet for sparidae, which is the same type of SP.
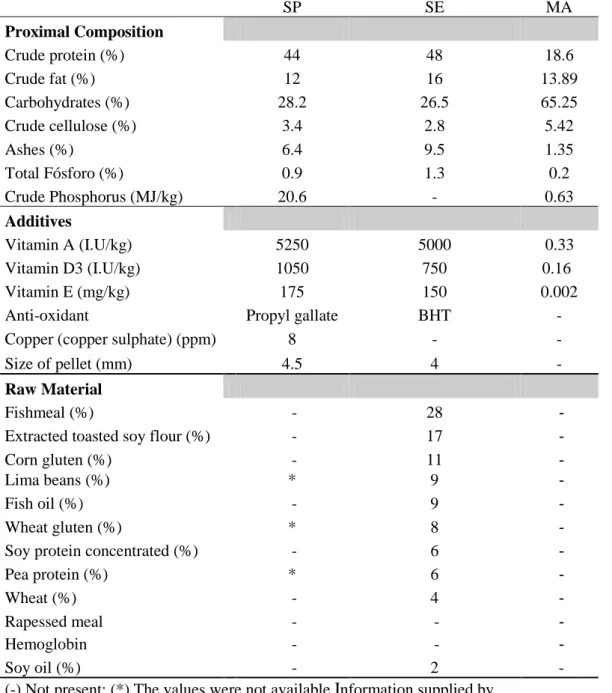
Table 1 and 2 show the proximate composition and fatty lipid profile of diets, respectively.
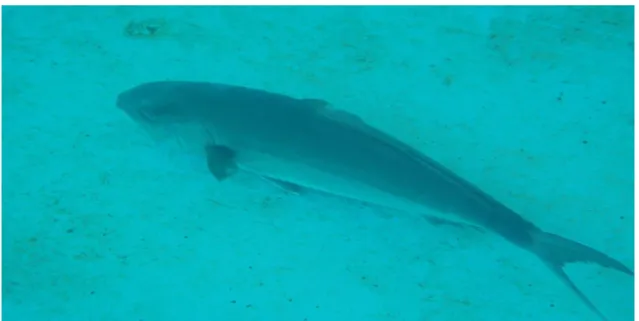
Figure 3 –S. dumerili adult in a culture tank, Spanish Institute of Oceanography
26
Table 1 – Proximate composition and raw materials of SP, SE and MA
SP SE MA Proximal Composition Crude protein (%) 44 48 18.6 Crude fat (%) 12 16 13.89 Carbohydrates (%) 28.2 26.5 65.25 Crude cellulose (%) 3.4 2.8 5.42 Ashes (%) 6.4 9.5 1.35 Total Fósforo (%) 0.9 1.3 0.2 Crude Phosphorus (MJ/kg) 20.6 - 0.63 Additives Vitamin A (I.U/kg) 5250 5000 0.33 Vitamin D3 (I.U/kg) 1050 750 0.16 Vitamin E (mg/kg) 175 150 0.002
Anti-oxidant Propyl gallate BHT - Copper (copper sulphate) (ppm) 8 - -
Size of pellet (mm) 4.5 4 -
Raw Material
Fishmeal (%) - 28 -
Extracted toasted soy flour (%) - 17 -
Corn gluten (%) - 11 -
Lima beans (%) * 9 -
Fish oil (%) - 9 -
Wheat gluten (%) * 8 -
Soy protein concentrated (%) - 6 -
Pea protein (%) * 6 -
Wheat (%) - 4 -
Rapessed meal - - -
Hemoglobin - - -
Soy oil (%) - 2 -
(-) Not present; (*) The values were not available.Information supplied by manufacter
27
Table 2 - Fatty acid composition of SP, SE and MA
Dry weight Pellet (%)
Alpha Biomar Skretting Mackerel
C 14: 0 9.07 ± 0.44 6.07 ± 0.13 2.10 ± 0.40 C 16: 0 27.84 ± 1.41 23.10 ± 0.31 27.70 ± 1.50 C 16: 1 n-7 8.46 ± 0.75 6.22 ± 0.19 4.30 ± 1.00 C 16: 1 n-5 1.01 ± 0.36 0.66 ± 0.05 0.00 ± 0.00 C 16: 2 n-4 0.72 ± 0.02 0.58 ± 0.02 0.00 ± 0..00 C 16: 3 n-4 0.70 ± 0.05 0.52 ± 0.02 0.00 ± 0.00 C 16: 4 n-1 0.97 ± 0.09 0.68 ± 0.09 0.00 ± 0.00 C 18: 0 5.47 ± 0.31 5.21 ± 0.06 6.70 ± 0.20 C 18: 1 n-9 13.81 ± 2.45 18.59 ± 0.91 12.20 ± 1.90 C 18: 1 n-7 6.19 ± 1.82 6.64 ± 0.96 4.20 ± 0.60 C 18: 2 n-6 7.46 ± 0.36 13.82 ± 0.51 2.10 ± 0.20 C 18: 3 n-3 0.76 ± 0.06 1.32 ± 0.08 0.68 ± 0.10 C 18: 4 n-3 0.99 ± 0.15 0.52 ± 0.04 0.00 ± 0.00 C 20: 0 0.33 ± 0.00 0.36 ± 0.01 0.00 ± 0.00 C 20: 1 n-9/n-7 0.65 ± 0.47 1.01 ± 0.39 1.80 ± 0.50 C 20: 4 n-6 0.38 ± 0.04 0.32 ± 0.02 2.80 ± 0.30 C 20: 5 n-3 5.03 ± 0.32 4.05 ± 0.24 5.90 ± 0.70 C 22:1 n-11/ n-9 1.48 ± 0.11 2.68 ± 0.05 0.00 ± 0.00 C 22: 5 n-3 0.49 ± 0.01 0.47 ± 0.01 1.00 ± 0.20 C 22: 6 n-3 2.44 ± 0.04 1.79 ± 0.10 25.30 ± 4.50 C 24: 1 n-9 0.36 ± 0.01 0.39 ± 0.01 0.00 ± 0.00 UK. 1.67 ± 0.54 2.47 ± 0.64 0.00 ± 0.00 SFA 44.49 ± 2.17 36.48 ± 0.55 37.20 ± 1.70 MUFA 32.99 ± 1.50 36.65 ± 0.12 63.50 ± 2.10 PUFA 20.86 ± 1.21 24.40 ± 1.31 0.00 ± 0.00 HUFA 8.80 ± 0.42 6.73 ± 0.52 0.00 ± 0.00 n-3 10.40 ± 0.62 8.26 ± 0.62 33.30 ± 4.70 n-6 7.83 ± 0.41 14.13 ± 0.53 5.70 ± 0.30 n-9 16.30 ± 1.14 22.67 ± 0.42 14.00 ± 0.90 n-3/n-6 1.33 ± 0.15 0.58 ± 0.06 5.84 ± 3.11 DHA/EPA 0.49 ± 0.20 0.44 ± 0.10 4.29 ± 2.69 EPA/ARA 13.24 ± 0.20 12.66 ± 0.16 2.11 ± 0.28 DHA/ARA 0.49 ± 0.00 0.44 ± 0.06 4.29 ± 2.97 Results are expressed as means ± SD. N = 2.
28
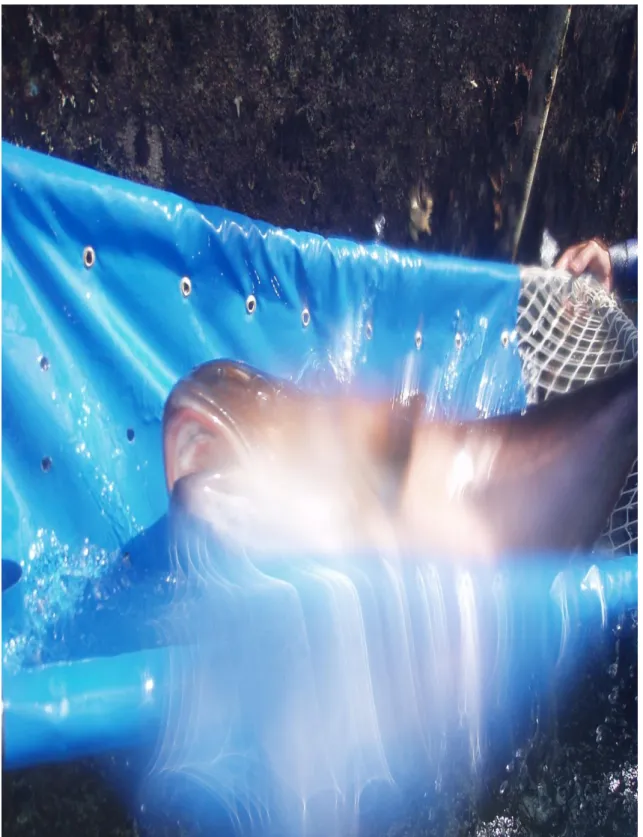
One hour after being provided, the non-ingested pellet and MA were periodically took, to determine the real ingestion, taking in consideration that the weight of the feed SE, after their stay in the tank, increased 1.5, while the weight of the feed SP multiplied by 2.5. The growth trial was conducted for 86 days, with individual monthly sampling of Weight and Length parameters. These sampling moments were made at the 1º, 36º , 71º and 86º day of the study. In the last day of experiment (86º day) the remaining fish were sacrified and muscle, liver and blood plasma samples were took from each of them.
Data and sample collection of weight and length, where used for calculate: – Mean Wet Weight (WW) (g)
– Initial (Bi) and Final (Bf) Biomass (g) – Mean Biomass Relative Index (B) (%)
𝐵% = 100 ×𝐵𝑓 − 𝐵𝑖 𝐵𝑖 × 𝑡 – Specific Growth Rate (%)
𝑆𝐺𝑅(% 𝐵𝑊𝑑𝑎𝑦−1) = 100 ×ln 𝐹𝑖𝑛𝑎𝑙 𝑊𝑒𝑖𝑔ℎ𝑡 (𝑔) − ln 𝐼𝑛𝑖𝑡𝑖𝑎𝑙 𝑊𝑒𝑖𝑔ℎ𝑡(𝑔)
𝑡𝑜𝑡𝑎𝑙 𝑛𝑢𝑚𝑏𝑒𝑟 𝑜𝑓 (𝑑𝑎𝑦𝑠) × 100 – Condition Factor (CF)
𝐶𝐹% = 𝑊𝑒𝑖𝑔ℎ𝑡(𝑔)
𝐿𝑒𝑛𝑔ℎ𝑡 (𝑐𝑚)3× 100
– Survival (S %) was determined taking out the dead individuals, daily, and make their identification.
– Daily Food Ingestion (DFI)
WTFS – Weight of total dry feed supplied
𝐷𝐹𝐼 = 𝑊𝑇𝐹𝑆 (𝐵𝑓+ 𝐵2 𝑖) × 𝑇
× 100 – Food Conversion Rate (%) (FCR)
𝐹𝐶𝑅 = 𝑊𝑇𝐹𝑆(𝑔) 𝐵𝑓(𝑔) − 𝐵𝑖(𝑔)
At the beginning of the experiment, a 7 fish representative samples were sacrificed. After 86 days, all the other live fish were sampled and sacrificed. For blood sampling, the fish was previously lightly anesthetized and blood was collected from the caudal vein with a
29
heparinised syringe. Blood samples obtained for each experimental diet were analyzed for various hematological and biochemical parameters. Blood was collected from the caudal vessels using heparinized needles. Fish were lightly anesthetized to avoid the stress inherent in the handling, which leads to changes in certain plasma parameters. Then at day 86º, after individually weighted, total length measured and weight from liver registered, fish were sacrificed by over-anesthesia to collect the samples of liver and muscle, which were frozen and stored at −80 °C. The dead fish were removed daily and PIT, length and weight were taken.
In liver and muscle samples, moisture, ash, total lipids, lipid classes and fatty acids composition were determined (Task 1.6.)
3.2
Biochemical determinations
Moisture content was determined in 300–500 mg samples by thermal drying of samples in an oven at 110 °C until constant weight, according to the Official Method of Analysis of the Association of Official Analytical Chemists (AOAC, 1990). Total protein content will be calculated on the basis of the total nitrogen content of the sample following a modification of the original method of Kjeldahl (AOAC 2006).
Total lipid (TL) was extracted from the tissues and diet by homogenization in chloroform/methanol (2:1, v/v) according to the method of Folch et al.(1957). The organic solvent was evaporated under a stream of nitrogen and the lipid content was determined gravimetrically (Christie, 1982) and stored in chloroform/methanol (2:1), containing 0.01% butylated hydroxytoluene (BHT) as antioxidant, under a N2 atmosphere at -20 ºC. Diets were pre-hydrated overnight with 0.5 mL of distilled water per 100 mg of sample before lipid extraction.
Analysis of lipid class (LC) composition was performed by one-dimensional double development high-performance thin layer chromatography (HPTLC; 10 × 10 cm, Ø 0.15 mm) using methyl acetate/isopropanol/chloroform/methanol/0.25% (w/v) Kcl (5 : 5 : 5 : 2 : 1.8 / volume) as developing solvent system for the polar lipid classes (half plate), and isohexane/diethyl ether/acetic acid (22.5 : 2.5 : 0.25 / volume), as the developing solvent system for the neutral lipid separation (full development). Lipid classes were visualized by charring at 160 °C for 15 min after spraying with 3% (w/v) aqueous cupric acetate containing 8% (v/v) phosphoric acid, and quantified by scanning densitometry using a dual-wavelength
30
flying spot scanner Shimadzu CS-9001PC (Shimadzu, Duisburg, Germany) and individual lipid classes were confirmed by comparison to a well-characterized cod roe sample. (Olsen & Henderson 1989)
To determine the fatty acid profiles, TL extracts were subjected to acid-catalyzed transmethylation for 16 h at 50 °C, using 1 mL of toluene and 2 mL of 1% sulphuric acid (v/v) in methanol. The resultant fatty acid methyl esters (FAME) were purified by thin layer chromatography (TLC) and determined in reference to a standard visualized under spraying with 1% iodine in chloroform (Christie, 1982). During acid-catalyzed transmethylation, FAME is formed simultaneously with dimethyl acetals (DMA) which originate from the 1-alkenyl chain of plasmalogens. FAME and DMA were separated and quantified using a thermo scientific trace gc ultra gas chromatograph (GC) equipped with a flame ionization detector (250ºC) and a fused silica capillary column SupelcowaxTM 10 (30m x 0.32 mm I.D.). Helium was used as a carrier gas. The oven initial temperature was 180ºC for 10 min, followed by an increase at a rate of 2.5ºC/min to a final temperature of 215ºC. Individual FAME and DMA were identified by reference to authentic standards (PUFA nº 3) supplied by SUPELCO (Supelco PARK, Bellefonte, PA, USA) and to a well characterized fish oil. Prior to transmethylation, nonadecanoic acid (19:0) was added to the total lipid extract as an internal standard.
Plasma samples were separated after centrifugation at 700 g for 15 minutes at 4ºC and stored at -80°C until analysis. Plasma levels of triglycerides, cholesterol, plasma protein, glucose and lipase were measured by standard spectrophotometric assays using kits to determine the amounts.
3.3
Data Analysis
Data of growth, wet weight, survival, biomass, proximate biochemical, lipid classes and fatty acids contents were statistical analysed by SPSS package (version 20.0 for Windows) and results are reported as means ± SD (n=3). Non-detected fatty acids were considered as null for statistical analysis. Normal distribution was checked for all data with the one-sample Kolmogorov-Smirnoff test and homogeneity of the variances with the Levene test. When normal distribution of data failed or the data were expressed in percentage, arcsine square root transformation of data was performed. Data were submitted to one-way analysis of variance (ANOVA), and when normal distribution and/or homogeneity of the variances were not
31
achieved after transformation robust tests (Kruskal-Wallis) where done, followed by Tukey’s post hoc test to test differences between different groups. In all statistical tests used, P<0.05 was considered significantly different (Pestana, D., Velosa, S. 2008).
32
4. Results
33
4.1.
Growth and Survival
The initial and final biomass of fish, did not show any significant difference (p>0.05) between the different diets, however with a weight dispersal, because of the big SD’s displayed. Related to B%, fish fed with MA at LD (0.18 %) and SE at LD (0.41%) had the only positive B%, with this last one being the highest. Between the positive values, fish fed with MA at LD had the lowest amount of B% (0.18 %).
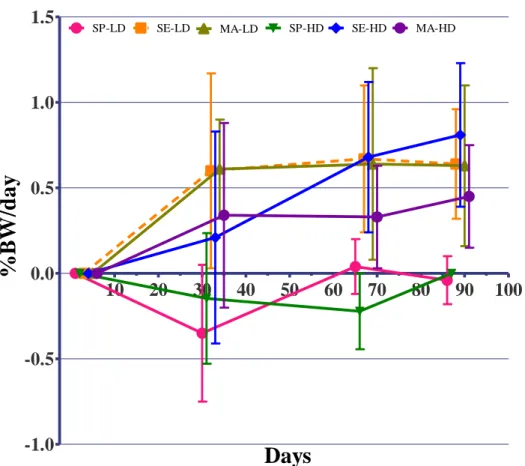
SGR showed significant differences (P<0.05) between group fed with SP at HD(0.0±0.1) and all the remaining groups, except for group fed with MA at HD (0.45±0.28) (Table 3). In one hand there was a tendency of stabilization of SGR between groups fed with SE at LD and MA at LD, while in the other hand, the same groups, but in HD, displayed an apposite tendency to increase their SGR through time, as displayed in Figure 6. The group fed with SP at HD was distinctively lower as displayed in Figure 6.
The Table 3 showed, concerning to CF, significant differences (P<0.05) between the group fed with MA at HD (2.25±0.19), which displayed one of the highest CF, and the group fed with SP at LD (1.62±0.11) and SE at LD (1.92±0.15). During the study, the fishes, as Figure 5 displayed showed less variation in CF, in the group fed with SE at LD.
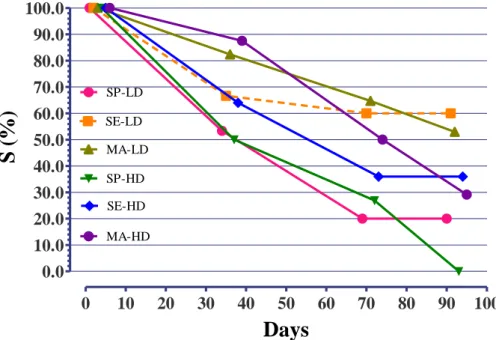
Survival’s highest value at the end of the study was showed by fish fed with SE at LD (60%; Table 3), even with the declive displayed in the Figure 4, in the first stage (0-34 fish), manage to stabilize until the end of the study. Fish fed with SP at LD had the lowest survival rate (20%;P<0.05). Fish, as displayed in Figure 7, showed a tendency for better survival rates at LD density as showed by group fed with SE (60%) and MA (53%) (P<0.05).
The highest FCR was presented by fish fed with MA at LD (6,01%) and HD (4,42%) and at SP at LD (4,54%). Considerably lower FCR were the fish fed with SE at LD (2,1%) and HD (1,46%) which displayed the lowest value.
As displayed at Table 3, fish fed on MA at LD presented the highest daily food ingestion, with 9.59±3.56 g/fish, and at HD 8.46±5.00 g/fish, followed by SE at LD 3.73±2.18 g/fish and at HD 3.42±2.27 g/fish, and as the lowest daily digestion, SP at LD 2.61±3.43 g/fish.
34
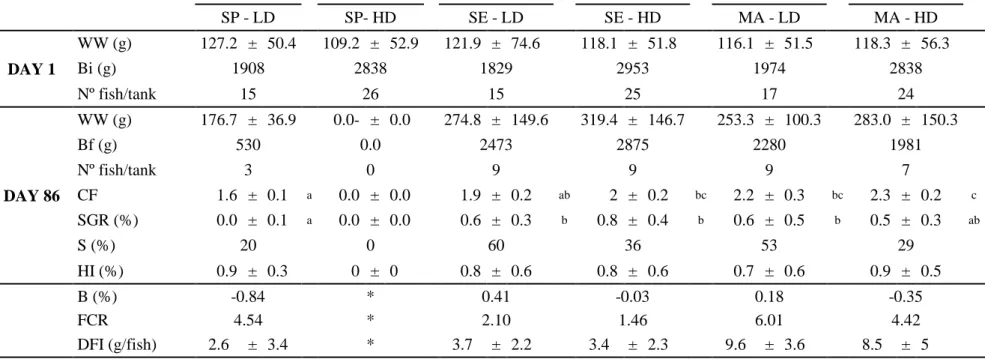
Table 3 - Biometric parameters, B%, FCR, DFI and survival obtain between the distinct periods of the study (1 and 86 days)
SP - LD SP- HD SE - LD SE - HD MA - LD MA - HD DAY 1 WW (g) 127.2 ± 50.4 109.2 ± 52.9 121.9 ± 74.6 118.1 ± 51.8 116.1 ± 51.5 118.3 ± 56.3 Bi (g) 1908 2838 1829 2953 1974 2838 Nº fish/tank 15 26 15 25 17 24 DAY 86 WW (g) 176.7 ± 36.9 0.0- ± 0.0 274.8 ± 149.6 319.4 ± 146.7 253.3 ± 100.3 283.0 ± 150.3 Bf (g) 530 0.0 2473 2875 2280 1981 Nº fish/tank 3 0 9 9 9 7 CF 1.6 ± 0.1 a 0.0 ± 0.0 1.9 ± 0.2 ab 2 ± 0.2 bc 2.2 ± 0.3 bc 2.3 ± 0.2 c SGR (%) 0.0 ± 0.1 a 0.0 ± 0.0 0.6 ± 0.3 b 0.8 ± 0.4 b 0.6 ± 0.5 b 0.5 ± 0.3 ab S (%) 20 0 60 36 53 29 HI (%) 0.9 ± 0.3 0 ± 0 0.8 ± 0.6 0.8 ± 0.6 0.7 ± 0.6 0.9 ± 0.5 B (%) -0.84 * 0.41 -0.03 0.18 -0.35 FCR 4.54 * 2.10 1.46 6.01 4.42 DFI (g/fish) 2.6 ± 3.4 * 3.7 ± 2.2 3.4 ± 2.3 9.6 ± 3.6 8.5 ± 5 Results are expressed as means ± SD; Different letters in superscript within the same row represent significant differences (P<0.05); Capital letters in the right column of data represent – a– statistical different from Alpha Biomar (P<0.05); b– statistical different from Skreting (P<0.05); c– statistical different from Mackerel (P<0.05); Nº- number of fish; CF - Condition Factor; SGR - Specic Growth Rate ( percentage of body weight increase per unit time); S - Survival; HI - Hepatossomatic Index; B – Mean Biomass Relative Index ; FCR- Food Conversion Rate; DFI - Daily Food Ingest (g/fish) (*) There was no available data to perform calculatations
35 0 10 20 30 40 50 60 70 80 90 1.0 1.5 2.0 2.5
SP-LD SE-LD MA-LD SE-HD MA-HD
Days
CF
Figure 5 – Evolution of CF of the different groups during experimental period;
10 20 30 40 50 60 70 80 90 100 -1.0 -0.5 0.0 0.5 1.0 1.5
SP-LD SE-LD MA-LD SP-HD SE-HD MA-HD
Days
%
BW
/d
a
y
36 0 10 20 30 40 50 60 70 80 90 100 0.0 10.0 20.0 30.0 40.0 50.0 60.0 70.0 80.0 90.0 100.0 SP-LD SE-LD MA-LD SP-HD SE-HD MA-HD
Days
S
(
%
)
Figure 7 – Evolution of S (%) of the different groups during experimental period
4.2.
Biochemical Determinations
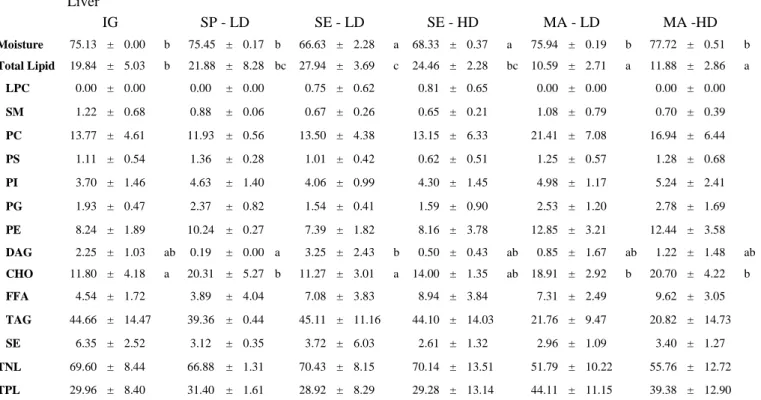
The moisture content, total lipid and lipid classes of muscle and liver from S. dumerili fed with different diets are shown in Tables 4 and 5, respectively.
Moisture showed significant differences (P<0.05) between groups fed with SE and from all remaining groups in muscle and liver. In addition fish fed with SE presented the lowest content of moisture in muscle at LD (67.86±0.39 %) and at HD (68.93±0.41 %), and in liver (66.63±2.28 %) at LD and at HD (68.33±0.37) (P<0.05).
Total lipid also showed significant differences (P<0.05) between groups fed with SE and all remaining groups in muscle (Table 4), with the fish fed with SE, at either LD (20.49±6.37 %) or HD (18.37±5.34 %), showing an almost fourfold lipid content (P<0.05), when compared with others. while groups fed with MA, at LD (10.59±2.71 %) and HD (11.88±2.86 %), which displayed the lowest content, were significant different (P<0.05) from all remaining groups in liver (Table 5). Also in liver, fish fed with SE at LD displayed a higher lipid content (27.94±3.69 %; P<0.05) than IG (19.84±5.03 %).
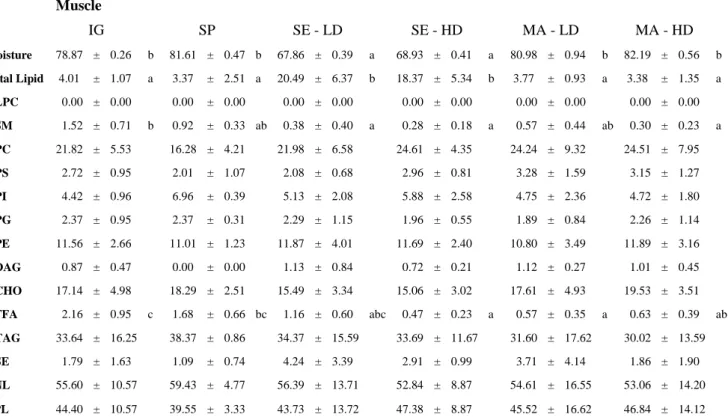
In muscle tissue (Table 4), IG presented the highest percentage of SM (1.52±0.71 %) which was significantly different (P<0.05) from all the remaining groups, except for fish fed with MA at LD and SP at LD.
37
Table 4 – Muscle tissue moisture, total lipid and lipid classes of S. dumerili fed with three different diets under two different stocking densities, and IG (%)
Muscle IG SP SE - LD SE - HD MA - LD MA - HD Moisture 78.87 ± 0.26 b 81.61 ± 0.47 b 67.86 ± 0.39 a 68.93 ± 0.41 a 80.98 ± 0.94 b 82.19 ± 0.56 b Total Lipid 4.01 ± 1.07 a 3.37 ± 2.51 a 20.49 ± 6.37 b 18.37 ± 5.34 b 3.77 ± 0.93 a 3.38 ± 1.35 a LPC 0.00 ± 0.00 0.00 ± 0.00 0.00 ± 0.00 0.00 ± 0.00 0.00 ± 0.00 0.00 ± 0.00 SM 1.52 ± 0.71 b 0.92 ± 0.33 ab 0.38 ± 0.40 a 0.28 ± 0.18 a 0.57 ± 0.44 ab 0.30 ± 0.23 a PC 21.82 ± 5.53 16.28 ± 4.21 21.98 ± 6.58 24.61 ± 4.35 24.24 ± 9.32 24.51 ± 7.95 PS 2.72 ± 0.95 2.01 ± 1.07 2.08 ± 0.68 2.96 ± 0.81 3.28 ± 1.59 3.15 ± 1.27 PI 4.42 ± 0.96 6.96 ± 0.39 5.13 ± 2.08 5.88 ± 2.58 4.75 ± 2.36 4.72 ± 1.80 PG 2.37 ± 0.95 2.37 ± 0.31 2.29 ± 1.15 1.96 ± 0.55 1.89 ± 0.84 2.26 ± 1.14 PE 11.56 ± 2.66 11.01 ± 1.23 11.87 ± 4.01 11.69 ± 2.40 10.80 ± 3.49 11.89 ± 3.16 DAG 0.87 ± 0.47 0.00 ± 0.00 1.13 ± 0.84 0.72 ± 0.21 1.12 ± 0.27 1.01 ± 0.45 CHO 17.14 ± 4.98 18.29 ± 2.51 15.49 ± 3.34 15.06 ± 3.02 17.61 ± 4.93 19.53 ± 3.51 FFA 2.16 ± 0.95 c 1.68 ± 0.66 bc 1.16 ± 0.60 abc 0.47 ± 0.23 a 0.57 ± 0.35 a 0.63 ± 0.39 ab TAG 33.64 ± 16.25 38.37 ± 0.86 34.37 ± 15.59 33.69 ± 11.67 31.60 ± 17.62 30.02 ± 13.59 SE 1.79 ± 1.63 1.09 ± 0.74 4.24 ± 3.39 2.91 ± 0.99 3.71 ± 4.14 1.86 ± 1.90 TNL 55.60 ± 10.57 59.43 ± 4.77 56.39 ± 13.71 52.84 ± 8.87 54.61 ± 16.55 53.06 ± 14.20 TPL 44.40 ± 10.57 39.55 ± 3.33 43.73 ± 13.72 47.38 ± 8.87 45.52 ± 16.62 46.84 ± 14.12 Results are expressed as means ± SD; Different letters in superscript within the same row represent significant differences (P<0.05); Capital letters in the right column of data represent – a – statistical different from Alpha Biomar (P<0.05); b – statistical different from Skreting (P<0.05); c – statistical different from Mackerel (P<0.05); LPC - Lysohposphatidylcholine; SM - Sphingomyelin; PC -Phosphatidylcholine; PS - Phosphatidylserine; PI - Phosphatidylinositol; PG - Phosphatodylglycerol; PE - Phosphatidylethanolamine; DAG - Diacylglycerol; CHO - Cholesterol; FFA - Free Fatty Acid;
38
Table 5 – Liver tissue moisture, total lipid and lipid classes of S. dumerili fed with three different diets under two different stocking densities, and IG (%)
Liver IG SP - LD SE - LD SE - HD MA - LD MA -HD Moisture 75.13 ± 0.00 b 75.45 ± 0.17 b 66.63 ± 2.28 a 68.33 ± 0.37 a 75.94 ± 0.19 b 77.72 ± 0.51 b Total Lipid 19.84 ± 5.03 b 21.88 ± 8.28 bc 27.94 ± 3.69 c 24.46 ± 2.28 bc 10.59 ± 2.71 a 11.88 ± 2.86 a LPC 0.00 ± 0.00 0.00 ± 0.00 0.75 ± 0.62 0.81 ± 0.65 0.00 ± 0.00 0.00 ± 0.00 SM 1.22 ± 0.68 0.88 ± 0.06 0.67 ± 0.26 0.65 ± 0.21 1.08 ± 0.79 0.70 ± 0.39 PC 13.77 ± 4.61 11.93 ± 0.56 13.50 ± 4.38 13.15 ± 6.33 21.41 ± 7.08 16.94 ± 6.44 PS 1.11 ± 0.54 1.36 ± 0.28 1.01 ± 0.42 0.62 ± 0.51 1.25 ± 0.57 1.28 ± 0.68 PI 3.70 ± 1.46 4.63 ± 1.40 4.06 ± 0.99 4.30 ± 1.45 4.98 ± 1.17 5.24 ± 2.41 PG 1.93 ± 0.47 2.37 ± 0.82 1.54 ± 0.41 1.59 ± 0.90 2.53 ± 1.20 2.78 ± 1.69 PE 8.24 ± 1.89 10.24 ± 0.27 7.39 ± 1.82 8.16 ± 3.78 12.85 ± 3.21 12.44 ± 3.58 DAG 2.25 ± 1.03 ab 0.19 ± 0.00 a 3.25 ± 2.43 b 0.50 ± 0.43 ab 0.85 ± 1.67 ab 1.22 ± 1.48 ab CHO 11.80 ± 4.18 a 20.31 ± 5.27 b 11.27 ± 3.01 a 14.00 ± 1.35 ab 18.91 ± 2.92 b 20.70 ± 4.22 b FFA 4.54 ± 1.72 3.89 ± 4.04 7.08 ± 3.83 8.94 ± 3.84 7.31 ± 2.49 9.62 ± 3.05 TAG 44.66 ± 14.47 39.36 ± 0.44 45.11 ± 11.16 44.10 ± 14.03 21.76 ± 9.47 20.82 ± 14.73 SE 6.35 ± 2.52 3.12 ± 0.35 3.72 ± 6.03 2.61 ± 1.32 2.96 ± 1.09 3.40 ± 1.27 TNL 69.60 ± 8.44 66.88 ± 1.31 70.43 ± 8.15 70.14 ± 13.51 51.79 ± 10.22 55.76 ± 12.72 TPL 29.96 ± 8.40 31.40 ± 1.61 28.92 ± 8.29 29.28 ± 13.14 44.11 ± 11.15 39.38 ± 12.90 Results are expressed as means ± SD; Different letters in superscript within the same row represent significant differences (P<0.05); Capital letters in the right column of data represent – a – statistical different from Alpha Biomar (P<0.05); b – statistical different from Skreting (P<0.05); c – statistical different from Mackerel (P<0.05); LPC - Lysohposphatidylcholine; SM - Sphingomyelin; PC -Phosphatidylcholine; PS - Phosphatidylserine; PI -
Phosphatidylinositol; PG - Phosphatodylglycerol; PE - Phosphatidylethanolamine; DAG - Diacylglycerol; CHO - Cholesterol; FFA - Free Fatty Acid; TAG - Triacylglycerol; SE - Sterol Ester; TNL - Total Neutral Lipid;TPL - Total Polar Lipid.
39
DAG showed significant differences (P<0.05) only in liver (Table 5), where the fish fed with SP at LD (0.19±0.00 %) was significantly different (P<0.05) from group fed with SE at LD (3.25±2.43 %). CHO only showed significant differences (P<0.05) in liver, where the IG group (11.80±4.18 %), and fish fed with SE diet at LD (11.27±3.01 %), were significantly different (P<0.05) from the groups fed with SP diet, SE diet at HD and MA, which presented the higher amounts.
FFA showed significant differences (P<0.05) only in muscle (Table 4) where the IG group presented the highest amount (2.16±0.95 %) and was significantly different (P<0.05) showing an almost threefold FFA amount from the remaining diets, except for the group fed with SP at LD.
TAG showed no significant differences (P<0.05) and was the lipid class that presented the highest percentage from all lipid classes percentages in this study in both tissues (Tables 4 and 5).
The TPL and TNL did not showed any significant differences (P<0.05) between different diets in both tissues (p>0.05), being TNL content higher than the TPL in all groups, in both tissues, and higher in liver than in the muscle. ( Tables 4 and 5)
4.3.
Fatty Acid Composition
The fatty acid composition of TL from muscle and liver of different groups is shown in Tables 6 and 7. Statistical analyses revealed important differences between fish fed with different types of food (P<0.05) but no difference between groups with different stocking density were detected (P>0.05). The fatty acids showing the highest content in both tissues were C16:0, C18:0, 18:1n-9, 18:2n-6, 20:5n-3 and 22:6n-3.
The fatty acid composition of tissues clearly reflected the composition of the diet supplied. The groups fed with MA presented the highest proportion of docosahexaenoic acid (DHA), arachidonic acid (ARA) and the lower amounts of eicosapentaenoic acid (EPA). In contrast, fish fed with SE presented the lower amounts of ARA and DHA and higher content in 18:2n-6 specifically in the liver. In consequence, fish fed with MA presented a higher DHA/EPA ratio and a lower EPA/AA ratio in both tissues while the opposite was observed in group SE. C16:0 content displayed significant differences (P<0.05) only in liver (Table 7), where MA groups at both LD and HD presented the lowest amounts (18.44±1.07
40
17.80±1.22 %; respectively; P<0.05), and were significantly different from all remaining groups except SP at LD group. The C16:1n-7 also only showed slight significant differences (P<0.05) in the liver tissue (Table 7)
The C18:0 showed significant differences (P<0.05) in both tissues (Table 6 and 7). In muscle, fish fed with MA at HD (8.77±0.49 %) was significantly different (P<0.05) from group SP at LD and IG. In liver the group fed with MA at HD (6.95±1.23 %) and LD (6.64±1.08 %) was significantly different (P<0.05) from fish fed with SP again and SE at LD.