Article
Printed in Brazil - ©2018 Sociedade Brasileira de Química*e-mail: marianavieira@pq.cnpq.br
Evaluation of the Concentration of Cu, Zn, Pb and Cr in Different Fish Species
from the São Gonçalo Channel in Pelotas-RS, Brazil
Marcelo M. Alves,a,b Aline L. Medina,a Ane Martiele T. Pinto,a Ana Clara N. Antunes,a
Pedro José Sanches Filho,b Anderson S. Ribeiroa and Mariana A. Vieira*,a
aPrograma de Pós-Graduação em Química, Laboratório de Metrologia Química (LabMeQui),
Universidade Federal de Pelotas (UFPel), 96010-900 Capão do Leão-RS, Brazil
bGrupo de Pesquisa em Contaminantes Ambientais (GPCA), Instituto Federal Sul-Rio-Grandense,
96015-560 Pelotas-RS, Brazil
The objective of this study was to evaluate the concentration of Cu, Zn, Cr and Pb in different species of fish collected in the estuarine and limnic regions of the São Gonçalo channel, located in the Patos-Mirim lagoon complex in the coastal plain of Rio Grande do Sul State (Southern Brazil) during 2013 (autumn, winter and spring) and 2014 (summer). Fish samples were decomposed in a digester block with a reflux system under conditions optimized using a central composite design as it follows: 250 mg of fish sample, 5 mL HNO3, 2 mL H2O2 during 2 h at 150 °C. The
concentrations obtained ranged from 6.7 to 12.0 mg kg-1 for Cu; 1.8 to 23.6 mg kg-1 for Zn; 37 to
487 µg kg-1 for Pb; and 40 to 1268 µg kg-1 for Cr. The highest concentrations of Cu, Zn and Pb,
were observed in fishes collected at locations in the estuarine region and Cr showed high levels, especially in the limnic region. The samples of the species Loricariichthys anus (viola) showed the highest concentrations of all analytes investigated.
Keywords: fish tissues, acid decomposition, atomic spectrometry, toxic metals
Introduction
Fish are one of the most important sources of protein for humans. Fish consumption has been increasing because they are a source of omega-3 fatty acids that reduce the risk of developing several diseases. However, fishes are vulnerable to the pollution of lake ecosystems mainly by the presence of toxic metals.1-3
Intense activity in the industrial and agricultural sectors has inevitably produced an increase in the concentration levels of toxic metals in natural water systems.4 Thus,
aquatic environments are often the ultimate collectors of pollutants and facilitate the mobility of these substances, causing a significant increase in the interactions between these environmental parameters and organisms. Depending on the species of fish in an ecosystem, the route of capitation of metals varies between water and diet.5 Toxic metals tend to
accumulate in advanced organisms through biomagnification in food chain effects. Thus, they can enter the human body, accumulate in various tissues, and generate chronic toxicity.6
Estuarine regions are characterized by variations in salinity, and high concentration of nutrients and sludge, allowing the development of species adapted to the peculiarities of the ecosystem. On the Brazilian coast, estuarine regions are widely used by fishing communities. Disordered urban occupation and strong environmental impacts linked to the development of industrial and human activities on the shores of estuaries poses a threat to these environments. Also, the high load of pollutants disposed of in estuaries and their environs have been decreasing fish stocks, having negative effects on the living conditions of coastal communities.7
fishing. It also contributes to the irrigation of rice crops and local navigation.8
The channel became the main destination of three streams that supply the city of Pelotas, besides the Piratini River. These streams cross populated urban areas occupied by residential properties, with commercial, industrial and agricultural activities that contribute contaminants to the water. In 1977, a sliding gate was built on the channel in order to prevent inflow of salt water from the Patos Lagoon estuary into the Mirim Lagoon. Previous studies have shown that this considerably altered the habitat and distribution of different species of fish, and interrupted connections between adjacent aquatic systems.8 For example, estuarine
fish such as Micropogonias furnieri (corvina) that previously inhabited the Mirim Lagoon now remain in the marine portion. Within the Patos-Mirim lagoon complex, the São Gonçalo channel is the region with the greatest abundance and richness of fish species (approximately 43 species). The main species of fish found are: Micropogonias furnieri (corvina), Pimelodus clarias (pintado), Cyphocharax voga (biru) and Loricaariichthys anus (viola) that are widely marketed by many fishermen who fish in the region for their livelihoods. In this context, it is very important to evaluate the metal content (toxic or non-toxic) in these animals that also serve as biomarkers of the environmental condition of the water resources.8
Metals such as Cu and Zn are considered essential micronutrients for a variety of enzymes and other cellular components that have vital functions. As such, they are carefully regulated by physiological mechanisms in most organisms. However, they are also considered to be potentially dangerous, since they may be a risk for human and animal health. The knowledge of their concentration in fish is important in the management of fish consumption.9
Excessive intake of Zn may cause several health problems such as poisoning, nausea, severe stomach pain, diarrhea, and fever, among others.6 Excessive levels of Cu may cause
allergies and irritation to the eyes, nose and mouth, as well as nausea and diarrhea. Symptoms may worsen if ingestion is via water and food, damaging the liver and kidneys and, in extreme cases, leading to death.10
Metals such as Pb and Cr, which are toxic, should not be present in foods intended for human consumption. Lead may cause kidney failure, liver damage, anemia, gastrointestinal and colonic disorders and damage to the central nervous system.3,11,12 When Cr is present in a hexavalent oxidation
state and at high levels of concentration, it may cause damage to the respiratory tract, stomach, and intestines. It may also cause anemia and in some cases lead to cancer.10
The quantification of metals in fish tissue is usually carried out by atomic spectrometry techniques, such as flame
atomic absorption spectrometry (F AAS);4,9,13-16 graphite
furnace atomic spectrometry (GF AAS);1,9,14,17-22 inductively
coupled plasma mass spectrometry (ICP-MS);6,23-28
inductively coupled plasma optical emission spectrometry (ICP OES)6,23,29,30 or cold vapor atomic absorption
spectrometry (CV AAS).1,11,16 In general, for the determination
of metals such as Cu, Zn, Pb and Cr in fish tissue samples using atomic spectrometry techniques, the sample must be in acid solution. The use of acid decomposition in open systems using digestion blocks;15-18,29 in closed systems
using the microwave oven1,4,6,9,11,13,23,25,27,31 or by dry ashing22
are widely used for this purpose. However, some of these systems present risk of contamination and analyte losses through volatilization or adsorption when open flasks are used. Additionally, a reposition of acid is required due to dryness during the heating. Also, the microwave equipment has a high cost for most research laboratories and routine.
Analytical chemistry is continually introducing new sample decomposition strategies for element determination (volatile or not) in a variety of matrices. In their review, Ferreira et al.32 highlights the use of the reflux system for
decomposing samples, especially for the determination of volatile elements. Losses by volatilization are avoided due the condensation of the volatile species under the reflux system formed by the cold finger. The cold finger is inserted into a digestion vessel for sample preparation, using an open system with conventional heating. Our research group has applied a new design of cold finger for sample preparation with a reflux system, which has demonstrated a high efficiency in decomposing different samples, as can be observed in the published papers on the determination of Hg in biological samples;33 Cd, Pb and Sn in meat;34 Ca,
Cu, Fe, K and Na in milk powder;35 As, Cd, Pb, and Se in
rice36 and Al, Ca, Cd, Cr, Cu, Fe, K, Mg, Mn, Na, Pb and
Zn in yerba mate.37
Thus, this study aims to determine the concentrations of Cu, Zn, Cr and Pb in different species of fish from estuarine and limnic portions of the São Gonçalo channel, in different seasons of 2013 and 2014. The samples were prepared by acid decomposition with the reflux system and the best conditions for decomposition (H2O2 volume, temperature
of digester block and decomposition time) were optimized by employing a central composite design (CCD).
Experimental
Seasonal sampling
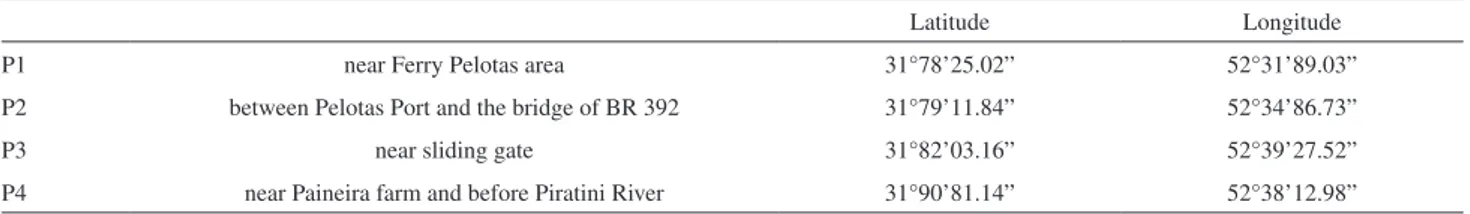
summer of 2014. In total, there were four sampling series and 138 samples, distributed in four different species of fish, taken in triplicate. All collection points were properly identified with a GPS (global positioning system) model GarminEtrex Vista® H, and are defined in Table 1 and identified in the image shown in Figure S1 (Supplementary Information).
For fish collection, fishing nets with a mesh of 18 mm were used. Four fish species were collected: Cyphocharax voga (biru), Loricariichthys anus (viola), Pimelodus clarias (pintado) and Micropogonias furnieri (corvina). After collection, the fishes were placed in labeled polyethylene bags and stored in a cooler with ice for transport to the laboratory. They were initially washed, visceral parts were removed, and the muscle was separated and cut into fillets. The in natura fish fillets were homogenized by maceration with mortar and pestle, put into clean plastic containers and frozen at −16 °C. Fish tissue samples were defrosted just before the sample preparation step.
Instrumentation
Analytical measurements for Cu and Zn were carried out using a flame atomic absorption spectrometer PerkinElmer AAnalyst 200 (Shelton, CT, USA) equipped with deuterium arc background correction and a hollow cathode lamps source: Cu (324.75 nm) and Zn (213.86 nm) were operated at 15 mA and spectral band path of 0.7 nm for both analytes. Acetylene (99.7%, Linde, São Paulo, SP, Brazil) was used in the flame. Gas flow rates were: 2.50 L min-1 (fuel) and 10 L min-1 (air).
Integrated absorbance signals for Pb and Cr were measured in an atomic absorption spectrometer with a graphite furnace PerkinElmer PinAAncle 900z (Shelton, CT, USA) equipped with an autosampler PerkinElmer AS-900 model (Shelton, CT, USA), a transverse-heated graphite tube atomizer, and Zeeman-effect background correction. Hollow cathode lamps for Pb and Cr (PerkinElmer, Part No. N305-0157 and N305-0119, respectively, Shelton, CT, USA) were used operating at 10 mA (Pb) and 25 mA (Cr) and spectral band path of 0.7 nm for both analytes. Argon (99.996%, Linde, São Paulo, SP, Brazil) was used as protected and purge gas. All experiments were carried
out using pyrolytic graphite coated tubes with integrated platforms. The temperature program is shown in Table S1 (Supplementary Information).
For the sample acid decomposition, a heated digester block was used (MA-4025 model, Marconi, Piracicaba, SP, Brazil). In each digester tube, a cold finger was introduced to avoid losses by volatilization of analytes and reagents. The system consists of a glass tube closed with a small glass tube and filled with cold water (15 °C), in order to help the recirculation of the acids within the bigger tube. More details of this system are described by Oreste et al.33
Samples were weighed using an analytical balance (Model 2140 from Ohaus Adventurer, Parsippany, NJ, USA).
Reagents, solutions and certified reference materials
All chemicals and reagents used in were of analytical-reagent grade. All solutions were prepared by using deionized water obtained by a water distiller MA078 (Marconi, Piracicaba, SP, Brazil) and subsequently deionized by passing through a column CS1800 (Permution, Curitiba, PR, Brazil). Nitric acid 65% (m/m) (Synth, Diadema, SP, Brazil) and hydrogen peroxide 30% (v/v) (Merck, Darmstadt, Germany) were used. The nitric acid was purified by doubly sub boiling distillation in a quartz system MA-075 (Marconi, Piracicaba, SP, Brazil). Pd and Mg (Sigma-Aldrich, Sigma, St. Louis, MO, USA) were used as a chemical modifier with addition into the graphite furnace of 15 µg Mg for measurements of Cr and 3 µg Mg + 5 µg Pd for measurements of Pb. Standard solutions of Pb, Cr, Zn and Cu (Merck, Darmstadt, Germany) were prepared daily by appropriate dilutions of a stock solution containing 1000 mg L-1 of each analyte
in HNO3 2% (v/v) from a standard concentrate solution.
The following certified reference materials (CRM) were used to evaluate the accuracy of the proposed method: TORT-2 (lobster hepatopancreas) from the National Research Council Canada (NRCC, Ottawa, ON, Canada) for Cu, Zn and Cr; SRM 2976 (muscle tissue of marine bivalve mollusk) from the National Institute of Standards and Technology (NIST, Gaithersburg, MD, USA) for Pb; and ERM®-BB422 (cod muscle) from the European Reference Material (Geel, Belgium) for Cu and Zn.
Table 1. Description of the collection points
Latitude Longitude
P1 near Ferry Pelotas area 31°78’25.02” 52°31’89.03”
P2 between Pelotas Port and the bridge of BR 392 31°79’11.84” 52°34’86.73”
P3 near sliding gate 31°82’03.16” 52°39’27.52”
Sample preparation procedure
The optimization of the acid decomposition procedure using the reflux system for fish samples was performed using a full factorial design considering the following variables: H2O2 volume, temperature of digester block
and decomposition time (Table S2, Supplementary Information). The ranges of the independent variables were based on preliminary experiments. A central composite design (CCD) was applied (23 factorial, with three central
points and six axial points) providing a total of 17 randomly performed experiments. All results were analyzed using the software Statistica® 7.0 (Statsoft Inc., Tulsa, OK, USA),
considering a significance level of 95%.
For the acid decomposition procedure, approximately 250 mg of sample in natura and defrosted was weighed into a glass digester tube, and 5.0 mL of 65% HNO3 (m/m) was
added. The mixture was heated to boiling point in a digester block at 150 °C for 2 h. The reflux system consists of a glass digester tube closed with a small glass tube (17 cm) and filled with continuous cold water recirculation, controlled at 15 °C by a thermostatic bath Model Q-214M2 (Marconi, Piracicaba, SP, Brazil). This system promotes the acids recirculation within the bigger tube (25 cm) and avoid losses by volatilization of the analytes and reagents during the decomposition. After 90 min of the digestion, the tubes were removed from the digester block until the solution reached room temperature, and after, it was added 2 mL of H2O2 to the digester tubes, which returned to the digester
block to finish the decomposition. The decomposition was complete when all the sample fat was dissolved on visual inspection. After cooling, the mixture was transferred to a polyethylene flask and the final volume was completed at 14 mL with deionized water. All samples were prepared in triplicate, and analytical blanks were prepared using the same procedure. For the determination of analyte concentrations in CRM, 250 mg of sample was weighed.
Figures of merit evaluated in this work were limits of detection (LOD), limits of quantification (LOQ), linearity and accuracy. The procedures were performed in compliance with the INMETRO guide38 for the validation
of the method. Calibration curves were prepared with standard solutions of Cu, Zn, Cr and Pb in 2% HNO3 (v/v).
Results and Discussion
Optimization of decomposition method
The choice of the method for the decomposition of fish tissue samples should be made considering its efficiency in providing free analytes in solution for further detection
without interference. Thus, decomposition in an open system with a cold finger using nitric acid was explored as a sample preparation method for the determination of the metals Cu and Zn and the volatile elements Cd and Pb in fish tissue samples.
In order to optimize the conditions for acid decomposition with the reflux system, factorial design experiments were used. Additionally, the influence of the variables H2O2
volume, decomposition time and temperature were evaluated. The matrix of the full factorial design containing the data for Cu, Zn, Cr and Pb, as well as absorbance as the analytical response, is shown in Table S3 (Supplementary Information). The central points presented small variations with relative standard deviations ranging from 1 to 2.5%, indicating excellent repeatability for the analysis.
The results, evaluated using a Pareto chart (Figures S2 and S3, Supplementary Information), demonstrated that the variables H2O2 volume and digestion time were
statistically significant for Zn and Pb. Considering a 95% confidence level, the effects were negative for both variables in relation to Zn (Figure S2A) and Pb (Figure S2B). For Cr (Figure S3A) and Cu (Figure S3B), no variable was statistically significant or generated surface response graphics at the levels studied.
Regression coefficients obtained using the central composite design for Zn and Pb are presented in Tables S4 and S5 (Supplementary Information), respectively. Quadratic terms were statistically significant for H2O2
volume (V) and decomposition time (T) (p < 0.05) for both analytes. Regression equations obtained for Zn and Pb were: Absorbance = 0.184813 – 0.009403V2 – 0.010415T2 (Zn) and
Absorbance = 0.114345 – 0.010054V2 – 0.006147T2 (Pb).
Results from the analysis of variance (ANOVA) for Zn and Pb showed that the models are significant and adequate to describe the results through the surface response because of the F value (38.34 and 15.24, respectively).
Due to the high concentration of organic matter in the samples, a higher volume of H2O2 is required to increase
the oxidation efficiency sufficiently to allow the acquisition of a clear solution suitable for analysis on an atomic absorption spectrophotometer. Since only the variables H2O2 volume and decomposition time were significant, it
was possible to generate only one surface response for each analyte (Figures 1A and 1B) and the best results for the H2O2 volume were obtained at the central point. For this
reason, 2 mL of H2O2 was chosen as the final condition for
The temperature variable was not statistically significant for the investigated analytes. Thus, a temperature of 150 °C was used to ensure the boiling point of the nitric acid was reached, as well as to break bonds in the fish samples between analytes and proteins in the case of Zn, Cu and Pb39-41 or analytes and lipids in the case of Cr.42 Therefore,
the analytes are free in solution and able to be detected by atomic spectrometry techniques. Since no variables were statistically significant for Cu and Cr, the same conditions of acid decomposition employed for Zn and Pb were used in order to standardize the method using the digester block with cold finger as a reflux system.
The decomposition procedure with the cold finger is safer and more effective in organic decomposition. It also presents no analyte losses through volatilization and shows optimum values of sensitivity and detection limits. The use of the cold finger has provided lower method detection limits than those achieved in other works using pre-concentration techniques,43 microwave-assisted
digestion or slurry sampling.44
Analytical results
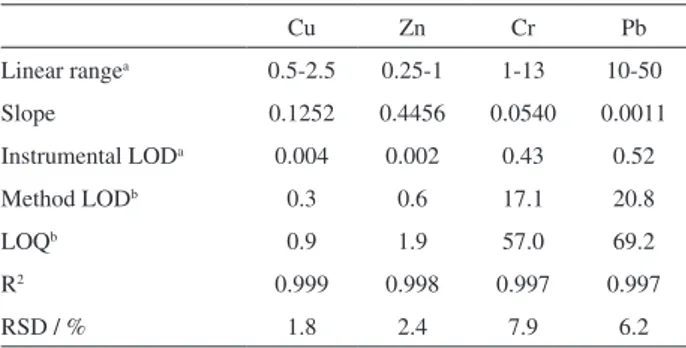
Figures of merit were obtained for the determination of the analytes Cu, Zn, Cr and Pb in fish tissue samples, after establishing the sample preparation procedure using acid decomposition with a reflux system, and are shown in Table 2. Calibration curves showed adequate linearity in the range applied, as well as good linear correlation coefficients for all obtained curves (R > 0.99). Good precision was obtained, with relative standard deviation (RSD) values between 7.3 and 15%, in accordance with the guidelines established by AOAC.45 Limits of quantification obtained
were appropriate with the proposal of the study.
For the purposes of comparison, the obtained concentrations results were analyzed considering the maximum limits of some elements in fish established by the Brazilian regulation on National Food Sanitary Surveillance Division (DINAL, ordinance No. 685) which was partially revoked by Resolution No. 42/13 of ANVISA:46 30 mg kg-1
for Cu; 50 mg kg-1 for Zn; 100 µg kg-1 for Cr and 300 µg kg-1
for Pb.
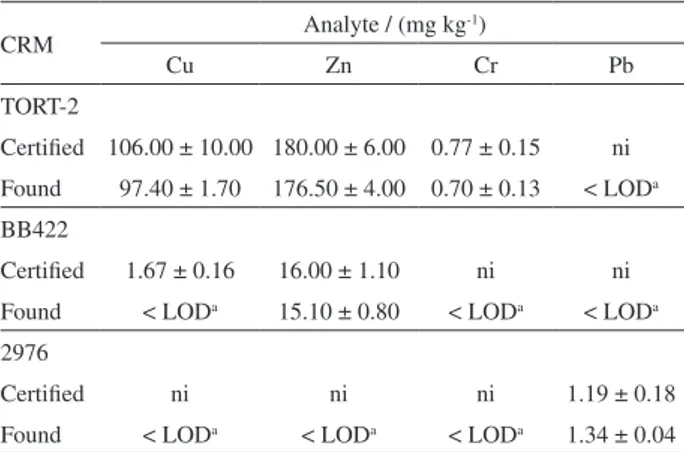
The accuracy of the method was evaluated using three certified reference materials and the results are shown in Table 3. Although several values are not certified or informed by the supplier, the certified reference materials were prepared following the acid decomposition procedure. The determined concentration of these analytes was lower than the detection limit for the method, considering the mass of the sample employed and the final volume. The application of the Student’s t-test at a confidence level of 95% showed good agreement between the measured and the certified values and no statistically significant difference
Table 2. Figures of merit for the determination of Cu and Zn by F AAS and Cr and Pb by GF AAS in fish tissue samples
Cu Zn Cr Pb
Linear rangea 0.5-2.5 0.25-1 1-13 10-50
Slope 0.1252 0.4456 0.0540 0.0011
Instrumental LODa 0.004 0.002 0.43 0.52
Method LODb 0.3 0.6 17.1 20.8
LOQb 0.9 1.9 57.0 69.2
R2 0.999 0.998 0.997 0.997
RSD / % 1.8 2.4 7.9 6.2
amg L-1 for Cu and Zn; µg L-1 for Cr and Pb; bmg kg-1 for Cu and Zn; µg kg-1
for Cr and Pb. LOD: limit of detection; LOQ: limit of quantification; RSD: relative standard deviation.
Figure 1. Surface response obtained from the central composite design for (A) Zn and (B) Pb determinations. Variables: decomposition time (h) and H2O2
was found, confirming the accuracy of the results for all studied analytes.
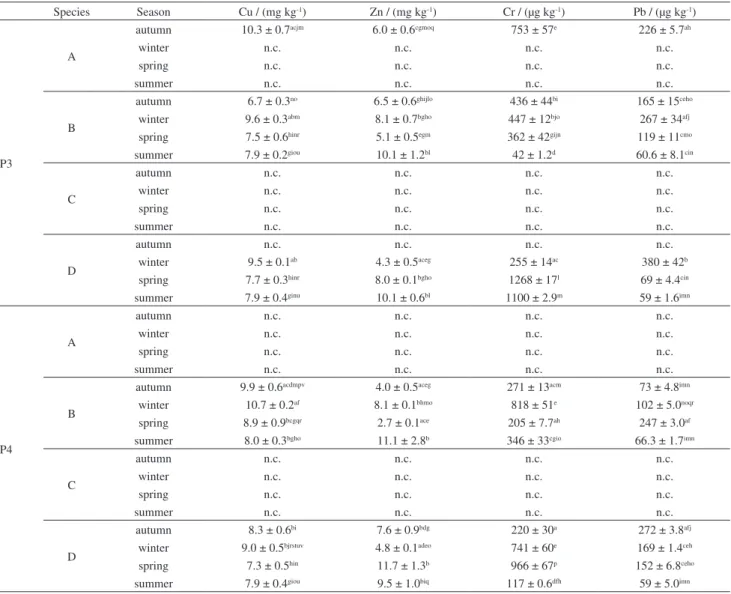
The results obtained for the determination of Cu, Zn, Cr and Pb in fish samples are shown in Tables 4 and 5, divided by their different collection points (P1 and P2; P3 and P4). Some species were not obtained during the collection. According to the Tukey’s test at the 95% confidence level, the results presented variations in the concentrations of analytes for the different seasons, collection points and fish species.
When different collection points were compared, the highest concentrations of Cu, Zn and Pb were observed in fishes collected at P1 and P2 in the estuarine region. It was expected that these points would be polluted or present high concentrations of all metals investigated, because they are urban areas, subject to outflow from other channels that
Table 3. Analytical results of the concentrations for Cu, Zn, Cr and Pb in certified reference materials (n = 3)
CRM Analyte / (mg kg
-1)
Cu Zn Cr Pb
TORT-2
Certified 106.00 ± 10.00 180.00 ± 6.00 0.77 ± 0.15 ni Found 97.40 ± 1.70 176.50 ± 4.00 0.70 ± 0.13 < LODa
BB422
Certified 1.67 ± 0.16 16.00 ± 1.10 ni ni Found < LODa 15.10 ± 0.80 < LODa < LODa
2976
Certified ni ni ni 1.19 ± 0.18
Found < LODa < LODa < LODa 1.34 ± 0.04 aMethod LOD: Cu: 0.3 mg kg-1; Zn: 0.6 mg kg-1; Cr: 17.1 µg kg-1;
Pb: 20.8 µg kg-1. ni: not informed; LOD: limit of detection.
Table 4. Concentrations of Cu, Zn, Cr and Pb in fish species of São Gonçalo channel (P1 and P2) (n = 3)
Species Season Cu / (mg kg-1) Zn / (mg kg-1) Cr / (µg kg-1) Pb / (µg kg-1)
P1
A
autumn 10.7 ± 0.01adf 2.6 ± 0.1ace 253 ± 5.5ac 242 ± 12af
winter 9.5 ± 0.9ab 10.4 ± 0.6bd 470 ± 30b 416 ± 26bg
spring n.c. n.c. n.c. n.c.
summer n.c. n.c. n.c. n.c.
B
autumn 10.5 ± 0.04aefs 2.2 ± 0.1ae 219 ± 23ah 145 ± 5.0ceo
winter 10.1 ± 0.6aelqs 10.6 ± 1.3b 243 ± 18ac 123 ± 14cmo
spring 9.4 ± 0.03abg 4.1 ± 0.1acdej 332 ± 39cg 487 ± 2.0d
summer 8.1 ± 0.7bghn 5.6 ± 0.2acdgh 40 ± 3.6d 220 ± 1.0ah
C
autumn 10.5 ± 0.3aefs 6.2 ± 0.7cdgih 184 ± 20af 202 ± 10aeh
winter n.c. n.c. n.c. n.c.
spring n.c. n.c. n.c. n.c.
summer 8.1 ± 0.2bghn 6.7 ± 0.4dghil 61 ± 5.3d 306 ± 0.4fj
D
autumn n.c. n.c. n.c. n.c.
winter 10.3 ± 0.1acels 12.5 ± 0.3b < LOD 306 ± 9.5fj
spring 8.8 ± 0.01bcgh 1.8 ± 0.01e 832 ± 0.01e 379 ± 18b
summer 11.4 ± 0.7defj 12.8 ± 1.9b 89 ± 4.1df 480 ± 80dg
P2
A
autumn 10.6 ± 0.2aef 3.2 ± 0.3acdej 218 ± 28ah 189 ± 10ae
winter 8.2 ± 0.01bghn 5.1 ± 0.01acdeh 221 ± 0.01ah 426 ± 40bd
spring n.c. n.c. n.c. n.c.
summer n.c. n.c. n.c. n.c.
B
autumn n.c. n.c. n.c. n.c.
winter 12.0 ± 0.1fl 23.6 ± 2.7f 228 ± 16ah 177 ± 17ceh
spring 8.2 ± 0.4bghn 8.7 ± 2.4bgh 455 ± 33bj 163 ± 1.0ceho
summer 7.9 ± 0.4ghint 11.5 ± 2.1b 373 ± 90bgn 167 ± 28ceh
C
autumn 10.5 ± 0.1afnt 5.5 ± 0.6aegm 190 ± 16af 129 ± 4.0cen
winter n.c. n.c. n.c. n.c.
spring 7.7 ± 0.4hir 2.8 ± 0.2acej 465 ± 2.2bj 37 ± 1.7i
summer 8.4 ± 0.3bip 11.3 ± 0.7b 61 ± 0.1d 200 ± 7.8ahl
D
autumn 10.5 ± 0.3afj 7.6 ± 0.1bdg 319 ± 14chg 313 ± 1.2j
winter 11.1 ± 1.3flm 20.8 ± 0.2f 396 ± 47bg 367 ± 0.2bj
spring 7.3 ± 0.2hin 5.6 ± 0.3acdgm 338 ± 11cgi 49 ± 4.9iq
summer 8.3 ± 0.4bi 9.8 ± 1.0bi 77 ± 10d 139 ± 22celr
circulate in the city, and serving as wastewater disposal for tanning, food and metalworking industries, and subject to local deposition of construction and urban waste. Chromium was found at high levels throughout in all points, but especially in the limnic region (P3 and P4), which was expected to be the less polluted region. Considering the fish, the specimens of Loricariichthys anus (viola) showed the highest concentrations of all analytes evaluated. It should also be noted that, theoretically, with time, there would be accumulation of metals in the fish, however, in the present study this was not observed. This is not to say that it did not occur, but that it was not perceptible in view of the low concentrations found compared to the limits proposed by the legislation.
The Cu concentration levels found ranged between 6.7 to 12.0 mg kg-1 in the autumn and winter seasons of 2013,
respectively, both the maximum and minimum being found in Pimelodus clarias, as shown in Figure 2 and presenting significant variation according to the Tukey’s test. The maximum concentration value was close to the found by Bugallo et al.44 (12 mg kg-1) and Souza et al.16 (11.9 mg kg-1).
Souza et al.16 analyzed muscles and viscera of tilapia,
lambari, piau and catfish species from a fishery in the city of Umuarama-PR, and found different concentrations of Cu that reached 40 mg kg-1 in the viscera. According to these
authors, as the lake water was slightly acidic (pH = 6.5), it favored Cu solvation, making the Cu bioavailable to the fish. Accumulation was mainly in the viscera, where Cu binds to metallothionein, serving as a fish detoxification mechanism. Other authors have reported higher values for Cu in fish: 16.1 mg kg-1 in fish from the Neretva river
(Bosnia and Herzegovina)25 and 24 mg kg-1 in fish, shellfish
Table 5. Concentrations of Cu, Zn, Cr and Pb in fish species of São Gonçalo channel (P3 and P4) (n = 3)
Species Season Cu / (mg kg-1) Zn / (mg kg-1) Cr / (µg kg-1) Pb / (µg kg-1)
P3
A
autumn 10.3 ± 0.7acjm 6.0 ± 0.6cgmoq 753 ± 57e 226 ± 5.7ah
winter n.c. n.c. n.c. n.c.
spring n.c. n.c. n.c. n.c.
summer n.c. n.c. n.c. n.c.
B
autumn 6.7 ± 0.3no 6.5 ± 0.6ghijlo 436 ± 44bi 165 ± 15ceho
winter 9.6 ± 0.3abm 8.1 ± 0.7bgho 447 ± 12bjo 267 ± 34afj
spring 7.5 ± 0.6hinr 5.1 ± 0.5egm 362 ± 42gijn 119 ± 11cmo
summer 7.9 ± 0.2giou 10.1 ± 1.2bl 42 ± 1.2d 60.6 ± 8.1cin
C
autumn n.c. n.c. n.c. n.c.
winter n.c. n.c. n.c. n.c.
spring n.c. n.c. n.c. n.c.
summer n.c. n.c. n.c. n.c.
D
autumn n.c. n.c. n.c. n.c.
winter 9.5 ± 0.1ab 4.3 ± 0.5aceg 255 ± 14ac 380 ± 42b
spring 7.7 ± 0.3hinr 8.0 ± 0.1bgho 1268 ± 17l 69 ± 4.4cin
summer 7.9 ± 0.4ginu 10.1 ± 0.6bl 1100 ± 2.9m 59 ± 1.6imn
P4
A
autumn n.c. n.c. n.c. n.c.
winter n.c. n.c. n.c. n.c.
spring n.c. n.c. n.c. n.c.
summer n.c. n.c. n.c. n.c.
B
autumn 9.9 ± 0.6acdmpv 4.0 ± 0.5aceg 271 ± 13acm 73 ± 4.8imn
winter 10.7 ± 0.2af 8.1 ± 0.1bhmo 818 ± 51e 102 ± 5.0noqr
spring 8.9 ± 0.9bcgqr 2.7 ± 0.1ace 205 ± 7.7ah 247 ± 3.0af
summer 8.0 ± 0.3bgho 11.1 ± 2.8b 346 ± 33cgio 66.3 ± 1.7imn
C
autumn n.c. n.c. n.c. n.c.
winter n.c. n.c. n.c. n.c.
spring n.c. n.c. n.c. n.c.
summer n.c. n.c. n.c. n.c.
D
autumn 8.3 ± 0.6bi 7.6 ± 0.9bdg 220 ± 30a 272 ± 3.8afj
winter 9.0 ± 0.5bjrstuv 4.8 ± 0.1adeo 741 ± 60e 169 ± 1.4ceh
spring 7.3 ± 0.5hin 11.7 ± 1.3b 966 ± 67p 152 ± 6.8ceho
summer 7.9 ± 0.4giou 9.5 ± 1.0biq 117 ± 0.6dfh 59 ± 5.0imn
and fish products from internal markets of India.11 Lower
concentration levels were found by Olmedo et al.21 ranging
from 0.069 to 4.73 mg kg-1 in fish and shellfish of Spain; and
by Leung et al.28 in the range of 0.79 and 2.26 mg kg-1 in
tissue from fish species of the Pearl River Delta, China. The values found in our work were higher in P1 and P2 (regions with higher anthropogenic activity) and during the winter, probably because it is the period of reproduction of the fish. However, the Cu concentrations obtained were below the maximum level recommended by Brazilian legislation.46
Therefore, no evidence was found of Cu contamination in the analyzed fish of the channel.
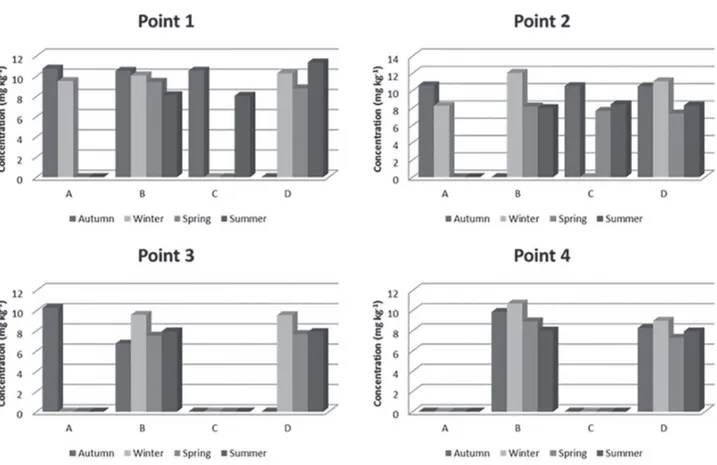
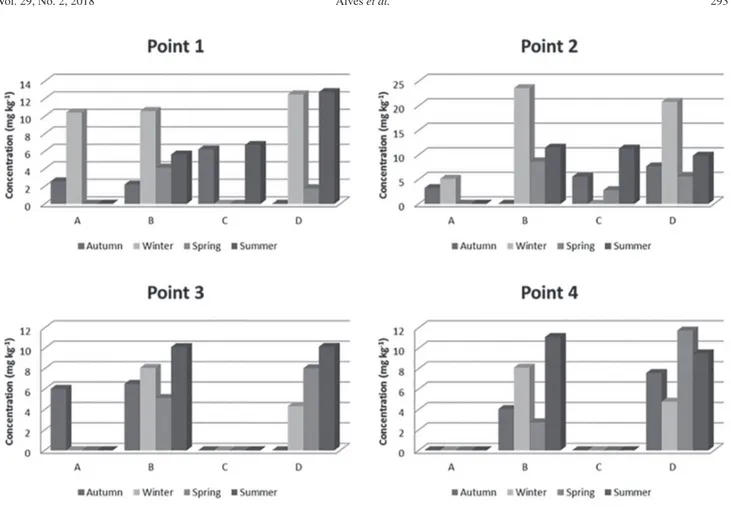
For Zn, the concentrations in the analyzed fish samples ranged between 1.8 and 23.6 mg kg-1, and the highest
concentrations were observed during the winter in the species Pimelodus clarias and Loricariichthys anus, and in particular in P1 and P2 (Figure 3). In winter, considerable precipitation occurs causing waste leaching. The concentrations found are lower than the maximum level recommended by the Brazilian legislation.46 Sivaperumal et al.11 and Olmedo et al.21 detected
lower levels of Zn, 0.6 and 1.24 mg kg-1, respectively, in fish
samples from Cochin (India) and Andalusia (Spain). Other works (Yilmaz et al.;29 Souza et al.;16 Mendil et al.;18
Saei-Dehkordi and Fallah;47 Medeiros et al.;26 Hoo Fung et al.20
and Akoto et al.48) reported values closer to the range found
in this work. Regardless of the different species of fish, the aforementioned works ratify the hypothesis of direct influence of climatic seasons, especially the phenomenon of leaching of pollutants. It should be noted that the maximum limit of Zn allowed in fish is 50 mg kg-1 and that this value
was not reached by any of the fish species of the channel that were analyzed.
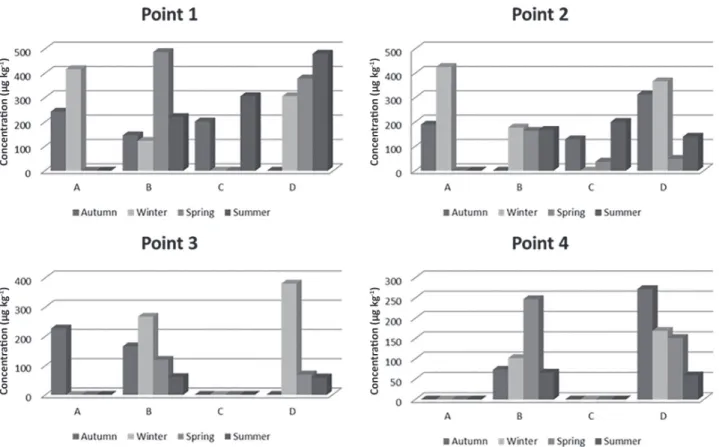
The Pb content in all the analyzed fish samples (Figure 4) ranged between 37 and 487 µg kg-1. These values are similar
to the concentrations found by Morgano et al.49 (26 to
481 µg kg-1) in fishes samples of porgy (Pagrus pagrus),
salmon (Salmo salar), snook (Centropomus sp.), and tuna (Thunnus thynnus) species and by Saei-Dehkordi and Fallah47 in fishes of six species: narrowbarred Spanish
mackerel (Scomberomorus commerson), dorab wolf herring (Chirocentrus dorab), pick handle barracuda (Sphyraena jello), cobia (Rachycentron conadum), long tail tuna (Thunus tonggol) and hilsa shad (Tenualosa ilisha) belonged to the pelagic habitat, and the rest: Japanese threadfin bream (Nemipterus japonicas), orangespotted grouper (Epinephelus coioides), bartail flathead (Platycephalus indicus), Indian spiny turbot (Psettodes erumei), silver javelin (Pomadasys argenteus) and yellowfin seabream (Acanthopagrus latus) pertained to the demersal habitat from the Persian Gulf (57 to 471 µg kg-1).
Figure 2. Concentrations of Cu (mg kg-1) in different fish species. A: Cyphocharax voga; B: Pimelodus clarias; C: Micropogonias furnieri;
Olmedo et al.21 and Chahid et al.12 found lower
concentration values: 4 and 13 µg kg-1, respectively, in fishes
from Andalusia (Spain) and Kingdom of Morocco. Higher values were determined by Repula et al.50 and Leung et al.28
(2560 and 8620 µg kg-1, respectively, in fishes from
Guarapuava, PR, Brazil and Pearl River Delta, China). The highest Pb concentrations found, exceeding the maximum permitted in fish (300 µg kg-1), were detected in different
species of fish and seasons, especially at points P1 and P2, where there is anthropogenic activity (industrial and fishing activity), many houses and disposal of highly contaminated water from different neighborhoods in the city of Pelotas.
The concentrations of Cr ranged from 40 (sample B, summer) to 1268 µg kg-1 (sample D, spring) and the highest
values were found in the species Loricariichthys anus at points P3 and P4 during the spring of 2013 and summer of 2014 (Figure 5). The higher values of Cr detected may be related to the low volume of rainfall in these seasons, and the increase in temperature that favors the solubilization of compounds formed by this analyte, thus increasing the Cr concentration in the São Gonçalo channel and consequently in fishes.
The maximum concentration value found is similar with the maximum obtained by Repula et al.,50 1300 µg kg-1.
Sivaperumal et al.11 found a higher value (3650 µg kg-1)
and Morgano et al.49 a lower value (8 µg kg-1). About 80%
of the results presented concentrations above the maximum established for Cr in fish, which is 100 µg kg-1. Almost all
sampling points, all fish species and all evaluated seasons presented contamination by this metal. It is hypothesized that the contamination is derived from effluents that are rich in Cr discharged into the São Gonçalo channel from tanneries in the Pelotas region. Cr then accumulates in the environments and organisms in which it is found.
Analyzing the obtained data, it is possible to verify that the São Gonçalo channel presents diverse degrees of contamination in relation to the analytes investigated in this work. Zinc and Cu levels remained below the maximum toxicity limits, while the concentrations of Pb indicated that the estuarine portion of the channel suffers the impact of human activities, in particular domestic disposal, such as the disposal of electronic equipment and batteries from various regions of Pelotas City.
As mentioned above, the Cr concentrations were higher than established by legislation in all collection points of channel, but especially in the limnic region, which is characterized by intense agricultural activity, especially rice production. It should be also noted that the region of
Figure 3. Concentrations of Zn (mg kg-1) in different fish species. A: Cyphocharax voga; B: Pimelodus clarias; C: Micropogonias furnieri;
Figure 4. Concentrations of Pb (µg kg-1) in different fish species. A: Cyphocharax voga; B: Pimelodus clarias; C: Micropogonias furnieri;
D: Loricariichthys anus.
Figure 5. Concentrations of Cr (µg kg-1) in different fish species. A: Cyphocharax voga; B: Pimelodus clarias; C: Micropogonias furnieri;
Pelotas features leather tanning industries, some already discontinued, whose effluents are rich in Cr.
An important fact to consider is that the São Gonçalo channel consists of two distinct bodies of water: estuarine (saltiest waters) and limnic (fresh water). The distribution of fish along the collection points also varied, so that the Micropogonias furnieri, which is a marine species, was practically absent at points P3 and P4 (limnic portion). The other fishes evaluated are freshwater species and were present throughout the channel. The high concentrations of Zn and Cu found in Pimelodus clarias can be attributed to the fact that this fish is omnivorous and feeds on algae and small fish, favoring the biomagnification (Sanches Filho et al.).51 In addition to biomagnification,
there is also bioaccumulation, which deals with the ability to accumulate a substance from the environment or through food by a particular organism. Thus, both phenomena suggest the use of fish as biological indicators of the environmental quality of specific water resources and justified the use of these animals in this study.
Regarding seasonal influence, it was observed that seasonality does have an effect, but it is specific to each species of fish and investigated metal, making it difficult to characterize the degree of contamination in water resources according to the different seasons of the year.
Conclusions
Knowledge of the concentrations of metals, particularly toxic metals, in fish is important concerning the management of the natural environment and human health. Among the four elements investigated, Pb (at points 1, 2 and 3) and Cr showed concentrations above those permitted by legislation for fish, differently to Zn and Cu, essential metals to humans, although they were present all along the São Gonçalo channel. It is believed that high concentrations of the investigated analytes are directly related to urban and industrial waste, as well as the agricultural activities of the region, mainly rice production. Considering these results, a continuous monitoring of the biota of São Gonçalo channel is suggested, due to its economic, social and ecological importance for the local population.
The use of acid decomposition with a reflux system as a sample preparation method for the determination of Cu, Zn, Cr and Pb in fresh fish samples was adequate and easy to use, providing satisfactory results with good accuracy. The procedure can be employed to decompose fish tissue samples at low cost and using only a small amount of sample. The central composite design is a fast and efficient tool to optimize the best conditions for sample preparation procedures, and a low time of decomposition
(2 h) was achieved. Limits of quantification values for all analytes were adequate and in agreement with the maximum concentration limits permitted for fishes by Brazilian legislation.
Supplementary Information
Supplementary data are available free of charge at http://jbcs.sbq.org.br as PDF file.
Acknowledgments
The authors are grateful to Fundação de Amparo à Pesquisa do Estado do Rio Grande do Sul (FAPERGS), Programa Pesquisador Gaúcho (Process 2027-2551/13-3 SIAFEM) for financial support, Conselho Nacional de Desenvolvimento Científico e Tecnológico (CNPq, Process 310917/2013-1) and Coordenação de Aperfeiçoamento de Pessoal de Nível Superior (CAPES) for scholarships and financial support.
References
1. Burger, J.; Gochfeld, M.; Environ. Res. 2005, 99, 403. 2. Storelli, M. M.; Gochfeld, M.; Food Chem. Toxicol. 2008, 46,
2782.
3. Bosch, A.; O’Neill, B.; Sigge, G. O.; Kerwath, S. E.; Hoffman, L. C.; J. Sci. Food Agric. 2016, 96, 32.
4. Karadede, H.; Oymakb, S. A.; Ünlü, E.; Environ. Int. 2004, 30, 183.
5. Wagner, A.; Boman, J.; Spectrochim. Acta, Part B 2003, 58, 2215.
6. Qiao-qiao, C.; Guang-wei, Z.; Langdon, A.; J. Environ. Sci.
2007, 19, 1500.
7. Saravi, S. S. S.; Karami, B.; Karami, S.; Shokrzadeh, M.; Bull.
Environ. Contam. 2012, 89, 419.
8. Burns, M. D. M.; Garcia, A. M.; Vieira, J. P.; Bemvenuti, M. A.; Marques, D. M. L. M.; Condini, V.; Neotrop. Ichthyol. 2006, 4, 69.
9. Papagiannis, I.; Kagalou, I.; Leonardos, J.; Petridis, D.; Kalfakakou, V.; Environ. Int. 2004, 30, 357.
10. ATSDR, Toxicological Profile for Copper, U.S. Department of Health and Human Services; Public Health Service, Agency for Toxic Substances and Disease Registry, Atlanta, GA, 2004. 11. Sivaperumal, P.; Sankar, T. V.; Viswanathan Nair, P. G.; Food
Chem. 2007, 102, 612.
12. Chahid, A.; Hilali, M.; Benlhachimi, A.; Bouzid, T.; Food Chem.
2014, 147, 357.
13. Dalman, Ö.; Demirak, A.; Balcı, A.; Food Chem. 2006, 95, 157. 14. Manutsewee, N.; Aeungmaitrepirom, W.; Varanusupakul, P.;
15. Kehrig, H. A.; Palermo, E. F. A.; Seixas, T. G.; Santos, H. S. B.; Malma, O.; Akagib, H.; J. Braz. Chem. Soc. 2009, 20, 1142. 16. Souza, G. R.; Garcez, M. A. P.; Santos, V. C. G.; Silva, D. B.;
Caetano, J.; Dragunski, D. C.; Arq. Ciênc. Vet. Zool. Unipar
2009, 12, 61.
17. Begum, A.; HariKrishna, S.; Khan, I.; Int. J. Chem. Tech. Res.
2009, 1, 245.
18. Mendil, D.; Ünal, Ö. F.; Tüzen, M.; Soylak, M.; Food Chem. Toxicol. 2010, 48, 1383.
19. Pereira, L. A.; Windmöller, C. C.; Silva, J. B. B.; Quim. Nova
2011, 34, 1167.
20. Hoo Fung, L. A.; Antoine, J. M. R.; Grant, C. N.; Buddo, D. S. A.; Food Chem. Toxicol. 2013, 60, 205.
21. Olmedo, P.; Hernández, A. F.; Pla, A.; Femia, P.; Navas-Acien, A.; Gil, F.; Food Chem. Toxicol. 2013, 62, 299.
22. Molognoni, L.; Vitali, L.; Ploêncio, L. A. S.; Santos, J. N.; Daguer, H.; J. Sci. Food Agric.2016, 96, 3109.
23. Vicente-Martorell, J. J.; Galindo-Riaño, M. D.; García-Vargas, M.; Granado-Castro, M. D.; J. Hazard. Mater. 2009, 162, 823. 24. Guérin, T.; Chekri, R.; Vastel, C.; Sirot, V.; Volatier, J.; Leblanc,
J.; Noël, L.; Food Chem. 2011, 127, 934.
25. Djedjibegovic, J.; Larssen, T.; Skrbo, A.; Marjanovic’, A.; Sober, M.; Food Chem. 2012, 131, 469.
26. Medeiros, R. J.; Santos, L. M. G.; Freire, A. S.; Santelli, R. E.; Braga, A. M. C. B.; Krauss, T. M.; Jacob, S. C.; Food Control
2012, 23, 535.
27. Noël, L.; Chekri, R.; Millour, S.; Merlo, M.; Leblanc, J.; Guérin, T.; Chemosphere 2013, 90, 1900.
28. Leung, H. M.; Leung, A. O. W.; Wang, H. S.; Maa, K. K.; Liang, Y.; Ho, K. C.; Cheung, K. C.; Tohidi, F.; Yung, K. K. L.; Mar. Pollut. Bull. 2014, 78, 235.
29. Yılmaz, F.; Özdemir, N.; Demirak, A.; Tuna, A. L.; Food Chem.
2007, 100, 830.
30. Barros, B. C. V.; Pereira, S. F. P.; Palheta, D. C.; Silva, C. S.;
Holos Environ. 2010, 10, 195.
31. Mol, S.; J. Food Compos. Anal. 2011, 24, 66.
32. Ferreira, S. L. C.; Silva, L. O. B.; de Santana, F. A.; Junior, M. M. S.; Matos, G. D.; dos Santos, W. N. L.; Microchem. J. 2013,
106, 307.
33. Oreste, E. Q.; Jesus, A.; de Oliveira, R. M.; Silva, M. M.; Vieira, M. A.; Ribeiro, A. S.; Microchem. J. 2013, 109, 5.
34. Oreste, E. Q.; de Oliveira, R. M.; Nunes, A. M.; Vieira, M. A.; Ribeiro, A. S.; Anal. Methods 2013, 5, 1590.
35. Oreste, E. Q.; de Souza, A. O.; Pereira, C. C.; Lisboa, M. T.; Cidade, M. J. A.; Vieira, M. A.; Cadore, S.; Ribeiro, A. S.; Food
Anal. Methods 2015, 9, 777.
36. de Oliveira, R. M.; Antunes, A. C. N.; Vieira, M. A.; Medina, A. L.; Ribeiro, A. S.; Microchem. J. 2016, 124, 402.
37. Pereira, C. C.; de Souza, A. O.; Oreste, E. Q.; Cidade, M. J. A.; Cadore, S.; Ribeiro, A. S.; Vieira, M. A.; J. Braz. Chem. Soc.
2016, 27, 685.
38. INMETRO, DOQ-CGCRE-008, Revisão 04, Julho, 2011,
Orientação sobre Validação de Métodos de Ensaios Químicos,
Coordenação Geral de Acreditação, 2011.
39. Cousins, R. J. In Present Knowledge in Nutrition, 7th ed.;
Cousins, R. J.; Ziegler, E. E.; Filer Jr., L. J.; ILSI Press: Washington, D.C., USA, 1996, ch. 29.
40. Kpee, F.; Ozioma, E.; Ihunwo, L.; J. Appl. Sci. Environ. Manage.
2009, 13, 63.
41. Miller, D. D.; Damodaran, S.; Parkin, K. L.; Fennema, O. R.; Química de Alimentos de Fennema, 4a ed.; Artmed: Porto
Alegre, Brazil, 2010.
42. Lima Junior, R. G. S.; Araújo, F. G.; Maia, M. F.; Pinto, A. S. S. B.; Environ. Res. A 2002, 89, 171.
43. Imyim, A.; Daorattanachai, P.; Fuangfa, U.; Anal. Lett. 2013,
46, 2101.
44. Bugallo, R. A.; Segade, S. R.; Gomez, E. F.; Talanta 2007, 72, 60.
45. AOAC (US), Official Methods of Analysis. Appendix F:
Guidelines for Standard Method Performance Requirements;
Association of Official Analytical Chemists (AOAC): Washington, 2012.
46. http://portal.anvisa.gov.br/documents/33916/393845/ RDC%2Bn%25C2%25BA%2B42_2013_final.pdf/eec629cf-8d17-422b-a362-366b275c1a00, accessed in July 2017. 47. Saei-Dehkordi, S. S.; Fallah, A. A.; Microchem. J. 2011, 98,
156.
48. Akoto, O.; Bismark Eshun, F.; Darko, G.; Adei, E.; Int. J. Chem. Environ. Res. 2014, 8, 403.
49. Morgano, M. A.; Rabonato, L. C.; Milani, R. F.; Miyagusku, L.; Balian, S. C.; Food Control 2011, 22, 778.
50. Repula, C. M. M.; Campos, B. K.; Ganzarolli, E. M.; Lopes, M. C.; Quináia, S. P.; Quim. Nova2012, 35, 905.
51. Sanches Filho, P. J.; da Fonseca, V. K.; Holbig, L.; Ecotoxicol. Environ. Contam. 2013, 8, 105.
Submitted: March 29, 2017
Published online: July 18, 2017
FAPERGS/CAPES has sponsored the publication of this article.