837
1 Universidade Federal de São Carlos (UFSCar), Departamento de Ciências da Natureza, Matemática e Educação
(DCNME), Araras, SP, Brasil. E-mail: <estefanovv@cca.ufscar.br>.
2 Universidade Estadual Paulista (UNESP), Faculdade de Engenharia, Departamento de Física e Química, Ilha
Solteira, SP, Brasil.
3 Centro Regional Universitário de Espírito Santo do Pinhal (UNIPINHAL), Espírito Santo do Pinhal, SP, Brasil. 4 Faculdade SESI de Educação, São Paulo, SP, Brasil.
5 Universidade Municipal de São Caetano do Sul (USCS), São Caetano do Sul, SP, Brasil.
Evaluation of concepts regarding the construction of
scientific knowledge by the congenitally blind:
an approach using the Correspondence Analysis method
Avaliação de concepções a respeito da construção de
conhecimentos científicos por cegos congênitos: uma
abordagem através do método de Análise de Correspondência
Estéfano Vizconde Veraszto1
.
http://orcid.org/0000-0002-4029-4803 Eder Pires de Camargo2.
https://orcid.org/0000-0003-2577-9885 José Tarcísio Franco de Camargo3.
https://orcid.org/0000-0001-5451-4494 Fernanda Oliveira Simon4.
http://orcid.org/0000-0002-4462-9498 Nonato Assis de Miranda5.
https://orcid.org/0000-0001-6592-3381Abstract: The inclusion of people with special needs in the school environment is one of the current challenges of Brazilian education. Knowing how people in this environment perceive inclusion can contribute to the construction of solutions that make it complete. Thus, this work presents a study that investigated the conceptions that future teachers, undergraduates in science, have regarding the construction of scientific knowledge by congenitally blind people, in particular, regarding the understanding of the concept of light. The collected opinions were treated from a statistical point of view, through the Correspondence Analysis method. The results show there is no definitive consensus regarding the understanding and construction of the concept of light by congenitally blind individuals, showing the need to develop more adequate educational interventions in the teacher training process, with a view to the formation of educators capable of consolidating school inclusion.
Keywords: Inclusive education. Blindness congenital. Teacher training. Statistical analysis. Special education. Resumo: A inclusão de alunos com necessidades especiais no ambiente escolar é um dos desafios atuais da educação brasileira. Conhecer como alunos de licenciatura percebem a inclusão pode contribuir para a construção de soluções que tornem o processo mais próximo do ideal. Assim, este trabalho apresenta um estudo sobre as concepções que futuros professores, graduandos em licenciatura em ciências, têm a respeito da construção de conhecimentos científicos por cegos congênitos, em particular, a respeito da compreensão do conceito de luz. As opiniões coletadas foram tratadas sob o ponto de vista estatístico, através do método de Análise de Correspondência. Os resultados obtidos mostram que não há um consenso definitivo a respeito da compreensão e construção do conceito de luz por cegos congênitos, indicando a necessidade de desenvolvimento de intervenções educativas mais adequadas no processo de formação de professores, tendo em vista a formação de educadores capazes de consolidar a inclusão escolar.
Introduction
The number of students with Special Educational Needs (SEN) enrolled in Brazilian
schools has increased significantly in recent years. This can be proved by observation of na -tional school census data for 2012, where that number – which includes the congenitally blind students – jumped from 43,923 in 1998 to 620,777 in 2012 (INEP, 2013). Other recent numbers also show that the total of SEN students in regular classrooms has increased by 27.6% between 2011 and 2015, from 58,412 to 74,534 respectively (INEP, 2012, 2015). Such indicators show the positive consequences of laws on special education and inclusion in Brazil. In this scenario, even if only the presence of the student with SEN in the school environment does not guarantee their actual inclusion, our society would have an exclusive character without it (BRASIL, 1995, 2013; CAMARGO et al., 2013).
In this context, preliminary researches classified the understanding of teachers and
students regarding the process of construction of knowledge in science by congenitally blind individuals (VERASZTO; CAMARGO, 2015; VERASZTO; CAMARGO; CAMARGO, 2016a, 2016b, 2016c; VERASZTO et al., 2014, 2017a, 2017b). It can be observed how the actors present in the educational environment perceive the process of inclusion of students with SEN. With the prospect of grounding the understanding of this question, these previous investigations were centered in teachers-in-training. Now, in a second moment, the same instrument has been applied to a sample of students of degree courses in Physics, Chemistry and Biological Sciences, with the purpose of observing how the future teachers understand inclusive education.
Considering this aspect, this work also aims to compare the results of this research with previous researches, searching for elements that corroborate the existing results and also provide additional information that can bring new orientations to researches. To do so, the data from previous surveys will be taken up and compared with the one from the new sample. In addition, different analytical techniques were used to increase the possibilities of understanding the data. The research instrument, which will be presented in greater detail in subsequent topics, is composed of questions that involve the topic of conceptualization in science. In this sense, each question, even with particularities, is part of the same set of ideas, thus allowing a comprehensive analysis.
Theoretical assumptions
At first, it is important to point out that inclusion counteracts standardization and
That said, it is important to point out that previously published papers have presented preliminary results on how undergraduate students understand the process of conceptualization in sciences by congenitally blind individuals (VERASZTO; CAMARGO; CAMARGO, 2016a, 2016b, 2016c; VERASZTO; CAMARGO, 2015; VERASZTOet al., 2014). In addition, inves-tigations have also been developed that answered the same questions considering high school students (VERASZTO et al., 2017a, 2017b). These researches have been able to systematize categories that show how the researched public understands the process of conceptualization in sciences by congenitally blind individuals. These categories are summarized in Chart 1 which comprehensively presents the results.
Chart 1. Categories for analysis of the conceptualization process in sciences by congenitally blind
individuals
Categories Definitions according to analyzed responses
Learning Research has shown that the term “learn” has appeared significantly in responses related to teaching science to blind individuals. Usually, the term appeared related to some theory of learning.
Capacity A sensory deficiency would not be an obstacle for the congenitally blind to become a scientist.
Cognition and Perception
The category shows the research has found that many individuals consider sensory perception to be fundamental to cognitive development.
Compensation through other senses
The blind or visually impaired individual is often “compensated” by other senses, according to the opinion of the individuals interviewed in these studies. It is possible to explain that the researched subjects meant blind or individuals with low vision, since the blindness (congenital or acquired) is also considered as a visual deficiency.
Creativity and abstraction
Creativity was another element researched. Often respondents have used the term “imagination” to explain processes of abstraction of scientific concepts. It depends Many individuals did not know how to position themselves regarding the
processes of conceptualization in sciences by the blind. Either they did not know how to give correct answers, or they identified situations they find conflicting in science teaching for the blind.
Ignorance of the concept of light
Many of the surveyed individuals are unaware of the nature of light. Others gave wrong explanations regarding the scientific framework. Thus, the category has answers that did not present enough scientific knowledge regarding the approached theme.
Difficulties for inclusion
Inclusion is possible, but difficult to be implemented because higher education institutions are not prepared to receive blind students.
Empowerment The process by which a person uses their personal power (inherent to their condition) to make choices and decisions, taking control of their life, is critical. The term relates to abstract concepts such as willpower.
Impossibility Category that arose from unbelief in considering that a blind individual could become a scientist.
Categories Definitions according to analyzed responses
Modifications and adaptations of the environment
It points out the need for adaptation and modification of the environment to provide adequate conditions for the inclusion of a blind individual.
Role of society (or social mediation)
It signals that the success of a blind individual is directly related to the explanation of teachers, classmates, family, or society.
Support resources It deals with resources to support Physics Education for students with visual impairment, such as the use of tactile and auditory resources, technological and assistive resources, etc.
Source: prepared by authors.
To establish landmarks that define limits for a person to be considered blind, according
to Decree 5.296 (BRASIL, 2004), there are two distinct categories: those that are blind and those with low vision. It is considered blind the person whose visual acuity in the best eye and with the best optical correction is less than 20/400 (0.05) – that is, this individual sees at 20m of distance what a person with a common vision would see 400m away. Therefore, from the legal point of view, the concept of blindness cannot be confused with total absence of vision. Thus, individuals with visual acuity lower than that cited are considered blind, even if they can see shadows or some images. It is considered a person with low vision anyone whose visual acuity, in the best eye and with the best optical correction, is less than 20/70 (0.3) and greater
than 20/400 (0.05), or yet where the sum of the visual field measure in both eyes is equal to or
less than 60°; or the simultaneous occurrence of any of the above conditions (CAMARGO, 2012a, 2012b).
Defining visual impairment in a comprehensive and objective way involves much more
than just considering it as an organic, sensory phenomenon. In this sense, blindness should be considered primarily a social phenomenon, since society, in its contexts, spaces, and attitudes, was structured by the standard and the ideal of the normality of those who can see. According to Camargo (2016a), this means the majoritarian procedures common to the dominant way of being, perceiving, thinking, acting, living is based on a visual society.
Omote (1980) points out that distinct types of deficiencies have been addressed only
from the medical point of view. According to this approach, the source of the visual impair-ment lies in the person themselves. However, this is a much more complex phenomenon, since
disadvantaged conditions and socially constructed limitations, such as in school, influence the
quality of social participation of individuals – then producing disability.
Particularly in relation to blindness, Vygotsky (1997) further shows that this is not limited to lack of vision or defect in a particular organ, but in fact, implies a deep restructuring of the whole organism and the personality of the visually impaired. Blindness, by creating a
personality configuration, provides willpower to non-existent forces in individuals, changes
certain functions of the organism, restructures and forms in a creative and organic way all the psychological characteristics of man.
Thus, this work is based on aspects that point to socio-educational inclusion as the most appropriate way for the limitations caused by social barriers to be overcome in the teach-ing-learning process.
Methodology
The research is based on two methodological approaches: quantitative and qualitative. In this sense, it is understood that a complementary relationship between such approaches aims to bring better understandings on said object (CHEN, 1997; PATTON, 1980).
Target audience
The research had data from 47 undergraduate students in Nature Sciences at a university in the interior of the State of Sao Paulo. We analyzed data from 22 undergraduate students in Biological Sciences (denominated in this research from B20 to B41), 8 undergraduate students in Physics (denominated in this research from F11 to F18) and 17 undergraduate students in Chemistry (denominated in this research from Q12 to Q28).
Throughout their undergraduate studies, investigated audience has maintained contact with issues related to inclusive education in disciplines that address this topic. However, the
disciplines work with the theme on specific topics throughout the course. There are no com -pulsory disciplines created for this sole purpose. In this sense, it is possible to point out that the theme of Inclusive Education is approached in methodology classes, guidance to teaching practice classes and internship. In addition, it worth mentioning that there is a discipline that focuses on the theme of inclusion and special education, but it is not mandatory for the courses in question. Some students take this discipline on an optional basis, but it does not reach the entire surveyed audience.
Research instrument
The questions of the research instrument were elaborated with Leontiev (1988) who points out that
If we mentally exclude the function of colors, the image of reality in our consciousness will gain the pallor of a black and white photograph. If we block our hearing, our picture of the world will be as poor as a silent movie compared to one with sounds. However, a blind person can become a scientist and create a new, more perfect, theory about the nature of light, although the sensory experience they may have of light is as small as that which an ordinary person has of the speed of light (LEONTIEV, 1988, p. 13).
These considerations motivated the elaboration of the research questions:
Q1. Considering a person blind since birth, reflect and respond with all tranquility
and sincerity. [Q1.1]. Is it possible for them to become a scientist? Explain. [Q1.2]. Can they understand the nature of light? Explain.
Q3. The sensory experience that a congenitally blind person (that is, blind since birth) may have of the light is as small as that which an ordinary person has of the speed of light. Do you agree or disagree with the statement presented? Explain.
These questions – even though they differ from each other – deal with conceptual-ization in science. Thus, the option of doing the joint analysis was due to the integrity of the analysis regarding the researched topic. In this sense, it is possible to point out that the total corpus, encompassing the answers to the four questions, is monothematic. The results – even involving different answers – deal, in a general way, with the process of conceptualization in sciences by congenitally blind individuals. Question 1.1 discusses the possibility of a blind person becoming a scientist, question 1.2 addresses the process of understanding the concept of light, and question 2 addresses processes of understanding general concepts of physics. In addition,
question 3 deals with the theme with a specific example, relating again to the concept of light.
Plus it is possible to complement it by stating that the set of answers of each individual, for the 4 questions, shows their opinion on the theme.
Methods and techniques for data analysis
Initially, Content Analysis techniques (BARDIN, 2004) were chosen to analyze issues isolatedly. Subsequently, for the analysis of data involving quantitative methods, the application of Correspondence Factor Analysis was chosen. However, in a complementary way, and to
initially define consistently the constructs, the Descending Hierarchical Classification Method
(CHD) was also applied. Student responses were analyzed using the IRAMUTEQ software (Interface de R pour les Analyses Multidimensionnelles de Textes et de Questionnaires). It is a free open source software, developed by Pierre Ratinaud (CAMARGO; JUSTO, 2013a, 2013b; LAHLOU, 2012; RATINAUD; MARCHAND, 2012) and licensed by GNU GPL (v2) which allowed the researches to make statistical analyzes on the textual corpus and on individuals/words tables. Each analysis method will then be described in detail.
Descending hierarchical classification
With the aid of IRAMUTEQ, the initial analysis was performed by the Descending
Hierarchical Classification Method (CHD), where the students’ answers were classified according
to their respective vocabularies and the words were distributed according to the frequency of the reduced forms (CAMARGO; JUSTO, 2013b). Thus, from matrices intersecting segments of texts and words in repeated qui-square tests (X²), the CHD method was applied to get a stable
classification (CAMARGO; JUSTO, 2013b). This analysis allowed to get classes of segments
Factorial Correspondence Analysis
Factorial Correspondence Analysis (AFC) is especially suitable for describing matrices
with a large amount of discrete data and without a structure clearly defined a priori. This method allows the visualization of the most important relations of a great set of variables to each other. The results are given as graphs, where the categories of each variable (or the variables of each category) are represented and where the relations between them can be observed through the distance between their coordinates (CARVALHO; STRUCHINER, 1992). Thus, to interpret the AFC, one must consider that proximity shows the level of association between the row or column categories. Therefore, it is possible to consider:
i. Association between row column categories. AFC allows a researcher to examine the association between single row or column categories. In this sense, categories can be compared to see whether two can be combined – because they are close on the map – or whether they actually provide discrimination, being located separately in the perpetual space.
ii. Association between row and column categories. It allows an analysis of the rela-tionship between two distinct categories. Variables present in opposite quadrants have greater independence; variables that appear on the same row, or column, have a dependency.
Similarity Analysis
This analysis is based on the theory of graphs and allows researchers to identify the co-occurrences between words. The result generated by the analysis of the software brings
indi-cations of the connection between the words, aiding in the identification of the representation
structure (CAMARGO; JUSTO, 2013b).
Data Analysis
Before presenting the analyzes performed with the help of Iramuteq, the questions were analyzed individually and a simple frequency count was undertaken.
Table 1 allows the identification of the agreement (or not) of respondents regarding
each of the questions proposed in the research instrument.
Table 1. Frequency analysis of the presented answers
Answers/
questions
Biological Sciences Physics Chemistry
Total % 1.1 1.2 2 3 1.1 1.2 2 3 1.1 1.2 2 3
Yes 17 11 19 8 8 8 8 2 15 15 16 11 138 73,4
No 4 3 0 1 0 0 0 2 1 1 0 1 13 6,9
It depends 1 1 2 0 0 0 0 1 1 1 1 0 8 4,3
Doesn’t know 0 7 1 13 0 0 0 3 0 0 0 5 29 15,4
Source: prepared by authors.
In this brief analysis, it was identified that the majority (73.4%) of the respondents
tech-niques (BARDIN, 2004), the answers went through the categorization process and the results can be seen in Table 2.
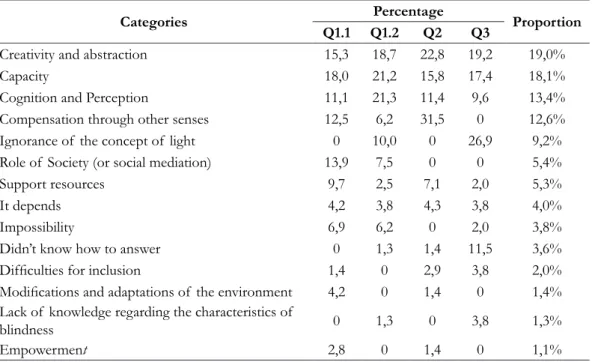
Table 2. Content Analysis of the answers obtained
Categories Percentage Proportion
Q1.1 Q1.2 Q2 Q3
Creativity and abstraction 15,3 18,7 22,8 19,2 19,0%
Capacity 18,0 21,2 15,8 17,4 18,1%
Cognition and Perception 11,1 21,3 11,4 9,6 13,4%
Compensation through other senses 12,5 6,2 31,5 0 12,6%
Ignorance of the concept of light 0 10,0 0 26,9 9,2%
Role of Society (or social mediation) 13,9 7,5 0 0 5,4%
Support resources 9,7 2,5 7,1 2,0 5,3%
It depends 4,2 3,8 4,3 3,8 4,0%
Impossibility 6,9 6,2 0 2,0 3,8%
Didn’t know how to answer 0 1,3 1,4 11,5 3,6%
Difficulties for inclusion 1,4 0 2,9 3,8 2,0%
Modifications and adaptations of the environment 4,2 0 1,4 0 1,4% Lack of knowledge regarding the characteristics of
blindness 0 1,3 0 3,8 1,3%
Empowerment 2,8 0 1,4 0 1,1%
Source: prepared by authors.
Considering the preliminary researches presented in the theoretical basis, it was pos-sible to verify that the answers have strong adherence to previously established categories. In addition, to consolidate the research in a comprehensive manner, as proposed in the objectives of the work, all questions were analyzed jointly using statistical techniques executed with the help of the Iramuteq software. The steps of analysis will be described next, along with the presentation of the results found.
Results obtained with the CHD method
Initially, the CHD analysis method was used and the Simple Sur Textes module was chosen, which performed the analysis considering the texts without dividing them into text segments. This analysis is recommended for short answers. At this stage of the research, the software analyzed the 188 texts – corresponding to the 4 questions – together, dividing the
corpus into 198 text segments. In this analysis, 4813 occurrences were found, divided into 4 categories in a time of 8 seconds.
A parenthesis was opened to explain that corpus is the set of information analyzed. With this research, it is the transcription of the answers of the applied instrument; Texts are
responses from 47 individuals with 4 questions each; Text segments are text excerpts, usually the size of three lines, sized by the software considering the size of the corpus; Number of occurrences
is the total number of words analyzed by the software.
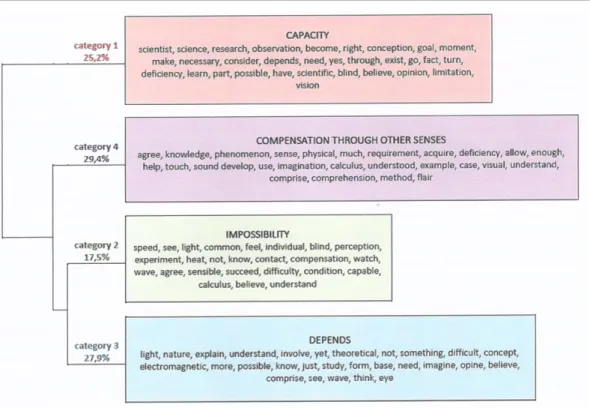
As a result, four categories were obtained which, due to their structures and consti-tutions, are similar to the categories already found in previous researches and presented in the theoretical foundations of this article (Chart 1). These categories are “Capacity,” “Impossibility,” “It depends,” and “Compensation through other senses.”
Analyzed together, the questions showed a polarization of the respondents’ conceptions.
Of the total, 25.2% of the corpus shows positive responses to the questions (Capacity category) against 17.5% of the corpus showing negative responses (Impossibility category). However, the analyzed corpus also points out that 27.9% of the respondents show dubious answers (It depends), presenting positive and sometimes negative clues to the proposed questions. These three categories together account for 70.7% of the corpus. The fourth category – Compensation through other senses – represents 29.4% of the corpus, constituting thus the largest category
found in the general analysis of the instrument. The results so far described briefly can be
found in summarized in Figure 1.
Figure 1. Conceptualization in sciences by congenitally blind individuals: synthesis of the results
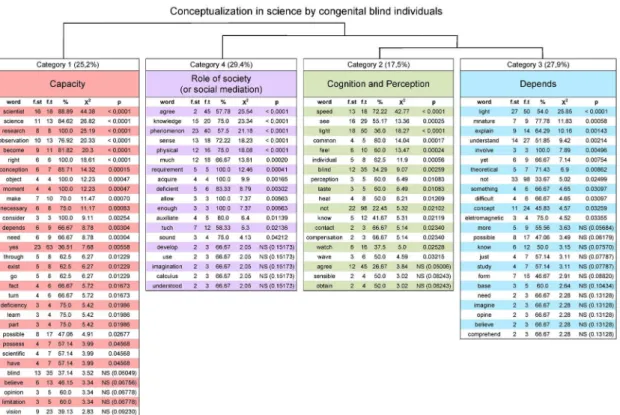
To give greater consistency to the categories found through the CHD method, each
word had its adherence to the category verified. The level of significance for each word was
also checked. Thus, Figure 2 presents the result of this analysis, which sought to eliminate occurrences that are not representative of the analysis process (such as articles, prepositions, and conjunctions).
It should be noted that the criteria to include the words in the categories are frequency (f) greater than the mean number of occurrences in the corpus and the association with the class determined by the qui-square value (Χ²) equal to or greater than 3.841, considering the
calcu-lation for this test is defined according to level of freedom 1 and significance of 95% (HAIR
et al., 2005; LEVIN; FOX, 2004; PESTANA; GAGEIRO, 2000).
Figure 2. Application of the CHD Method
Subtitle: f.st.: number of text segments that contain the word in the cluster; f t: (frequency) number of text
segments in the corpus containing the word quoted at least once; %: relative frequency; Χ²: qui-square of the association of the word with the cluster; P: identifies the level of significance of the association of the word with
the cluster.
Source: prepared by authors.
significance of the word with the class. With this research, we worked with a significance level of 0.05. Thus, for each p ≤ 0.05, the test is considered significant, and the word belongs to the
class stipulated by the software. Fisher’s Significance Grade (Table 3) is considered for analysis.
Table 3. Fisher’s Significance Grade
p-value 0,100 0,050 0,025 0,010 0,005 0,001
Nature of the evidence marginal moderate substantial strong very strong strongest
Source: Bussab and Morettin (2003).
Considering these references, each class was analyzed and words that did not meet the chosen standards were excluded. It should also be noted that the texts were analyzed in their
entirety, respecting the writing of the students investigated. For the final construction of the
clusters, articles, prepositions, and contractions were excluded.
Results obtained with AFC
AFC aims to measure the association of the categorized variables. With this study, the
software categorized the variables previously, as shown in the previous topic. It has also been shown that each category is composed of a set of words and these can be plotted on a graph when applying the AFC since each word has frequency and X², which show its adherence to the category. Considering this, AFC allows researchers to investigate the relationship of depen-dence between variables (rows and columns are composed of the same variables and arranged in a Cartesian graph). One way to analyze AFC is to consider it as a method of decomposition of total inertia, identifying a few dimensions that best represent a cloud of points. Thus, the
problem comes down to finding the line that best fits the five points (profiles). The best line
passes through the centroid “c”, which is a dimensionless summary (a dot). If the origin of the
graph is transferred to “c”, then the line that best fits is the main auto-vector of the asymmetric
matrix (CARVALHO; STRUCHINER, 1992).
AFC generated two graphs (Figures 3 and 4) from different tests. The first graph (Graph
1) was constructed from the calculated X² for the variables. In the upper corner of both graphs (Graphs 1 and 2), a miniature representing the categories according to the center of mass was
placed. As a graphic resource, in order not to shuffle all the words in the visual representation,
it was chosen to differentiate the categories by color.
It must be noted that Graph 1, Graph 2 and Figure 3 are presented in Portuguese because this is the native language of the individuals that participated in this research.
Then, we have:
a) Category 1 – Capacity – is colored red;
b) Category 2 – Cognition and Perception – is colored green; c) Category 3 – It depends – is colored blue;
Graph 1. AFC with size of variables proportional to X²
Source: Iramuteq (2014).
Analyzing the results, it is possible to verify that categories 2 and 3 are in the same quadrant and have their mass centers near. This shows that these two categories depend highly on each other. Because they are on the same line, categories 1 and 3 also have dependence. And categories 3 and 4 are also dependent to a certain extent because they are almost in the same column.
Graph 2. AFC with the size of variables proportional to frequency
Source: Iramuteq (2014).
Categories 1 and 4 are in opposite quadrants. This shows that these categories have less dependence on each other.
Interpreting the results, some considerations are made:
a) Categories 2 (Cognition and Perception) and 3 (It depends) present high dependence. This may show that respondents – even if they consider that congenitally blind individuals can understand physical concepts and become scientists – are not fully convinced of this. Many of the respondents indicated that the cognition of those who can see and those who are blind is similar, but they also pointed out that many situations that may involve
sci-entific work cannot be totally dominated by the congenitally blind individual. To corroborate with the statistical results, the transcription of a student’s answer is presented for two different
B31: Answer to Q1.2: [...] however much this cannot be observed, it is possible to know what light is, its nature.
B31: Answer to Q2: [...] As much as one tries to understand and perhaps do un-derstand the phenomena, it would be much easier to unun-derstand these phenomena – like colors, and other non-sensory or palpable phenomena.
b) Categories 1 (Capacity) and 3 (It depends) also have dependence, as already discussed. Again we have an analysis very similar to the previous one. That is, at the same time
the respondents affirm that the congenitally blind individual can understand scientific concepts,
the same respondents also position themselves in a dubious manner considering some aspects
that involve such affirmation. The following transcripts, student responses to two distinct
questions, corroborate this consideration:
Q15: Answer to Q1.1: Although the individual does not possess the visual notions of the [concepts and] phenomena, they can understand the events and theories of science through Braille readings or through audios.
Q15: Answer to Q1.3: I partially agree. Knowledge indeed suffices to understand
physical phenomena in theory, but being able to observe it visually sometimes may help to understand it better.
B40: Answer to Q1.1: There are risky situations that can be caused by blind people in laboratories for example, but this will depend on thinking of ways for these people to conduct their research.
B40: Answer to Q2: Seeing is not a requirement to study a certain subject.
c) Categories 3 (It depends) and 4 (Role of Society) can also be analyzed with the same logic. The categories have a certain dependence, showing that a lot of subjects still doubt the ability of the congenitally blind individual if he/she has no support from society. To highlight this consideration, the transcription of the following sections, answered by the same student, is presented:
Q27: Answer to Q1.1: I believe it’s not impossible, though it’s a long and arduous process, for a person who has never had contact with images to build their own conception of the world. In this way, there must be intense attention in the formation of this person. Q27: Answer to Q1.2: [...] you have to do your best to build the knowledge of a person who has never had contact with an image.
d) Categories 1 (Capacity) and 4 (Role of Society) are independent. Being in opposing quadrants may show that respondents are often polarized between the ability of the blind individual to understand sciences and become a scientist and the support of society. This may show that either the respondents believe the blind have an innate ability or that they will
succeed only if society fulfills the role of mediator in their formation process. The transcripts
B39: Answer to Q1.1: Yes, provided that the individual’s had access to education and has intellectual conditions for it.
B39: Answer to Q1.2: Even without sight, the theory of light, if passed to individuals correctly, is enough for a person to understand it.
B39: Answer to Q2: Not seeing the phenomenon does not mean an individual doesn’t recognize it.
B40: Answer to Q1.2: Yes, you only need to explain it in a way that the individuals can understand.
B40: Answer to Q2: I believe it’s not impossible, though it’s a long and arduous process, for a person who has never had contact with images to build their own conception of the world. In this way, there must be intense attention in the formation of this person.
The mathematical results complement previous studies and show that the AFC’s overall
analysis brings conclusions already presented in previous studies.
Looking at the graph that relies on the frequency of words, it is seen that the words “yes” and “no” stand out. Both are on the same line and each of them belongs to different categories. But they are very close and relatively similar in frequency. The word yes, in green, belongs to the category Cognition and Perception. The word no, in red, belongs to the category Capacity. This signals, roughly, that respondents often judge that the blind individual has no
ability to become a scientist (or understand scientific concepts), but also believe that they have
enough Cognition and Perception for such a process to occur.
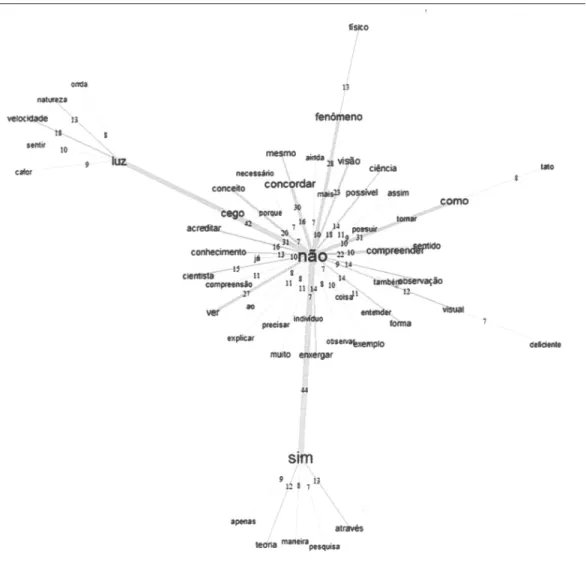
Similitude Analysis Results
The similitude analysis performed by the Iramuteq software can be seen in figure 3. The analysis of the figure presents interpretations similar to those already discussed
previously. However, before pointing out the results, it is important to note that the thick lines which appear on the graph indicate that the words joined by them appeared several times together in the same answer. This means that the thicker the lines joining two variables, the greater their dependencies within the textual corpus. With that said, it is possible to verify that the words “no” and “yes” are the variables that appear together the most in the answers.
In addition, it is possible to see three large groups of words.
The first large group is in the center of the figure with its central term the word “no,”
surrounded by other words such as “agree,” “knowledge,” “scientist,” “believe,” “understand-ing,” “explain,” “meaning” (only some of the most dependable ones have been highlighted). This grouping may show that the respondents do not agree with the idea that a blind individual
can understand scientific concepts.
However, this grouping is strongly related to the second group of words arranged in
the lower part of the figure. This new group is polarized by the word “yes,” linked to terms like
theory and research. Regarding this grouping, two observations can be made:
a) the first inference that can be made is that the level of uncertainty of the respondents is large. This is because the words “yes” and “no” have a strong dependence;
understand scientific phenomena and become a scientist, as long as their work is focused on
more theoretical experiments.
Figure 3. Similitude Analysis
Source: Iramuteq (2014).
All the interpretations presented so far are in line with the analyzes found through the application of the CHD and AFC methods.
Finally, there is the third group, on the left of the figure, which is centered by the word
a) the first shows an idea from common sense that blindness is compensated by
other senses. Even though this category was not clearly defined in the statistical analyzes pre -sented, the Content Analysis summarized in Table 2 shows that compensation through other senses is the fourth most present category. Thus, considering the analysis of the questions in an isolated way, it is possible to emphasize that 12.6% of the answers signal this information. To prove this assertion, Chart 2 presents excerpts from transcribed responses;
b) the second observation shown by this grouping of words was also found in
the Content Analysis. This finding is related to the category that shows the Ignorance of the
Concept of Light, present in 9.2% of the isolated responses. This statement can be made be-cause many respondents said it is possible to know light through the emanation of heat from
solar radiation. This assertion can be verified in Chart 2, in transcribed portions of answers.
Chart 2. Transcript of responses related to the categories found in the Similitude Analysis
Categories Transcript of some responses of the surveyed subjects
Compensation through other senses
B29: [...] blind people develop skills in other senses, and this allows them to know physical phenomena in another way or with another perception. B33: [...] we still have four other senses that could make that person experience physical phenomena.
F16: There are several phenomena that can be studied through some of the other senses.
Q24: Even with this visual deficiency, the individual can understand the
universe through other “receivers,” such as touch. Ignorance of the
concept of light
B29: Sensory feeling of light can be seen in various ways from the individual’s
perception.
B36: It is still possible to understand a little more about the speed of light, for example, when analyzing a lightning strike and the time it took for the sound to propagate.
F15: The blind can, in the presence of light, depending on its intensity, feel the heat emitted by it – while we have no perception of the speed of light. Q15: Depending on the sensitivity of the blind person, they may have notions of strong light [other than normal brightness or total darkness].
Source: prepared by authors.
Final considerations
With the purpose of contributing to the improvement of inclusive education, this work sought to verify how future teachers – students of undergraduate courses related to science
– perceive the construction of scientific knowledge by congenitally blind people. Particularly,
Based on the statistical analysis of the obtained results, it is possible to show that the respondents think that congenitally blind individuals can become scientists and of understanding
scientific concepts. But they also consider important for society to play its role of mediator in the basic and scientific training of these subjects. This attests to the discourse of inclusive
education, where all individuals and sectors of society must be responsible for the inclusive process, each one playing its role in science teaching (and all other curricular subjects) for in-dividuals with or without blindness – or with any other needs that may arise.
Finally, it is important to point out that the analysis found contradictory points in the
speeches of the surveyed individuals. In addition, the statistical analysis also verified this con -tradiction. Although the investigated subjects pointed out that congenitally blind individuals can understand physical concepts and become scientists, it was also possible to realize that they are not totally convinced of this. As presented in the analysis, many respondents, while showing that
the cognition of the sighted and the blind are similar, have also clarified that they understand that there are several situations that limit the scientific work for congenitally blind individuals.
Thus, it was evident in several transcribed speeches and also in the statistical analysis that the
investigated subjects affirmed that the congenitally blind individual can understand scientific
concepts, but they also believe that this would only be possible through social support in that
person’s formation process. In this way, we have results that signal strong contradictions in the
discourse of the investigated subjects. However, this contradiction can open space for new analyzes that are already being deepened and will be divulged in later works.
Acknowledgments
The authors thank FAPESP for the funding the research.
References
BARDIN, L. Análise de conteúdo. 3. ed. Lisboa: Edições 70, 2004.
BRASIL. Decreto nº 5.296 de 2 de dezembro de 2004. Regulamenta as Leis nos 10.048,
de 8 de novembro de 2000, que dá prioridade de atendimento às pessoas que especifica, e
10.098, de 19 de dezembro de 2000, que estabelece normas gerais e critérios básicos para
a promoção da acessibilidade das pessoas portadoras de deficiência ou com mobilidade
reduzida, e dá outras providências. Brasília, 2004. Retrieved from <http://www.planalto.gov. br/ccivil_03/_Ato2004-2006/2004/Decreto/D5296.htm>. Last accessed: 1 Oct. 2018.
BRASIL. Lei nº 12.796, de 4 de abril de 2013. Altera a Lei no 9.394, de 20 de dezembro de 1996, que estabelece as diretrizes e bases da educação nacional, para dispor sobre a formação
dos profissionais da educação e dar outras providências. Brasília, 2013. Retrieved from <http://www.planalto.gov.br/CcIVIL_03/_Ato2011-2014/2013/Lei/L12796.htm>. Last accessed: 1 Oct. 2018.
BUSSAB, W.O.; MORETTIN, P. A. Estatística básica. 5. ed. São Paulo: Saraiva, 2003.
CAMARGO, B. V.; JUSTO, A. M. IRAMUTEQ: um software gratuito para análise de dados textuais. Temas em Psicologia, Ribeirão Preto, v. 21, n. 2, p. 513-518, 2013b. Retrieved from <https://doi.org/10.9788/TP2013.2-16>. Last accessed: 1 Oct. 2018.
CAMARGO, B. V.; JUSTO, A. M. Tutorial para uso do software de análise textual
IRAMUTEQ. Florianópolis: Universidade Federal de Santa Catarina, 2013a.
CAMARGO, E. P. Ensino de ciências e inclusão escolar: investigações sobre o ensino
e a aprendizagem de estudantes com deficiência visual e estudantes surdos. Curitiba: CRV,
2016b.
CAMARGO, E. P. O perceber e o não perceber: algumas reflexões acerca do que
conhecemos por meio de diferentes formas de percepção. In: MASINI, E. F. S. (Org.). Perceber: raíz do conhecimento. São Paulo: Vetor, 2012b. p. 220-234.
CAMARGO, E. P. Saberes docentes mobilizados nos contextos da formação em licenciatura em física e dos estudantes com e sem deficiência visual. Tese (livre-docência) – Universidade Estadual Paulista, Ilha Solteira, 2016a. Retrieved from <http://hdl. handle.net/11449/143042>. Last accessed: 1 Oct. 2018.
CAMARGO, E. P. Saberes docentes para a inclusão do aluno com deficiência visual em aulas de física. São Paulo: Ed. Unesp, 2012a. Retrieved from <http://books.scielo.org/ id/zq8t6/pdf/camargo-9788539303533.pdf>. Last accessed: 1 Oct. 2018.
CAMARGO, E. P. et al. Adequate and inadequate communicational contexts for the inclusion of visually impaired students in electromagnetism classes. Journal of Emerging Trends in Educational Research and Policy Studies, Manchester, v. 4, n. 3, p. 413-423, 2013. Retrieved from <http://jeteraps.scholarlinkresearch.com/abstractview.php?id=65>. Last accessed: 1 Oct. 2018.
CARVALHO, M. S.; STRUCHINER, C. J. Análise de correspondência: uma aplicação do método à avaliação de serviços de vacinação. Caderno de Saúde Pública, Rio de Janeiro, v. 8, n. 3, p. 287-301, 1992. Retrieved from <http://www.scielo.br/pdf/csp/v8n3/v8n3a08>. Last accessed: 1 Oct. 2018.
CHEN, H. Applying mixed methods inder the framework of theory-driver evaluation. New
Directions for Evaluation, Hoboken, v. 1, n. 74, p. 61-72, 1997. Retrieved from <https://
doi.org/10.1002/ev.1072>. Last accessed: 1 Oct. 2018.
HAIR, J. F. et al. Análise multivariada de dados. Porto Alegre: Bookman, 2005.
INEP. Censo escolar da educação básica 2012: resumo técnico. Brasília, 2013. Disponível em: <http://download.inep.gov.br/educacao_basica/censo_escolar/resumos_tecnicos/ resumo_tecnico_censo_educacao_basica_2012.pdf>. Acesso em: 4 out. 2018.
INEP. Censo escolar da educação básica 2011: resumo técnico. Brasília, 2012. Disponível em: <http://download.inep.gov.br/educacao_basica/censo_escolar/resumos_tecnicos/ resumo_tecnico_censo_educacao_basica_2011.pdf>. Acesso em: 3 out. 2018.
IRAMUTEQ: interface de R pour les analyses multidimensionnelles de textes et de questionnaires: un logiciel libre construit avec des logiciels libres. Version IRaMuTeQ 0.7 alpha 2. 2014. Disponível em: <http://iramuteq.org/>. Acesso em: 3 out. 2018.
LAHLOU, S. Text mining methods: an answer to Chartier and Meunier. Papers on Social
Representations, Lisboa, v. 20, n. 38, p. 1-7, 2012. Retrieved from <http://psr.iscte-iul.pt/
index.php/PSR/article/view/453/397>. Last accessed: 1 Oct. 2018.
LEONTIEV, A. N. Uma contribuição à teoria do desenvolvimento da psique infantil. In: VIGOTSKI, L. S.; LURIA, A. R.; LEONTIEV, A. N. Linguagem, desenvolvimento e aprendizagem. São Paulo: Cortez, 1988. p. 59-83.
LEVIN, J.; FOX, J. A. Estatística para ciências humanas. São Paulo: Prentice Hall, 2004.
MANTOAN, M. T. E. Inclusão escolar: o que é? por quê? como fazer? São Paulo: Moderna, 2003.
OMOTE, S. A deficiência como fenômeno socialmente construído. In: SEMANA
DA FACULDADE DE EDUCAÇÃO, FILOSOFIA, CIÊNCIAS SOCIAIS E DA DOCUMENTAÇÃO, 21., 1980, Marília. (Conferência).
PATTON, M. Q. Qualitative evaluation and research methods. 2nd. ed. Newburry Park: Sage, 1980.
PESTANA, M. H.; GAGEIRO, J. N. Análise de dados para ciências sociais: a complementariedade do SPSS. 2. ed. Lisboa: Silabo, 2000.
RATINAUD, P.; MARCHAND, P. Application de la méthode ALCESTE à de “gros” corpus et stabilité des “mondes lexicaux”: analyse du “CableGate” avec IRAMUTEQ. In:
JOURNÉES INTERNATIONALES D’ANALYSE STATISTIQUE DES DONNÉES
TEXTUELLES, 11., 2012, Liège. Actes... p. 835-844. Retrieved from <http://lexicometrica. univ-paris3.fr/jadt/jadt2012/tocJADT2012.htm>. Last accessed: 1 Oct. 2018.
RODRIGUES, A.J. Contextos de aprendizagem e integração/inclusão de alunos com necessidades educativas especiais. In: RIBEIRO, M. L. S.; BAUMEL, R. C. R. (Org). Educação especial: do querer ao fazer. São Paulo: Avercamp, 2003. p. 13-26.
VERASZTO, E. V.; CAMARGO, E. P. Cegueira congênita e trabalho científico: um estudo
sobre a percepção de professores em formação em ciências da natureza In: SIMPÓSIO NACIONAL DE ENSINO DE FÍSICA, 21., 2015, Uberlândia. Atas... São Paulo: SBF,
2015. Retrieved from <http://www.sbf1.sbfisica.org.br/eventos/snef/xxi/sys/resumos/
T0575-1.pdf>. Last accessed: 1 Oct. 2018.
VERASZTO, E.V.; CAMARGO, E. P.; CAMARGO, J. T. F. A visão como requisito
para conhecimento de fenômenos físicos: um estudo da opinião de licenciandos. In:
ENCONTRO DE FÍSICA, 16., 2016, Natal. Atas... Natal: SBF, 2016b.
VERASZTO, E. V.; CAMARGO, J. T. F.; CAMARGO, E. P. Trabalho científico por cegos
congênitos: análise das respostas de licenciandos em cursos da área de ciências da natureza. In: ENCONTRO DE FÍSICA, 16., 2016, Natal. Atas... Natal: SBF, 2016c.
VERASZTO, E. V. et al. Análise das concepções de professores e alunos do ensino médio sobre a formação de conceitos físicos em indivíduos cegos. In: SIMPÓSIO NACIONAL DE ENSINO DE FÍSICA, 22., 2017, São Carlos. Atas... São Carlos: SBF, 2017a. Retrieved
from <http://www.sbf1.sbfisica.org.br/eventos/snef/xxii/sys/resumos/T0328-2.pdf>. Last accessed: 1 Oct. 2018.
VERASZTO, E. V. et al. Estudo com professores e alunos do ensino médio acerca da conceitualização em física por indivíduos cegos congênitos. In: SIMPÓSIO NACIONAL DE ENSINO DE FÍSICA, 22., 2017, São Carlos. Atas... São Carlos: SBF, 2017b. Retrieved
from <http://www.sbf1.sbfisica.org.br/eventos/snef/xxii/sys/resumos/T0328-1.pdf>. Last accessed: 1 Oct. 2018.
VERASZTO, E. V. et al. Professores em formação em ciências da natureza: um estudo
acerca da atuação de cegos congênitos em atividades científicas. Formação Docente, Belo Horizonte, v. 6, n. 10, p. 69-86, 2014. Retrieved from <https://www.revformacaodocente. com.br/index.php/rbpfp/article/view/87>. Last accessed: 1 Oct. 2018.
VYGOTSKI, L. S. La colectividad como factor de desarrollo del niño deficiente. In:
VYGOTSKI, L. S. Obras escogidas: fundamentos de defectología. Madrid: Visor, 1997. p. 213-234.
Submitted 04/29/2017. Accepted 05/23/2018.