Nasser A. S. Tuqan
SEFFICIENCY APPLICATION
IN WATER (RE)ALLOCATION POLICIES
Nasser A. S. Tuqan July, 2015 UMinho | 2015 SEFFICIENCY APPLIC A TION IN W A TER (RE)ALL OC A TION POLICIES
July, 2015
Master Dissertation
Master Program in Urban Engineering
Supervisor:
Prof. Naim Haie
Nasser A. S. Tuqan
SEFFICIENCY APPLICATION
i
Abstract
Water is globally scarce and highly competitive among several users. In fact, UN estimates that more than 40% of the global population is projected to be living in areas of severe water stress through 2050. The only foreseeable way to deal with this scarcity is by well-managing the available and accessible resources. The objective of this work is to promote water efficient use through systemically measuring the performance of a defined water system (WS) using sustainable efficiency (Sefficiency) as a tool. The general framework of Sefficiency, which is an advanced
efficiency indicator that considers the usefulness criterion (water quality and beneficence characteristics), was suggested and detailed by Haie, et al. in their 2012 paper. In order to achieve the final efficiency results after the selection of a WS, data collection and acquisition processes are needed to characterize the WS under consideration quantitatively, qualitatively and beneficially. Tomato crop farmlands located in Davis City, Yolo County at the west bank of the largest river in California State, Sacramento River, were selected as a WS because of the seriousness of water drought series in addition to the distinguished economic value of agriculture there. The Sefficiency results of the WS under consideration showed relatively inefficient
performance at the local level inside the system; symptoms of polluting impacts by the WS on the river; and considerably satisfactory recharge to the main source.
Resumo
A água está globalmente escarça e altamente competitiva entre muitos usuários. A ONU estima que mais de 40% da população mundial deverá viver em áreas com graves problemas hídricos até 2050. A única maneira previsível para lidar com essa escassez é por meio da boa gestão dos recursos disponíveis e acessíveis. O objetivo desse trabalho é promover o uso eficiente da água através da medição sistemática do desempenho de um determinado sistema hídrico (water
system/WS) usando como ferramenta a eficiência sustentável (sustainable efficiency/Sefficiency). A
estrutura geral de Sefficiency — um indicador avançado de eficiência que considera o critério de
utilidade (características de beneficência e qualidade da água) — foi sugerido e detalhado por Haie, et al. em seu artigo de 2012. A fim de alcançar os resultados de eficiência finais após a seleção de um WS, são necessários processos de aquisição e coleta de dados para caracterizar o WS segundo considerações quantitativa, qualitativa e benéfica. Foram selecionados como WS fazendas de cultivo de tomate localizadas em Davis City, Yolo County, na margem ocidental do Rio Sacramento, o maior rio do estado da Califórnia, por causa dos graves e constantes períodos de seca, além do notável valor económico da agricultura naquele local. Os resultados de Sefficiency
do WS sob consideração mostraram um desempenho relativamente ineficiente no nível local de dentro do sistema: sintomas de impacto de poluiçãoo no rio pelo WS e recarga consideravel-mente satisfatória para a fonte principal.
ii
Table of Contents
Abstract ... i Resumo... i Table of Contents ... ii List of Figures... iv List of Tables ... iv Abbreviations ... v INTRODUCTION ...1 Water on Earth ...1 Water Scarcity ...2Water Use Sectors ...4
Objectives ...5
LITERATURE REVIEW ...7
Management Approaches ...7
Water (Re)allocation Policies ...9
Water Use Efficiency ...10
METHODOLOGY...12 WS Alternatives ...12 Characterizing the WS ...16 3.2.1 Water Quantity ...16 3.2.2 Water Quality ...19 3.2.3 Water Beneficence...21 WS Performance...21 (Re)allocation Policies ...24 APPLICATION ...25 WS Selection...25 WS Characteristics ...27
4.2.1 Quantitative Characteristics of the WS ...27
4.2.2 Qualitative Characteristics of the WS ...34
iii
WS Sefficiency ...40
Results Interpretation and Allocation Policies ...44
CONCLUSION ...47
Conclusive Remarks ...47
Future Works ...48
iv
List of Figures
Figure 1-1: Distribution of Earth's Water ...1
Figure 1-2: Global Physical and Economic Surface Water Scarcity...2
Figure 1-3: MDG 7 Infographic ...3
Figure 1-4: Global Water Demand (2000 & 2050) ...4
Figure 2-1: Paradigm Shifts in Water Management Levels ...8
Figure 2-2: Adaptive Management Cycle ...8
Figure 3-1: Location of Guadiana River ...13
Figure 3-2: Palestinian Aquifers ...14
Figure 3-3: Sacramento River Basin ...16
Figure 3-4: Water Flow Paths Diagram ...17
Figure 3-5: Isohyetal Map Example ...17
Figure 3-6: Conceptual Model of CCME WQI ...20
Figure 3-7: Priority Triangle ...24
Figure 4-1: WDR 2012 Report Cover Page ...26
Figure 4-2: Davis City and Yolo County ...26
Figure 4-3: Isohyetal Map of Davis City...32
Figure 4-4: WS Schematic ...33
Figure 4-5: Sefficiency Final Results ... Erro! Indicador não definido.
List of Tables
Table 4-1: Sample of CIMIS Raw Data ...30Table 4-2: Sample of ETo Final Results ...31
Table 4-3: Difference between CIMIS and Calculated ETo ...31
Table 4-4: Summary Table of WS Quantitative Characteristics ...33
Table 4-5: Sample of Water Quality DWR Data...36
Table 4-6: CCME WQI Results for 𝑊𝑞𝑉𝐴 ...37
Table 4-7: Summary Table of WS Quantitative and Qualitative Characteristics...38
Table 4-8: Summary Table of WS Characteristics ...39
Table 4-9: Usefulness Criterion Results ...40
Table 4-10: Summary of the WS Variables' Beneficial Values & Useful Values ...41
v
Abbreviations
℃ Degree Celsius
3ME Macro, Meso and Micro-Efficiency 𝑎𝑓 Acre-feet
AU Agronomic Use
BEA Bureau of Economic Analysis CA California State
CCME Canadian Council of Ministers of the Environment
CCSCE Center for Continuing Study of the California Economy
CE Classical Efficiency
CGE Computable General Equilibrium CIA Central Intelligence Agency CIMIS California Irrigation Management
Information System 𝑐𝑚 Centimeter
CWQG Canadian Water Quality Guidelines CWQI Canadian Water Quality Index 𝑑𝑆/𝑚 deciSiemens per meter EE Effective Efficiency ET Evapotranspiration
FAO Food and Agriculture Organization 𝑓𝑡. Feet
GDP Gross Domestic Product
GDWQI Global Drinking Water Quality Index
GIS Geographic Information System ℎ𝑎 Hectare
IHP International Hydrological Program 𝑖𝑛. Inch IS Irrigation Sagacity 𝑘𝑚 Kilometer 𝑘𝑃𝑎 Kilo Pascal LR Leaching Factor 𝑚 Meter
𝑀𝐶𝑀 Million Cubic Meter
MDG Millennium Development Goals 𝑚𝑔/𝐿 Milligram per Liter
𝑚𝑚 Millimeter
N.T.U. Nephelometric Turbidity Units NR Non-Reusable
OS Other Sources
OSP Occupied State of Palestine PM Penman Method
PP Precipitation
PWA Palestinian Water Authority 𝑟𝑎𝑑 Radian
RF Return Flow RP Potential Return SA Abstraction Savings
SC Consumptive Savings
SDG Sustainable Development Goals UN United Nations
UNEP United Nations Environmental Program
UNESCO UN Educational, Scientific and Cultural Organization
USA United States of America USD United States Dollar
USGS United States Geological Survey VA Volume of water Abstracted VD Volume of water Downstream VU Volume of water Upstream 𝑊𝑞𝑋 Quality weight of variable X 𝑊𝑏𝑋 Beneficence weight of variable X WB West Bank
WQI Water Quality Index WS Water System
WWAP World Water Assessment Program WWDR World Water Development Report
1
INTRODUCTION
Water is a life main component that guarantees creatures’ continuity. It is widely known that scientists have always indicated life existence by dihydrogen monoxide existence. Indeed, water is commonly considered as the most essential sector among natural resources (Vörösmarty, et al., 2010). Furthermore, water is undoubtedly a wealth indicator, a vital element for human health and hygiene, an important factor for renaissance, a war cause, and a peace seeder.
Water on Earth
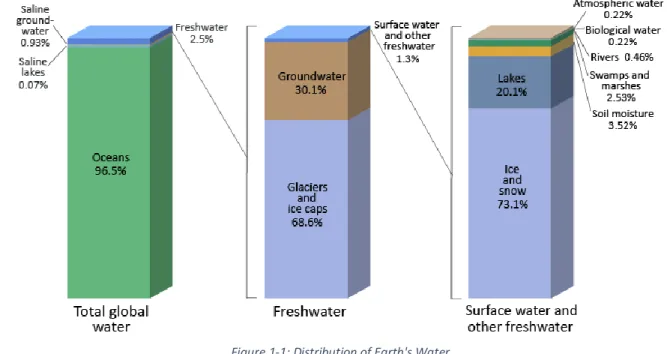
On our mother, earth, water covers 70.90% of its surface (CIA, 2013). As shown and detailed in figure 1-1, 96.50% of the planet’s water is found in seas and oceans, while 1.70% as groundwater (0.77% fresh and 0.93% saline). There are 1.70% in glaciers and the ice caps of Antarctica and Greenland, a small fraction in other large water bodies, and 0.001% in the air as vapor, clouds (formed of solid and liquid water particles suspended in air), and precipitation. Only 2.50% of the Earth’s water is freshwater, and 98.70% of that water are ice and groundwater. Less than 0.30% of all freshwater is in rivers, lakes, and the atmosphere, and a smaller amount of the Earth’s freshwater (0.003%) is contained within biological bodies and manufactured products (Gleick, 1993).
Figure 1-1: Distribution of Earth's Water Source: (Gleick, 1993)
It is important to understand that freshwater is continuously moving, flowing in rivers, evaporating and spreading as water vapor, falling as rain or snow, or being infiltrated slowly through the soil as groundwater (BIDLACK, et al., 2004). Water evaporates annually from the
2 oceanic surface (502,800 𝑘𝑚3) and from lands (74,200 𝑘𝑚3). The same amount of water falls as atmospheric precipitation (458,000 𝑘𝑚3 on oceans and 119,000 𝑘𝑚3 on lands). The difference between precipitation and evaporation from the land surface (44,800 𝑘𝑚3/𝑦𝑒𝑎𝑟) represents the total runoff of the Earth’s rivers (42,700 𝑘𝑚3/𝑦𝑒𝑎𝑟) and direct groundwater runoff to the ocean (2,100 𝑘𝑚3/𝑦𝑒𝑎𝑟). These are the principal sources of fresh water to support life essentials and human activities (Shiklomanov, 1998).
Water Scarcity
Freshwater is absolutely an essential element for human well-being and sustainable socio-economic development. According to the UN World Water Development Report of 2014, major regional and global crises – of climate, poverty, hunger, health and finance – that threaten the livelihood of many, especially the three billion people living on less than 2.50 𝑈𝑆𝐷/𝑑𝑎𝑦, are somehow interconnected through water (WWAP, 2014).
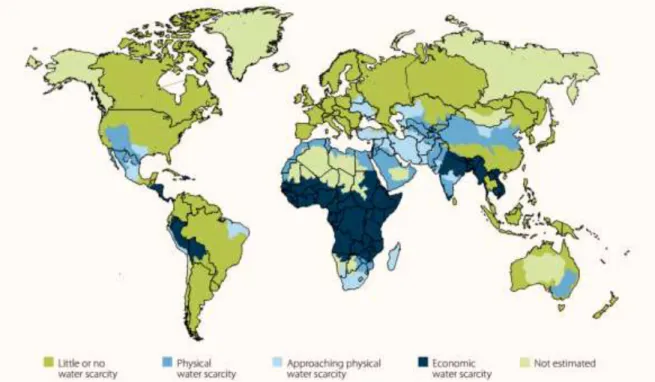
In many regions of the planet, water shortage is considered as one of the most crucial unresolved issues. One fourth of the world’s population lives in dry or semi-arid areas, where water supply chain management is evolving as one of the most difficult and urgent problems, since water demand and supply are significantly varying from year to year, seasonally and even daily (Kondili, et al., 2009). On the word of some estimates, the number of people whose right to water is not satisfied (regardless the reason) could be as high as 3.5 𝑏𝑖𝑙𝑙𝑖𝑜𝑛, while 2.5 𝑏𝑖𝑙𝑙𝑖𝑜𝑛 remain without access to improved sanitation. Figure 1-2 shows the global physical and economic surface water
Figure 1-2: Global Physical and Economic Surface Water Scarcity Source: (WWAP, 2014)
3 scarcity classified into five different classes regarding the type of water scarcity worldwide. The five classes, according to (WWAP, 2014), are defined as:
1. Little or no water scarcity: abundant water resources relative to use, with less than 25% of water from rivers withdrawn for human purposes.
2. Physical water scarcity (water resources development is approaching or has exceeded sustainable limits): More than 75% of river flows are withdrawn for agriculture, industry and domestic purposes. This definition – relating water availability to water demand – implies that dry areas are not necessarily water scarce.
3. Approaching physical water scarcity: More than 60% of river flows are withdrawn. These basins will experience physical water scarcity in the near future.
4. Economic water scarcity (human, institutional and financial capital limit access to water even though water in nature is available locally to meet human demands): Water resources are abundant relative to water use, with less than 25% of water from rivers withdrawn for human purposes, but malnutrition exists.
5. No available estimation.
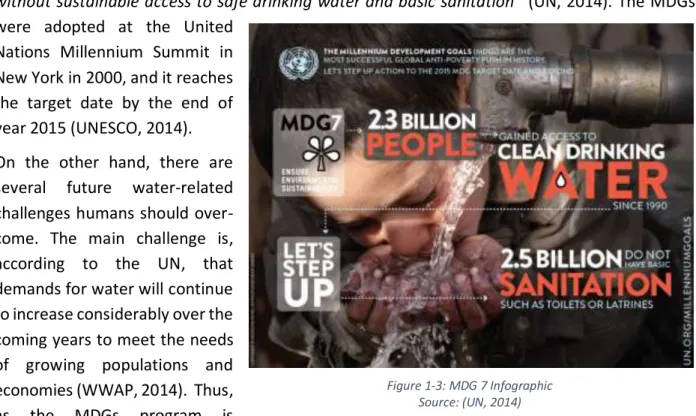
The challenge which has had to be met by today is to extend the coverage of water services to the unserved areas worldwide. This challenge was stated in the 7th development goal (target 7.c)
of the Millennium Development Goals (MDGs): “Halve, by 2015, the proportion of the population
without sustainable access to safe drinking water and basic sanitation” (UN, 2014). The MDGs
were adopted at the United Nations Millennium Summit in New York in 2000, and it reaches the target date by the end of year 2015 (UNESCO, 2014). On the other hand, there are several future water-related challenges humans should over-come. The main challenge is, according to the UN, that demands for water will continue to increase considerably over the coming years to meet the needs of growing populations and economies (WWAP, 2014). Thus, as the MDGs program is
concluding by the end of 2015, the 192 Member States declared the Sustainable Development Goals (SDGs) agenda beyond 2015 at the United Nations Conference on Sustainable
Figure 1-3: MDG 7 Infographic Source: (UN, 2014)
4 Development in 2012 (Rio+20) outcome document “The Future We Want”. In accordance, the International Hydrological Program of UNESCO (UNESCO-IHP) proposed a stand-alone sustainable development goal dedicated to water in order to “Ensure Water Security for
Sustainable Development” (UNESCO, 2014).
That challenge will be most severe in regions going through accelerated development and rapid economic growth, or those in which a large portion of the population lacks access to modern services. In fact, UN estimates that global water withdrawals are projected to increase by some 55% by 2050, mainly because of growing demands from manufacturing (400%), thermal electricity generation (140%) and domestic use (130%). As a result, freshwater availability will be more and more stressed over this time period, and more than 40% of the global population is projected to be living in areas of severe water stress through 2050. Moreover, there is clear evidence that groundwater quantities are shrinking, with an estimated 20% of the world’s aquifers being over-exploited (WWAP, 2014).
Water Use Sectors
Since water essentially contributes to all human development activities, it is highly competitive among several users. Categorizing water use by sectors has considerable significance for management-related purposes. In fact,
water use sectors can be classified into several classifications. For example, a suggested classification can be as the following: domestic; agricultural; industrial; and commercial water use.
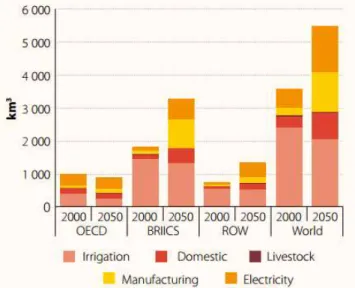
In that context, UN-Water had different classifications in their consecutive World Water Development Reports. Lately, the WWDR of 2014 classified water use sectors into: municipal; industrial; and agricultural, and also into: irrigation; domestic; live stock; manufacturing; and electricity. The second classification appears in figure 1-4 (extracted from WWDR 2014), which represents the global water demand as baseline scenario of 2000 and 2050.
Following the first UN-Water classification, most of the available waters, generally speaking at the global scale, are used by the agricultural sector (69% in year 2006). The rest is shared
Figure 1-4: Global Water Demand (2000 & 2050) Source: (WWAP, 2014)
5 between the industrial sector (19% in year 2006) and the municipal sector (12% in year 2006) (WWAP, 2014).
Regardless the sectors named and classified, the idea of classification itself is the most important here, keeping in mind that most classifications have the same theme in common. Actually, such variability comes from the idea that differentiating water use sectors is of massive importance for planners and decision makers. Also, the variance made it harder for data collectors, researchers and scientists to unite their deliverables.
It is worth mentioning here that each of the water use sectors is in continuous competition to enlarge their shares on the expense of the other sectors. Indeed, this competition becomes more obvious and meaner the more the water is scarce. In such cases, it is the duty of high-level decision makers and the sovereign managerial bodies to maintain the equitable sharing of this precious resource, in which the demands of each sector are satisfied according to predefined prioritization process.
Objectives
This work is a trial of exploration and better understanding of a specific part of the human scientific knowledge related to the integrated water resources management and the better practices of water use. It is directed under the purpose of completion and meeting the degree seeking requirements of the Master Program of Urban Engineering - Environmental Hydraulics at the University of Minho, in Braga and Guimarães, Portugal. Indeed, the leading purpose behind this effort is to light another candle in the long road towards overcoming the global water crisis. As discussed in the previous sections of this introduction, water is scarce in our globe and highly competitive among several users. Hence, and because humans cannot increase, by any means, the quantity of the available water on earth, the only way to maintain the recent life standards is to better manage our water resources.
Key tools in this regard are the indicators of water use performance. The concept behind these tools is to measure how much efficient the available water has been used. The aim of this work is to highlight and achieve the fundamental objective of water management of promoting water efficient use. This will be approached through systemically measuring the performance of a defined water system (WS) according to the applied management alternatives (allocation) using
sustainable efficiency (Sefficiency) as a tool.
The main aim is approached in this work through the following objectives:
i. WS Selection:
Selection among several alternatives of suggested water systems has to be made at the initial stage of the work progress. The hypothesized methodology will be implemented
6 later on the selected system in order to approach the other objectives, achieve results and draw conclusions.
ii. Characterizing the WS:
A process of defining, calculating, estimating or quantifying the system’s variables of interest:
- Hydrologically (precipitation, evapotranspiration, infiltration, etc...); - Qualitatively (pollution); and
- Socially (values: monetary or otherwise, usually by stakeholders).
iii. Presenting the multi-level performance of the WS:
This objective encompasses several tasks including: the development of a computerized model of the performance indicators; the quantitative estimation of the multi-level performance indicators; and performing sensitivity analysis to evaluate the effects of the different variables on the developed indicators.
iv. Analyzing (re)allocation policies:
Allocation or reallocation policies of water resources are subjected to a prioritization process between three main competitors: agriculture, urban/industry, and nature. The last objective of this work is approached by suggesting the most convenient allocation alternative(s) of the available water resources according to the presented results of the multi-level performance of the WS in objective iii.
7
LITERATURE REVIEW
When it comes to water resources management, this term refers not only to one complete science, but it refers to a group of sciences ranging from conventional sciences (such as supply management) to more modern and complex ones (such as integrated water resources management). However, the scope of this work is directed toward interconnected fields, including basically water (re)allocation policies and water use efficiency.
Management Approaches
As already discussed in the previous sections, water quantity is finite, while world’s population keeps increasing and the human life style develops rapidly. Moreover, due to the possible changes accompanied with climate change, uncertainty of the potentially upcoming scenarios is absolutely high. As the demand of water increase while the supply does not increase, the challenge is to utilize the available – and limited – quantity of water supplies in order to meet the minimum requirements of water demand. The variables of this utilization process – more importantly water demand among highly competitive users – are normally address by different management approaches in order to achieve the most efficient utilization. However, allocation decisions are taken by relevant policy makers.
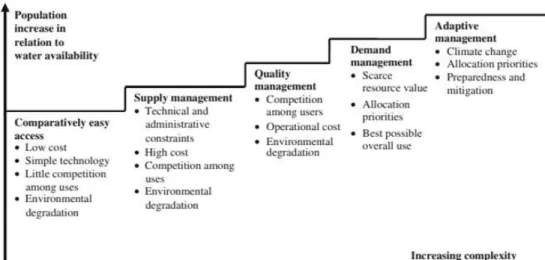
For example, Pakistan suffered a severe flood in 2010, while trying to feed a population of over 180 𝑚𝑖𝑙𝑙𝑖𝑜𝑛 (2010). Bangladesh as well, which records the world’s highest population density, suffered in 1988 its most devastating flooding, covering around two thirds of the country, with an estimated loss of over a hundred thousand lives. Despite the apparent ‘excess’ of water, even if both countries improved all the agricultural water use efficiencies to the maximum possible extent, neither Pakistan nor Bangladesh would be able to feed their own populations in the year 2050, nor protect them from the prospective increased floods and droughts (Stakhiv, 2011). Figure 2-1 illustrates the paradigm shifts or evolution of water management levels regarding the population increase in relation to water availability, and the increase of problem variables complexity.
Management approaches, such as the traditional water supply enhancement approach, proved inadequacy to address increasing water related challenges and meet the newly resulted standards in water allocation. In addition, demand management is important but unsatisfactory for growth, development, and adaptation to climate change for most developing countries (Stakhiv, 2011). As a result, issues such as quality management, environmental integrity, efficient allocation of water resources and cost effectiveness are introduced in integrated water management (Kampragou, et al., 2011).
8
Figure 2-1: Paradigm Shifts in Water Management Levels Source: (Kampragou, et al., 2011)
The systematic processes of continuously improving management policies and practices by learning from the outcomes of previously applied management strategies are known as adaptive
management (Pahl-Wostl, 2007). Although neither the concept of adaptive management itself
nor its implementation in natural resources management are new (Stankey, et al., 2005), but the current level of water adaptive management, globally, has definitely to upgrade in order to meet the recent and foreseeable challenges.
Such upgrade has to be based on a comprehensive shift towards participa-tory management and collaborative decision making. This necessarily means engagement of all related beneficiaries, decentralized management system (including open and shared information
sources), higher attention towards the social aspects, consideration of the environmental issues as priorities, reliance on iterative learning cycles (figure 2-2) integrated with the overall management approach (Pahl-Wostl, et al., 2008).
Figure 2-2: Adaptive Management Cycle Source: (Williams, et al., 2012)
9
Water (Re)allocation Policies
A researcher can find many literature about the impacts of water (re)allocation policies covering different aspects. For example, (Seung, et al., 1997) and (Seung, et al., 2000) analyzed the economic impacts of transferring surface water from irrigated agriculture to recreational use using basically the Computable General Equilibrium (CGE) model. Also, (Fang, et al., 2006), (Juana, et al., 2011), (Qtaishat, 2013) and (Qin, et al., 2013) analyzed the impact (negative and/or positive) of water reallocation from agriculture to other sectors (urban, industrial, etc...) on the economy and household income in different regions. Whereas, (Rosegrant, et al., 1999) investigated the potential impacts of water transfers from agricultural to urban and industrial areas on global food supply and demand. They found that comprehensive reforms are required to mitigate the potentially inconvenient impacts of water transfers for local communities and to sustain crop yield and output growth to meet increasing food demands at the global level. In addition, (Bjornlund, et al., 2011) approached the same issue of reallocation irrigation water from another perspective. They investigated the acceptance of this matter and whether such acceptance differs between urban and rural residents. They concluded that urban inhabitants are more likely to prefer government intervention while rural inhabitants are more likely to support policies that aim to protect farmers' water rights. They also found that people, both in urban and rural areas, can be categorized into three categories depending on their attitudes towards water and the environment: 1) pro-environment; 2) pro-economic; and 3) undecided. In the same context, (Savenije , et al., 2009) argued from different perspective about water pricing which should primarily serve the purpose of financial sustainability through cost recovery in addition to necessarily adequate attention for equity considerations. On the other hand, (Fielding, et al., 2012) made huge effort to promote water conservation in the field experimentally. They reported an experimental study to test the long-term impact of three different interventions on household water consumption. Also, (Araral, et al., 2013) and (Tortajada, et al., 2013) focused on the important issue of public participation, where water conservation requires the engagement of the public and private sectors as well as of the society at large.
Regarding the environmental impacts of water (re)allocation policies, (Colby, et al., 1991) argued about the continuity of water reallocation to reflect environmental benefits alongside the traditional uses of water. They presented some examples from the American recent history about changes on water allocation, forced by law, to mitigate hazards threatening the nature. Also, (Howe, et al., 1986) discussed about the shortcomings of water users, especially related to quantity and quality return flow effects, confirming that they can be minimized through changes in the administrative framework of the water rights system. They proved that an efficient water allocation system must integrate quantity and quality management. Furthermore, (Weber, 2001) modeled a suggested optimal allocation of surface water and pollution rights along a river with water quality constraints in order to answer the question of whether it is possible to maintain
10 water quality under a certain alternative mechanism for allocating surface water and pollution rights.
Water Use Efficiency
The approaches of water use efficiency estimation are varied. Starting from Classical Efficiency (CE), which is defined as the percentage of the water consumed to the total water abstracted. Pioneered publications that included this concept in irrigation were (Israelsen, 1932) and (Israelsen, 1950). In fact, CE in irrigation has been used worldwide for decades up to recently. Later, further publications went more in depth in this regard such as (Feddes, et al., 1978) in their book about which deal with the theory of field water use and of crop production, and more technically (French, et al., 1984) who investigated the relations between the crop of wheat yield and water use. Anyhow, it is worth mentioning here that (Burt, et al., 1997) presented a quite comprehensive definition and approach of CE in irrigation during their presentation and evaluation of irrigation performance indicators.
Moreover, the water use efficiency in irrigation gained most of the attention among authors recently, going more in depth technically from engineering perspectives. For instance, (Onta, et al., 1995) developed and applied an optimization model for an irrigation system for land and water allocation during the dry season in order to obtain optimum cropping patterns for different management strategies. Similarly, (Small, et al., 1996) evaluated under varying degrees of water shortage, using a simulation model, the irrigation performance implications of alternative water distribution rules for dry season. Within this context, (Howell, 2001) discussed the concept of enhanced CE in irrigation and its impacts on water conservation from different viewpoints. In order to approach enhanced water efficient use in irrigation, he recommended increasing the output per unit of water and reducing water losses to unusable sinks (engineering aspects), reducing water degradation (environmental aspects), and reallocate water to higher priority uses (societal aspects). One last example, (Gohar, et al., 2011) evaluated the potential economic benefits that can be supported by Egypt's irrigation water use by developing an integrated catchment scale framework.
However, considerable literature could be found discussing and proving the shortcomings and coverage inadequacy of CE, and others has been working on developing more comprehensive efficiency or performance indicators. (Jensen, et al., 1980) were among the firsts to highlight the misapplication of CE in resource development due to the absence of the irrigation water recovery. Furthermore, (Willardson, et al., 1994) and (Allen, et al., 2005) emphasized the necessity of improving the definition of water use efficiency for a better water management, where they discussed in their works terms such as evaporated, reusable, non-reusable and consumed fractions.
11 Hence, important contributions aiming toward a more comprehensive and complete understand-ing of water use efficiency and water system performance evaluation started takunderstand-ing place in the last two decades. An explicit example about this transition is Irrigation Sagacity (IS), which is defined as the ratio of irrigation water beneficially and reasonably used to the total irrigation water applied. This new efficiency term (IS) was presented in (Kruse, 1978) and very well organized and developed in (Solomon, et al., 1999). Nevertheless, (Keller, et al., 1995) introduced a thorough concept into the knowledge and understanding of water use efficiency in order to overcome the limitations of CE, which is Effective Efficiency (EE). They defined EE as the irrigation water consumed (evaporated) by crops divided by the effective use of water (the effective inflow minus the effective outflow).
The major step forward in (Keller, et al., 1995) definition and approach is the ability of its application on other uses of water and other measures of change in water quality or value, in other words, the inclusion of water quality dimension. This important inclusion, which came after solely quantitative approaches of water use efficiency, paved the road to other significant contributions in this regard. Later, (Haie, et al., 2008) developed EE models based on water quantity and quality, with the possibility of considering water reuse (recycling), for two scales (the first is called Project EE and the second is called Basin EE). They compared then between CE and EE results and found that CE values were less than EE due to water reuse absence in calculations. Hence, the real importance of their paper comes from their defense favoring EE versus CE, especially after the increased voices among researchers advocating the use of different concepts instead of efficiency concepts.
Finally, quite recently, (Haie, et al., 2012) made another major step forward by incorporating a third dimension to the definition of water use efficiency, which is the beneficence of water use. They employed the concept of water balance, based on conservation of mass, to develop three levels of composite efficiency indicators (macro, meso and micro levels). That was done through the definition of Usefulness Criterion, which they defined as the product of quality and beneficence weights assigned to the quality and the beneficial attributes of water use. The authors continued their efforts with another informative publication (Haie, et al., 2014) in order to better describe and, at the same time, examine the terminology associated with water use efficiency. Also, they proposed in their last paper integrated terminologies, starting from flow-path types in water balance and expanded into the three level efficiencies formulation.
12
METHODOLOGY
To achieve the predefined objectives of this work, a comprehensive methodological frame-work has to be set up. This will be conducted by dividing the frame-work progress into five main parts as previously listed in the objectives. In order to better manage the work progress, each part will be completed through carrying out one or more clearly defined task(s). This chapter provides the detailed description of each part of this framework.
WS Alternatives
The water system (WS) in this work indicates a geographical area that has defined boundaries, water source(s), water users (beneficiaries) and inflow/outflow water paths. For the purpose of applying the methodological framework, choosing the WS at the beginning is vital in order to achieve the rest of the objectives. A selection process among three alternatives will be carried out based on the following criteria:
- Data availability and accessibility - Water value
- Complexity of water issues
The three alternatives are: 1. Guadiana River Basin, Spain & Portugal; 2. Eastern Aquifer basin, West Bank, Palestine; and 3. Sacramento River Basin, California State, USA. Following is a brief description about each of them.
It is important to mention here that choosing any basin of the three listed here as WS does not necessarily mean considering the entire basin as the system. Only specific representative location within the geographic boundaries of that basin will be considered in order to have more reliable analysis and results.
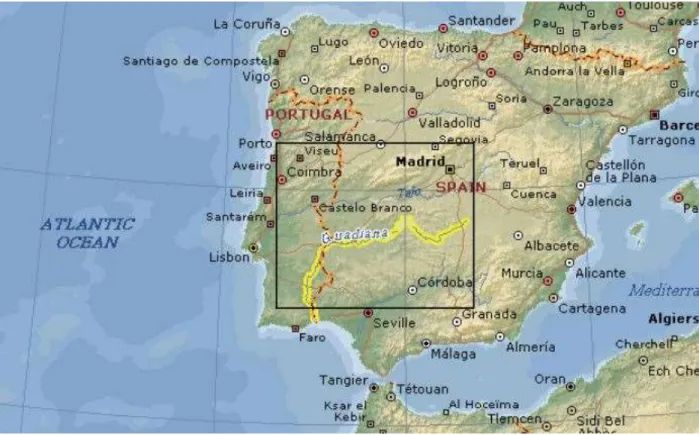
Alternative 1: Guadiana River Basin
Located in the southernmost part of Europe (figure 3-1), the Guadiana River basin occupies an area of about 68,800 𝑘𝑚2 (83% in Spain and 17% in Portugal). The climate in its region is semiarid, with an average precipitation of about 450 𝑚𝑚/𝑦𝑒𝑎𝑟, which is significantly less than the national mean annual precipitation (Aldaya, et al., 2008). The basin is one of the three main drainage units of the Iberian Peninsula (in addition to Duoro and Tejo). The source is in Spain, which has the largest storage capacity among the two countries, before flowing into Portugal (McEvoy, et al., 2008).
The Portuguese part of the Guadiana extends across the Alentejo and Algarve regions, which are significantly important regions for agriculture and tourism in Portugal. However, in that region, the primary water use sector is agriculture, with about 95% of total water demand in the entire
13 basin. Relatedly, regarding the water economic productivity, (Aldaya, et al., 2008) concluded – in their analysis of the water footprint for the river basin – that urban and industrial water values are higher than the corresponding value in agriculture. Keeping in mind that the multifunctional
Figure 3-1: Location of Guadiana River Source: (McEvoy, et al., 2008)
value of agriculture has to be considered. Nevertheless, they also concluded that agricultural productivity (𝑡𝑜𝑛/ℎ𝑎) and total production (𝑡𝑜𝑛/𝑦𝑒𝑎𝑟) of rainfed agriculture, however, are notably lower than that of irrigated agriculture. Hence, these facts give clear indications about the potentials of better manage and reallocate the Guadiana waters.
In fact, the continues changes in the natural hydrological system, in the form of dams, illegal dwells and increasing urbanization pressures within the Guadiana River basin in the last decades have caused growing problems with water scarcity along the Portuguese-Spanish border. Local stakeholders are beginning to realize that climate change may lead to opposing impacts on the human activities in the region. Portuguese governmental reports emphasize that Sado and Guadiana show up as the river basins with more vulnerability to climate change. In addition, global climate change models estimate a 60% potential decrease in annual runoff by 2100. Water shortages, summer drought and sand desertification are very likely to increase. Hence, the necessity of having adequate and comprehensive water management is of crucial importance for the future of water resources in that region (Cots, et al., 2007).
14
Alternative 2: Eastern Aquifer Basin
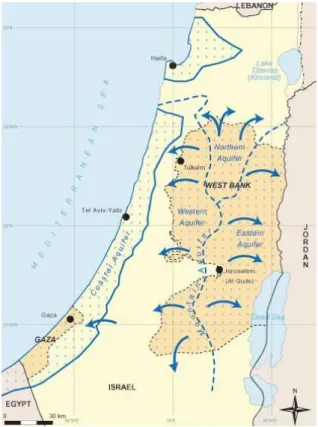
Groundwater is the water found under-ground in the cracks and spaces in soil, sand and rock. It is stored in and moves slowly through geologic formations of soil, sand and rocks called aquifers (The Groundwater Foundation, 2014). Groundwater is the primary source of water for Palestinians in the Occupied State of Palestine (OSP) (i.e. West Bank and Gaza Strip) and provides more than 90% of all water supplies. The main aquifer systems can be divided into four distinct units; the Western Aquifer Basin, the North-eastern Aquifer Basin and the Eastern Aquifer Basin for the West Bank, and the Coastal Aquifer for Gaza (PWA, 2012).
The Eastern Aquifer is located on the eastern part of the West Bank as shown in figure 3-2. According to the Palestinian Water Authority (PWA), the area of the Eastern Aquifer is 2.9 𝐾𝑚2, which is about 51.3% of the total area of the WB. The
Eastern Aquifer basin is divided into three main sub-aquifers; namely the Mountainous Heights, Northeastern Tip and Jordan Valley. The annual yield of this basin varies from 145 to 185 𝑀𝐶𝑀/𝑦𝑒𝑎𝑟. However, the Palestinians utilized about 42 𝑀𝐶𝑀/𝑦𝑒𝑎𝑟 from groundwater wells and springs in 2011 (PWA, 2012).
Lack of access to adequate, safe, and clean water has been one of the most serious issues for the Palestinians since several decades. Related with the Israeli-Palestinian conflict, the Israeli water policies and practices, which are proven to be discriminating against the Palestinian, magnified the problem greatly (World Bank, 2009). In fact, Israel controls access to water resources by Palestinians. It restricts the amount of water available to Palestinians to a level which does not meet their minimum needs and does not constitute a fair and equitable share of the shared water resources (Amnesty International, 2009).
Hence, water is not only scarce in that part of the globe, it is also politically significant. Therefore, especially when the uncertainty incorporated with future scenarios regarding the potential changes of water resources is considered, water resources management there is a serious task indeed. The stability and welfare of the entire region is directly connected to the best possible water allocation between the two countries.
Figure 3-2: Palestinian Aquifers Source: (UNEP, 2002)
15
Alternative 3: Sacramento River Basin
California State, located in the southern part of the west coast of the United States of America is the most populous state with 38.3 𝑚𝑖𝑙𝑙𝑖𝑜𝑛 population and 423,970 𝑘𝑚2 area (3rd
largest) (U.S. Census Bureau, 2013). California’s economy is strong enough to the level of competing the Great Eight (G8) countries. California, Italy and the Russian Federation were in a virtual tie in 2012 for eighth-tenth place in the world rankings with a gross domestic product (GDP) of 2.0 𝑡𝑟𝑖𝑙𝑙𝑖𝑜𝑛 𝑈𝑆𝐷 (CCSCE, 2013), which is 13.2% of the United States gross domestic product (GDP) (U.S. BEA, 2014).
In fact, CA has been the nation’s top agricultural state in cash receipts every year since 1948 (Bervejillo, et al., 2002). To indicate its dominance in agriculture, it is enough said that more than 99 𝑝𝑒𝑟𝑐𝑒𝑛𝑡 of the following agricultural products in the US are provided by California: almonds, artichokes, dates, figs, raisins, kiwis, olives, pistachios, prunes, and walnuts. It is also the leading state in producing asparagus, broccoli, carrots, grapes, hay, lemons, lettuce, milk, peaches, strawberries, and processing tomatoes, among many others (Bervejillo, et al., 2002).
California's climate is highly variable both spatially (from temperate rain forest conditions on the North Coast to the extreme aridity of Death Valley) and temporally. Records for maximum annual precipitation range from more than 2280 𝑚𝑖𝑙𝑙𝑖𝑚𝑒𝑡𝑒𝑟𝑠 on the North Coast to a little over 50 𝑚𝑖𝑙𝑙𝑖𝑚𝑒𝑡𝑒𝑟𝑠 in Death Valley. Droughts and floods can occur in close proximity. For example, the flooding of 1986 was followed by six years of drought (1987-92) (California Department of Water Resources, 2014).
Drought played a role in shaping California’s early history, as the so-called great Drought in 1863–64 contributed to the demise of the cattle rancho system, especially in Southern California. Subsequently, a notable period of extended dry conditions was experienced during most of the 1920s and well into the 1930s, with the latter time including the Dustbowl drought that gripped much of the United States. Three twentieth century droughts were of particular importance from a water supply standpoint – the droughts of 1928–35, 1976– 77, and 1987–92 (California Department of Water Resources, 2012).
What makes the situation even worse is the fact that the water footprint of the average Californian is 5,678 𝑙𝑖𝑡𝑒𝑟𝑠/𝑑𝑎𝑦 (1,500 𝑔𝑎𝑙𝑙𝑜𝑛𝑠/𝑑𝑎𝑦), slightly less than the average American but considerably more than the average resident in other developed countries or in the rest of the world. More than 90% of California’s water footprint is associated with agricultural products: meat and dairy products
have especially large water footprints due to the water-intensive feed required to raise the animals (Pacific Institute, 2014).
16 The Sacramento River Basin occupies nearly 70,000 𝐾𝑚2 in the north central part of California (figure 3-3). The river is the largest in California, with an average annual runoff of 27 𝑏𝑖𝑙𝑙𝑖𝑜𝑛 𝑚3 (Domagalski, et al., 1998). Between 2005 and 2010, the region supported about 1.95 𝑚𝑖𝑙𝑙𝑖𝑜𝑛 𝑎𝑐𝑟𝑒𝑠 of irrigated agriculture on average. While the gross value of agricultural production in the Sacramento Valley for 2011 was about 4.1 𝑏𝑖𝑙𝑙𝑖𝑜𝑛 𝑈𝑆𝐷 (California Department of Water Resources, 2014).
Figure 3-3: Sacramento River Basin Source: (Domagalski, et al., 1998)
Characterizing the WS
As mentioned earlier, a water resources system has known boundaries, water source/s the system relies on (e.g. a river, lake, groundwater well), water users (beneficiaries) and inflow/outflow water paths (water paths’ variables). A conventional WS might be a farm, a town, an entire river basin or even a subbasin. However, in order to characterize the WS, distinction has to be made between the different characteristics of water: quantity, quality and beneficence. Regardless the type of the system and regardless the numerical amount of the variables, each WS has to have these characteristics.
3.2.1 Water Quantity
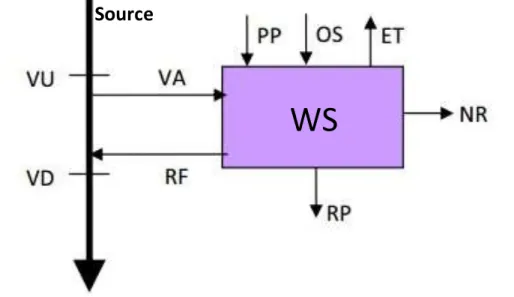
The main component of characterizing the WS is to determine the amounts or quantities of water paths’ variables flowing into or out of the WS under consideration. Typically, as illustrated in figure 3-4, the water abstracted from the source/s and precipitation form the main inflow paths, while the return flow, evapotranspiration and the nonreusable waters form the main outflow paths. Distinction between the flows of both directions has to be made due to the obvious differences regarding the calculation methods, quality and beneficence of each path.
17
Total Inflow:
- Precipitation (PP): the amount, usually expressed in millimeters or inches of liquid water depth, of the water substance that has fallen at a given point over a specified period of time (American Meteorological Society, 2012). PP amounts are calculated through using
Figure 3-4: Water Flow Paths Diagram Source: (Haie, et al., 2012)
isohyetal maps (e.g. figure 3-5) for the area under consideration, which are maps of lines connecting points of equal precipitation depth (averages of known time period).
Figure 3-5: Isohyetal Map Example
- Abstracted Water (VA): the amount of water abstracted from the main water source/s of the system. Such amounts are usually known (measured) by water authorities. Alternately, the volume of water upstream before abstraction (VU) can replace VA, regardless the type of water source.
- Other Sources (OS): any abstracted water from sources other than the main source.
Source
18
Total Outflow:
- Evapotranspiration (ET): the combined processes through which water is transferred to the atmosphere from open water and ice surfaces, bare soil, and vegetation that make up the earth's surface (American Meteorological Society, 2012). ET estimation is of high complexity due to the variety of the included variables. However, Penman Method (PM), illustrated in FAO Irrigation and Drainage Paper 56 by (Allen, et al., 1998), will be used for ET estimation.
To estimate the reference ET (ETo), which is the evapotranspiration rate of a referenced
crop (usually alfalfa) at standard meteorological conditions, the PM equation is: 𝐸𝑇𝑜 =0.408∆(𝑅𝑛− 𝐺) + 𝛾 900 𝑇 + 273 𝑢2(𝑒𝑠− 𝑒𝑎) ∆ + 𝛾(1 + 0.34𝑢2) Where*1: 𝐸𝑇𝑜: Referenced evapotranspiration in 𝑚𝑚. 𝑑𝑎𝑦−1 𝑅𝑛: Net radiation at the crop surface in 𝑀𝐽. 𝑚−2. 𝑑𝑎𝑦−1 𝐺: Soil heat flux density in 𝑀𝐽. 𝑚−2. 𝑑𝑎𝑦−1
𝑇: Mean daily air temperature at 2 𝑚 height in ℃ 𝑢2: Wind speed at 2 𝑚 height in 𝑚. 𝑠−1
𝑒𝑠: Saturation vapor pressure in 𝑘𝑃𝑎 𝑒𝑎: Actual vapor pressure in 𝑘𝑃𝑎
𝑒𝑠− 𝑒𝑎: Saturation vapor pressure deficit in 𝑘𝑃𝑎 ∆: Slope vapor pressure curve in 𝑘𝑃𝑎. ℃−1 𝛾: Psychrometric constant in 𝑘𝑃𝑎. ℃−1
Then, to convert ETo to actual crop ET (ETc), the crop coefficient approach is going to be
used:
𝐸𝑇𝑐 = 𝐾𝑐× 𝐸𝑇𝑜 Where:
ETc: crop evapotranspiration in mm.day-1
Kc: crop coefficient (dimensionless)
The crop coefficient, Kc, is basically the ratio of the crop ETc to the reference ETo, and it
represents an integration of the effects of four primary characteristics that distinguish the crop from reference grass. The crop coefficient integrates the effect of characteristics that distinguish a typical field crop from the grass reference, which has a constant appearance and a complete ground cover. Consequently, different crops will have different Kc coefficients. The changing characteristics of the crop over the growing
season also affect the Kc coefficient. Finally, as evaporation is an integrated part of crop
*1 Further details about the equations to calculate other variables in the ET
o equation can be found in the source
(Allen, et al., 1998).
Eq. (3.1)
19 evapotranspiration, conditions affecting soil evaporation will also have an effect on Kc
(Allen, et al., 1998).
- Return Flow (RF): amount of water that returns to the main source. Such amount might be in the form of runoff, infiltration (to groundwater wells) or wastewater. Estimation the RF depends on the form of it, which by itself varies from a WS to another. Alternately, in case of using VU as a type of inflow, the volume of water downstream after the occurrence of the return flow (VD) can replace RF, regardless the type of water source.
- Potential Return (RP): similar to RF but returns to an outlet other than the main source. - Nonreusables (NR): the amount of water that does not return nor evaporate, which is
used to maintain the conservation of mass.
It is important to keep in mind the consistency of units for all variables. For example: volume, depth, percentage or fraction (Haie, et al., 2012).
3.2.2 Water Quality
Water quality variables are of high complexity due to the variety of conditions under consideration from physical to chemical and biological conditions. Moreover, the quality dimension is not only about the quality of water and the system that water flows through, but also the level of toleration for a design quality, which is a management decision (Haie, et al., 2012). Hence, it is highly important to simplify the method of dealing with quality using reliable classification methods.
Water quality is a qualitative characteristic that is usually indicated by a lot of field or lab tests and measurements. A quantification approach is needed to indicate it when measuring the performance of a WS. Hence, the water quality index (WQI) approach will be used. The WQI is a single number that expresses water quality by aggregating the measurements of water quality parameters (such as dissolved oxygen, pH, nitrate, phosphate, ammonia, chloride, hardness, metals etc.). Usually the higher score alludes to better water quality (excellent, good) and lower score to degraded quality (bad, poor). The index provides a simple and concise method for expressing the quality of water bodies for varied uses such as recreation, swimming, drinking, irrigation, or fish spawning, etc. The significance of the WQI can be easily appreciated as the water resources play a crucial role in the overall environment (Lumb, et al., 2011).
In fact, the Canadian water quality guidelines (CWQGs) of the Canadian Council of Ministers of the Environment (CCME) presented in 2001 an index called the Canadian Water Quality Index (CWQI) that is still used until nowadays (CCME, 2001). It has also been endorsed by United Nations Environmental Program (UNEP) in 2007 as a model for Global Drinking Water Quality Index (GDWQI) (Lumb, et al., 2011).
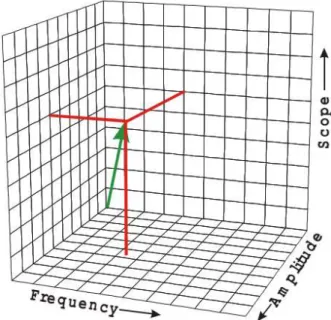
20 It is well documented and explained in the CCME
2001 guideline that conceptually CCME WQI comprises three factors as illustrated in figure 3-6. First, F1 deals with the scope that assesses the
extent of water quality guideline noncompliance over the time period of interest. Second, F2 deals
with frequency i.e. how many occasions the tested or observed value was off the acceptable limits (objective) or the yardsticks. The third factor, F3 deals with the amplitude of deviation
or, in other words, the number of tests by which the acceptable limits are exceeded (CCME, 2001). Following is a detailed explanation about the calculation process of the three factors (F1,
F2 and F3) and the final result of CCME WQI:
F1 and F2 are calculated according to their definition in the following equations:
𝐹1 = [𝑁𝑜. 𝑜𝑓 𝑓𝑎𝑖𝑙𝑒𝑑 𝑣𝑎𝑟𝑖𝑎𝑏𝑙𝑒𝑠
𝑇𝑜𝑡𝑎𝑙 𝑛𝑜. 𝑜𝑓 𝑣𝑎𝑟𝑖𝑎𝑏𝑙𝑒𝑠] × 100 𝐹2 = [𝑁𝑜. 𝑜𝑓 𝑓𝑎𝑖𝑙𝑒𝑑 𝑡𝑒𝑠𝑡𝑠
𝑇𝑜𝑡𝑎𝑙 𝑛𝑜. 𝑜𝑓 𝑡𝑒𝑠𝑡𝑠] × 100
F3 is calculated in three steps. The first step is to calculate the number of excursions, which are
the number of times by which an individual concentration is greater or less than the objective. For cases in which the test value must not exceed the objective:
𝑒𝑥𝑐𝑢𝑟𝑠𝑖𝑜𝑛𝑖 = [𝐹𝑎𝑖𝑙𝑒𝑑𝑇𝑒𝑠𝑡𝑉𝑎𝑙𝑢𝑒𝑖 𝑂𝑏𝑗𝑒𝑐𝑡𝑖𝑣𝑒𝑗 ] − 1 For cases in which the test value must not fall below the objective:
𝑒𝑥𝑐𝑢𝑟𝑠𝑖𝑜𝑛𝑖 = [ 𝑂𝑏𝑗𝑒𝑐𝑡𝑖𝑣𝑒𝑗
𝐹𝑎𝑖𝑙𝑒𝑑𝑇𝑒𝑠𝑡𝑉𝑎𝑙𝑢𝑒𝑖] − 1
The second step is to calculate the normalized summation of excursions as the following: 𝑛𝑠𝑒 =∑ 𝑒𝑥𝑐𝑢𝑟𝑠𝑖𝑜𝑛𝑖
𝑛 𝑖=1
𝑁𝑜. 𝑜𝑓 𝑡𝑒𝑠𝑡𝑠
Then, the third step is to calculate F3 by an asymptotic function that scales the normalized
summation of the excursions from objectives (nse) to yield a range between 0 and 100: 𝐹3 = [
𝑛𝑠𝑒
0.01𝑛𝑠𝑒 + 0.01]
Figure 3-6: Conceptual Model of CCME WQI Source: (CCME, 2001) Eq. (3.3) Eq. (3.4) Eq. (3.5a) Eq. (3.5b) Eq. (3.5c) Eq. (3.5d)
21 Finally, after calculating the three factors, the CCME WQI can be calculated by the following equation: 𝐶𝐶𝑀𝐸 𝑊𝑄𝐼 = 100 − [ √𝐹12+ 𝐹 22+ 𝐹32 1.732 ]
The constant of 1.732 has been introduced to scale the index from 0 to 100. Equation 3.6 produces a value of CCME WQI between 0 and 100 (which will be divided later by 100 to make it from 0 to 1 in order to match the requirements of this study). A zero (0) value signifies very poor water quality, whereas a value close to 100 signifies excellent water quality. The water quality is ranked in the following five categories: excellent: 95-100; good: 80-94; fair: 65-79; marginal: 45-64; poor: 0-44 (CCME, 2001) and (Lumb, et al., 2011).
3.2.3 Water Beneficence
Water beneficence in this work, similar to quality, is indicated by a value representing its level, or in other words, how much beneficial is water in that flow path. These values or weight are basically management decisions. They are defined by the managers, consultants, and decision makers and depend on the specific priorities of the WS inhabitants.
Within this context, extensive studies and researches are needed to cover several aspect, including: political, economic, environmental and social analysis of water needs; impact assessments; health requirements diagnoses; surveys of public participation; and others. The results of these studies and researches are supposed to direct the managerial decisions of defining water beneficence weights. In fact, the weights should reflect the significance of water use of each water flow paths’ variables and, indeed, they must be directed towards meeting the human, local, regional and global requirements of welfare and wellbeing.
However, this area of research is beyond the scope of this work. Therefore, the author will rationally assume the beneficence weights of water flow paths’ variables by mental logic.
WS Performance
The process of measuring the WS performance is based on the general framework that (Haie, et al., 2012) suggested in their paper “Macro, Meso, and Micro-Efficiencies in Water
Resources Management: A New Framework Using Water Balance”. They developed performance
composite indicators in order to determine efficiency using water balance, considering two types of total flows: total inflow and total consumption (using the two binary indices (𝑖, 𝑐) (with values 0 or 1, and 𝑖 + 𝑐 = 1).
22 As previously explained, the preliminary steps are the definition of the WS and the quantitative, qualitative and beneficence characteristics. These quantity characteristics (shown in figure 3-4) are classified into two parts: (1) 𝑡𝑜𝑡𝑎𝑙 𝑖𝑛𝑓𝑙𝑜𝑤 = 𝑉𝐴 + 𝑂𝑆 + 𝑃𝑃; and (2) 𝑡𝑜𝑡𝑎𝑙 𝑜𝑢𝑡𝑓𝑙𝑜𝑤 = 𝐸𝑇 + 𝑅𝑃 + 𝑅𝐹 + 𝑁𝑅. The total inflow and total outflow variables should satisfy the water balance principle, as such (𝑡𝑜𝑡𝑎𝑙 𝑖𝑛𝑓𝑙𝑜𝑤 − 𝑡𝑜𝑡𝑎𝑙 𝑜𝑢𝑡𝑓𝑙𝑜𝑤 = ∆), where ∆ is the change in water storage of a WS. This principle is based on the universal mass conservation equation that is defined for a time period (e.g. one year) in which ∆ is assumed 0:
(𝑉𝐴 + 𝑂𝑆 + 𝑃𝑃) − (𝐸𝑇 + 𝑅𝑃 + 𝑅𝐹 + 𝑁𝑅) = 0 Where:
VA: Volume of abstracted water (or source upstream volume) OS: Volume of water from other sources
PP: Precipitation ET: Evapotranspiration RP: Potential return
RF: Return flow (or source downstream volume) NR: Nonreusable water
Classical efficiency is defined as the percentage of abstracted water consumed beneficially (Haie, et al., 2012). The word “consumed” has to be questioned because consumptive use is only a portion of the total water use, while the non-consumptive use is the other. Any use of water that causes a physical removal of water from the system making it unavailable for reuse is classified as consumptive. The evapotranspiration (ET) incurred during crop irrigation, golf course irrigation and lawn watering are typical examples, while vegetative growth (irrigated and unirrigated) is by far the dominant consumptive use indeed (Frederiksen, 1992). This term (consumptive use) has a special significance in water resources and irrigation management (particularly in real-water saving), therefore, Haie, et al., 2012, considered this type of total flow in addition to the total inflow.
The total inflow type is considered when (𝑖, 𝑐) = (1, 0), while the total consumption type is considered when (𝑖, 𝑐) = (0, 1). Sefficiency is going to be calculated considering each type of flow
apart in order to highlight the differences between two types of conservation practices: (1) abstraction savings (SA); and (2) consumptive savings (SC). According to (Haie, et al., 2008), SA is a
reduction in water diversion (abstraction or withdrawal) from its source such as a river, while SC
is a reduction in the water permanently removed from the river basin. Reducing total inflow of water through SC or SA mechanisms is crucial in developing a sustainable system, while properly
implementing both of these two types of saving (parallel to the two types of water total) will probably result many benefits for the WS.
23 Indeed, the classical efficiency definition, as many scholars proved, has to be upgraded to be more comprehensive. The distinct remark about this framework, which makes it favorite over the other efficiency estimation approaches, is the inclusion of water quality and beneficence dimensions. The quality value (𝑊𝑞𝑋, X being any of the water paths) and the beneficence value
(𝑊𝑏𝑋) are expressed by weights (between 0 and 1 with 0 being its “worst” state). Having these
dimensions defined, then the useful part of a variable, designated with a subscript ‘‘s’’ and called
Usefulness Criterion, is the product of both dimensions, indicating the equally high significance
attached to both of these aspects (Haie, et al., 2012). Hence: 𝑠 = 𝑊𝑞𝑋 × 𝑊𝑏𝑋 And,
𝑋𝑠 = 𝑊𝑞𝑋 × 𝑊𝑏𝑋× 𝑋
Finally, using the equations derived, efficiency can be calculated at three different levels: Macro, Meso, and Micro-Efficiencies (3ME). Actually, Macro-Efficiency (𝑀𝑎𝑐𝑟𝑜𝐸) is used to indicate the impact of a WS on a basin, for example the major river where water was abstracted, while Meso-Efficiency (𝑀𝑒𝑠𝑜𝐸) is related to a situation between micro and macro levels indicating, for example, the impact of return flows generated by a WS. However, Micro-Efficiency (𝑀𝑖𝑐𝑟𝑜𝐸) is used to indicate the useful outflow generated by a WS for itself (Haie, et al., 2012).
Therefore*2: 𝑴𝒂𝒄𝒓𝒐𝑬 = [ 𝑬𝑻 + 𝑵𝑹 + 𝒊(𝑽𝑫 + 𝑹𝑷) 𝑽𝑼 + 𝑶𝑺 + 𝑷𝑷 − 𝒄(𝑽𝑫 + 𝑹𝑷)]𝒔 𝑴𝒆𝒔𝒐𝑬 = [ 𝑬𝑻 + 𝑵𝑹 + 𝒊(𝑹𝑭 + 𝑹𝑷) 𝑽𝑨 + 𝑶𝑺 + 𝑷𝑷 − 𝒄(𝑹𝑭 + 𝑹𝑷)] 𝒔 𝑴𝒊𝒄𝒓𝒐𝑬 = [ 𝑬𝑻 + 𝑵𝑹 𝑽𝑨 + 𝑶𝑺 + 𝑷𝑷]𝒔
These equations will be applied on the defined water variables of the selected WS in order to determine the multi-level performance indicators of the system.
*2 Derivation of the equations starting from the equation of water balance (3.7) can be found detailed in the source
(Haie, et al., 2012) Eq. (3.10) Eq. (3.11) Eq. (3.12) Eq. (3.8) Eq. (3.9)
24
(Re)allocation Policies
Allocation or reallocation policies of water resources are subjected to a prioritization or trade off process between three main competing sectors,
which are: agriculture, urban/industry, and nature. Also, this process could be pursued between the different water flow paths’ variables within one of those mentioned sectors. The objectives of the allocation or reallocation policies is to: 1. Satisfy all, or at least the most possible, of water sectors’ demands; and 2. Achieve the highest possible water use efficiency and WS performance according to these policies.
For example, as in most of the developed countries, the agricultural sector uses the most quantity of the available water. Serious questions should be addressed about the effectiveness of their use. The answers of such questions pave the roads to the discussions and research about the advancement of the irrigation adopted. However, in other countries, especially the developing ones, the allocation of water in agriculture at the expense of the residential demands should always be under evaluation. Moreover, the ecological concerns regarding water contaminating have to be always addressed due to their major effects.
Policies are set up and decided by stakeholders/leaders. In many cases, interests of water competitors intersect or conflict in a way that affects the performance of the WS. The major significance of the indicator presented in this work is the ability to represent and include these interests in the resulted indicator. Anyhow, in such a changing world, mostly by our own hands, water (re)allocation policies are demanded to be on the reliable level to meet all the human requirements of water use, and to face and mitigate any future potential threat.
Agriculture
Nature Urban/
Industry
25
APPLICATION
After setting up and illustrating the methodological framework of this study, this chapter will cover the application of it. This will be done by selecting a WS, as an initial step, in order to implement the remaining steps of the process. The progressive steps of the application chapter will follow the same order of the previous one (chapter 3: Methodology) in order to have a well-structured and comprehensive workflow.
WS Selection
As previously mentioned, the selection is based on data availability; water value; and complexity of the issue. It is important to remember here that choosing any basin of the three listed here as WS does not mean considering the entire basin as the system. Only specific representative portion of the basin will be considered in order to have more reliable analysis and results.
- Taking the first criterion (data availability) under evaluation, what is assumed to consider data as available is: accessibility (online, necessity to travel, etc…); understandability (in terms of language); and to be from an accredited source. Most of the accessible data found regarding the first alternative (Guadiana River basin) were written in either Spanish or Portuguese languages, at which the researcher faces difficulties dealing with. When it comes to the second alternative (Eastern Aquifer basin), online accredited data sources were very limited, which makes traveling necessary. In contrast, enormous amount of several types of data from accredited sources are accessible online covering the entire State of California (alternative 3).
- Regarding the second and third criteria, as briefly described about each alternative, the current and projected water values and the complexity of water issues in each area are crucially high. The significance of the agriculture in Guadiana River basin, the drought which this area is suffering, in addition to the climate change projections are all enough reasons to realize how much water is valuable and the situation is complex there. Similarly, Sacramento River basin area has the same reasons to consider, with even higher monetary values of the agricultural sector in that part of the world. The situation is somehow different in the Palestinian Eastern Aquifer basin area, where the value goes high enough to touch the human level. However, many political complex interventions play significant role in water issues there, which is an undesirable case for this type of researches to go through. Hence, based on the evaluation of the three criteria, the researcher, with the assistance of his supervisor, has chosen the third alternative: Sacramento River basin area as a water system in order to implement the study and achieve the rest of the work’s objectives.
26 Although data acquisition for the basin as a system is possible
in order to measure the Sefficiency at the basin level, but to
simplify the implementation process and to be closer to real cases scenario, this study would rather consider a smaller scale. Thus, the case presented in the Department of Water Resources (DWR) of California report (figure 4-1): “A Proposed Methodology for Quantifying the Efficiency of Agricultural Water Use. Appendix C: Calculation Examples of Water Use Efficiency Quantification” will be used for the quantitative characterization of the WS.
The report is prepared by DWR – in consultation with the California Agricultural Water Management Council, academic experts, and other stakeholders – after the direction of the Water Conservation Act of 2009 (Senate Bill X7-7). It proposes a methodology to evaluate current conditions and strategies
for improving agricultural water management on the diverse array of agricultural irrigation systems and operations found throughout California (DWR, 2012). Importantly, the examples illustrated in that report consider data extracted from irrigated areas in Davis city, Yolo County, CA (figure 4-2).
Figure 4-2: Davis City and Yolo County
However, concerning the qualitative characterization of the WS, the DWR offers in its online water data library an enormous water quality data set. This set includes results records of experimental tests of water quality elements performed in many stations distributed all over the state of California. Data of some stations are recorded since several decades ago.
27
WS Characteristics
The characteristics of the selected WS are presented in this section according to the previous description in section 3.2. The agricultural nature of the system implies specific theme of its characteristics. For example, in this system, ET has major importance that will be represented in its high values (both quantity and beneficence). On the other hand, other variables, such as RP will not have as much importance as in other types of water systems. As previously mentioned, the numbers presented here are extracted from the examples listed in appendix C in the DWR 2012 report. According to the report, these are not completely real-case numbers, but they are decent representative estimations of water paths’ variables of a regular farmland area in central California (where Davis, Yolo County is). However, further explanation about this matter can be found in the following elaboration of the selected system’s quantitative, qualitative and beneficence characteristics.
4.2.1 Quantitative Characteristics of the WS
The initial and primary step of characterizing the WS is to allocate the quantities of each water paths’ variables. These variables, which are previously described in subsection 3.2.1, are complex to estimate and differ from a WS type to another. In the case of the selected WS, which is an irrigated tomato farms area, the major inflow is the water abstracted from the main source, Sacramento River, while the major outflow is the water consumed in the form of ET.
As expected, the raw data found in the DWR 2012 report are presented in a different structure than the one explained previously in this study, and in US customary units. However, these raw data will be restructured, edited and converted into metric units in order fit the used structure and equations of this study. Following is an elaboration of this process.
Raw Data Editing and Conversion:
The calculations of a seasonal crop water balance for a tomato crop grown at Davis, California is shown below. Most of the raw data are extracted from the DWR 2012 report, unless otherwise stated.
- First of all, the supplied water is diverted from Sacramento River at a section near the area of Sacramento Weir that leads to Yolo Bypass, which is considerably close to the area of interest as described in the DWR 2012 report. In fact, a DWR station for discharge gauging is located there, while all the recorded data (since long time ago) of the daily flow of Sacramento River Delta*3 area could be found in the DWR online data library. However, after accessing the data
of that station and accumulating the values for 2010 water year (the year of interest in the
*3 Yolo County is one of the five counties (Contra Costa, Sacramento, San Joaquin, Solano, and Yolo) encompassing