Kelly Ann Rodrigues
The efficient use of water
in the context of climate change
Kelly Ann Rodrigues
The ef ficient use of w ater in t he conte xt of climate c hang e
Universidade do Minho
Escola de Engenharia
Dissertação de Mestrado
Ciclo de Estudos Integrados Conducentes ao
Grau de Mestre em Engenharia Civil
Trabalho efetuado sob a orientação do
Professor Doutor Naim Haie
Kelly Ann Rodrigues
The efficient use of water
in the context of climate change
Universidade do Minho
ACKNOLOWGEMENT
My dearest Mum, for all her never ending support and all her kind words that never seem to run out. And of course my Dad and Brother.
And by all means, the person I found so interesting since the first lesson of AIA, Professor Naim. I thank for always being available, advice and so much support.
ABSTRACT
As the world’s population grows, so do the water demands to fit everyone’s needs. This problematic topic is affecting many areas of the world and making its population experience severe water scarcity. As our Planet is changing at a rapid speed it’s up to us do something about it and this is when water efficiency starts to get a new meaning. So in order to try to minimize the damage that this boosting problem is causing, enhancing the efficiency of water use and therefore understand that its management is important to increase the beneficial utilization of water.
We have witnessed that up to date water management only allowed so much growth to be sustained, so if water management has a proper approach towards efficiency, naturally it will enable a broader level of sustainable growth.
Another problem regarding the shortage of water the world faces is climate change. This subject plays an important role in the present dissertation as it’s around it that the efficient use of water will be analyzed, through three Water Use Systems which consist of three plots of agricultural land located throughout the Guadiana River. This study will be conducive to the understanding of the Sefficiency concept as well as water allocation policies, as these were the two methods used to analyze the Water Use System. The results showed how crucial it is to take into consideration the use of different tools, when regarding natural resources, providing the stakeholder with several alternatives to ultimately make the best decision, in the context of climate change.
Keywords: Sefficiency, Climate Change, Water Allocation Policy, Efficiency, Water Management
RESUMO
À medida que a população mundial cresce a demanda de água acompanha de modo a satisfazer as necessidades de todos. Este tópico problemático está a afetar diversas áreas do mundo fazendo com que a sua população enfrente severa escassez de água. Conforme o nosso planeta está rapidamente a mudar depende de nós fazer algo para poder alterar isso e assim, o conceito de eficiência da água começa a ganhar outro significado. Deste modo, para tentar atenuar os estragos causados por este problema cada vez maior será necessário aumentar uso eficente da água e portanto perceber que a sua gestão é crucial para aumentar o seu uso benéfico.
Pelo que é possível constatar, ao longo dos anos a gestão da água apenas permitiu um crescimento sustentável até um certo ponto. Assim, uma abordagem correta perante a gestão da água, irá permitir um maior crescimento sustentável.
Contudo, entre outros problemas, existe a escassez da água que o mundo enfrenta devido às alterações climáticas. Este tópico terá uma grande importância na presente dissertação, uma vez que é à volta deste, que o uso eficiente da água será analisado, através de sistemas de uso de água que consiste em três lotes de terreno para fins agrícolas localizados ao longo do rio Guadiana. Este estudo será conducente à compreensão do termo Seficiência assim como políticas de alocação de água, tendo sido estes os métodos utilizados para analisar os sistemas de uso de água. Os resultados mostraram a importância da utilização de diferentes ferramentas, respeitando recursos naturais, fornecendo às partes interessadas diversas alternativas para posteriormente tomar a melhor decisão, no contexto de alterações climáticas.
Palavras-chave: Seficiência, Alterações Climáticas, Política de Alocação de água, Eficiência, Gestão da Água
LIST OF CONTENTS
ACKNOLOWGEMENT ... iii
ABSTRACT ... v
RESUMO ... vii
TABLE OF ACRONYMS ... xii
LIST OF FIGURES ... xiii
1. INTRODUCTION ... 1 1.1. Context ... 1 1.2. Objective ... 2 1.3. Study Outline ... 2 2. LITERATURE REVIEW ... 3 2.1. Climate Change ... 3 2.2. Water ... 5
2.2.1. Food and Water Security ... 6
2.2.2. Water Management ... 6
2.2.3. Water Quality ... 7
2.3. Sefficiency: What does it mean? ... 8
2.4. Guadiana Basin ... 9 2.5. Agriculture ... 11 2.5.1.Desertification ... 12 2.5.2. Drip Irrigation ... 14 2.5.3. Surface Irrigation ... 14 3. METHODS ... 17 3.1. Sefficiency ... 17 3.2.WUS variables ... 21 3.2.1. Evapotranspiration ... 21 3.2.2. Total Precipitation ... 23
3.2.3. Abstracted water from the main source ... 25
3.2.4. Return Flow ... 25
3.2.5. Potential Return ... 25
3.2.6. Volume Upstream and Volume Downstream ... 25
3.2.7. Other Sources and Non-Reusable ... 26
3.3. Calculating Water Quality through the Canadian Water Quality Index ... 26
3.4. Water Allocation Policy ... 29
4. RESULTS ... 33
4.1. Water Use System 1 ... 33
4.1.1. Evapotranspiration WUS1 ... 34
4.1.2. Total Precipitation WUS1 ... 34
4.1.3. Water Quality ... 35
4.1.4. Variable Values ... 36
4.2. Water Use System 2 ... 38
4.2.1. Evapotranspiration WUS2 ... 39
4.2.2. Total Precipitation WUS2 ... 39
4.2.3. Water Quality ... 40
4.2.4. Variable Values ... 40
4.3. Water Use System 3 ... 43
4.3.1. Evapotranspiration WUS3 ... 43
4.3.2. Total Precipitation WUS3 ... 43
4.3.3. Water Quality WUS3 ... 44
4.3.4. Variable Values ... 45
4.4. Water Policy ... 47
4.5. Water Allocation Policy and Sefficiency ... 49
4.5.1. Water Use System 1 ... 50
4.5.3. Water Use System 3 ... 52
5. CONCLUSIONS ... 53
REFERENCES AND BIBLIOGRAPHY ... 57
LIST OF WEBSITES ... 61
TABLE OF ACRONYMS
FAO – Food and Agriculture Organization UN – United Nations
IPPC - Intergovernmental Panel on Climate Change
UNESCO - United Nations Educational, Scientific and Cultural Organization
UNDP – United Nations Development Programme WUS – Water Use System
Wq – Quality Weights
Wb – Beneficial Weights
LIST OF FIGURES
Figure 1- This figure shows both location and extent of the Guadiana River Basin ... 10
Figure 2 - Desertification in the Alentejo region ... 13
Figure 3 – Drip Irrigation applied to Olive trees ... 14
Figure 4 - Furrow Irrigation in vineyard in Australia ... 15
Figure 5 - General schematic of a Water Use System ... 18
Figure 6 – Evapotranspiration. ... 22
Figure 7 - Example of how the values of precipitation ... 24
Figure 8 - Image with corresponding graph of precipitation ... 24
Figure 9 - Example of how data was obtained for WUS 2 ... 29
Figure 10 – General schematic of the WUS display throughout the main source with all variables defined. ... 31
Figure 11 - Image obtained from Google maps with the WUS localization ... 33
Figure 12 – Graph represents the variation of ET according to the water quantities ... 48
Figure 13 – Graph represents the variation of the variable RF according to the water quantities ... 49
Figure 14 – Graph represents the variation of Meso-Efficiency in WUS 1 according to the existing units ... 50
Figure 15 - Graph represents the variation of Meso-Efficiency in WUS 2 according to the existing units ... 51
Figure 16 - Graph represents the variation of Meso-Efficiency in WUS 3 according to the existing units ... 52
LIST OF TABLES
Table 1 - Variables included in 3ME and description ... 19
Table 2 - Description of all variables represented in figure 9 ... 31
Table 3 - Values of PP for WUS 1 ... 34
Table 4 - Water Balance Quantities ... 36
Table 5 - Quality Weights Wq ... 36
Table 6 - Beneficial Weights Wb ... 37
Table 7 - Final Results WUS1 ... 38
Table 8 - Values of PP for WUS2 ... 39
Table 9 - Water Balance Quantities ... 40
Table 10 - Water Quality Weights Wq ... 41
Table 11 - Beneficial Weights Wb ... 42
Table 12 - Final Results WUS 2 ... 42
Table 13 - Values of PP for WUS 3 ... 43
Table 14- Water Balance Quantities ... 45
Table 15 - Quality Weights Wq ... 45
Table 16 - Beneficial Weights Wb ... 46
Table 17 - Final Results WUS3 ... 46
1. INTRODUCTION
1.1. Context
Contrary to popular belief water is a scarce natural resource and it’s reaching a point of no return. Freshwater is beginning to be a very problematic topic throughout the world and for it to continue to be a reliable supply for future growth it must be available to local populations in sufficient quantity and quality, without compromising local ecosystems. Even though the access to drinkable water was declared a Human right (UNESCO, 2010), it’s lack in quantity and quality is one of the biggest problems worldwide.
With that in mind the word efficiency takes a big part in all that relates to something so important to us Humans. Not only regarding water there’s a known way to calculate efficiency, through Classical Efficiency, which relates input with output. Throughout the years this has been the way to calculate efficiency; however it may sometimes lead to error (Haie & Keller, 2012) as there’s much more to water then one simple equation. It’s important to acknowledge that water has several different purposes in which its efficiency should be looked at in several ways. This leads up to Sefficiency, in which all different factors such as quality and benefits, as well as specific variables, intervene allowing a more complete approach to the term efficiency and water management.
According to the United States Environmental Protection Agency increasing water efficiency can help a water system deal with critical issues such as:
Decreasing availability and quality of water sources;
Increasing costs of treating and providing water;
Aging infrastructure in service beyond its useful life;
Growing demands for an improved level of service placed on the system by
customers;
Reducing or delaying the need for expensive capital projects and important
environmental sustainability benefits, including reduced energy use and reduced pressure on water resources.
Achieving higher water productivity levels and reducing stress is possible by practicing simple things such as polluting less, wasting less, reusing more, managing more effectively and becoming more efficient in all uses of water.
In order to understand the Sefficiency concept the present dissertation will analyze three different Water Use Systems throughout the Guadiana River, using different irrigation systems as well different crop types and assume a water allocation policy.
1.2. Objective
The drive of this dissertation is to understand how severe water scarcity is and how it’s quickly and surely affecting the world and its population. Even though there are many causes that point to this lack of water, climate change is the focus of this study. It will be shown that climate change is a topic that shouldn’t be overlooked and should definitely be taken into everyone’s consideration. So in order to overcome these drastic impacts there must be an appreciation about efficiency and how it should work towards water. The overall objective is to understand how efficiency and sustainability come together and form the Sefficiency concept and subsequently to comprehend how it works and in which circumstances it can be applied.
1.3. Study Outline
This dissertation begins with a Literature Review that covers all important aspects regarding water by approaching what’s happing in the world and in the area being studied. This section also specifies and explains all the different methods that were applied in the next section. So in the section called Methods, it can be find all the methods explained previously and its application towards Sefficiency and water policy allocations. The fourth section describes all the results obtained by using the previously characterized methods. Ultimately, all the conclusions provided from the results.
2. LITERATURE REVIEW
2.1. Climate Change
Even though we can't really see, so to speak, our planet is changing right before our eyes. Human and natural activities have caused a vast quantity of various types of gas to exchange between the earth and its atmosphere. One of the natural causes to aggravate this phenomenon is water vapor. The so called "Greenhouse gases" Carbone dioxide (CO2), methane (CH4), nitrous oxide (N2O) and water vapor absorb radiation off the Earth's surface, gas molecules and the clouds retain it in the form of heat in the lower levels of the atmosphere which assist in maintaining a constant temperature that can and does preserve life on Earth. As result of this, the gases permit radiation from the sun to traverse the atmosphere thus heating the earth and impeding any heat getting back out into space. Despite this alleged "Greenhouse effect" being a natural phenomenon, and the result disturbing the natural balance and impacting global climate, Scientists believe the cause is due to human activity which has increased the atmospheric greenhouse gases. (R. Lal, et al. 2004). A good example of this is when the heat is caught within the atmosphere, Global climate is affected by alterations occurring and having a major impact on the ocean's temperature, wind patterns, and the Earth's water cycle.
Rainfall changes have been seen in many parts of the world, which have resulted in more intense rain, floods, drought, and severe heat waves have now become a more frequent occurrence. Sea levels are rising, ice caps melting, and oceans are becoming much more acidic. It has nearly become a daily normality to learn about some sort of natural disaster happening somewhere in the world. So much destruction to people's lives and all due to something that has been provoked throughout the years, we are slowly paying for our careless and selfish ways. As Mother Nature is giving us a warning, the impact on food and nutritional security are aggravated and undermining the rights of marginalized and vulnerable people.
The comparatively recent growth of populations and activities due to agricultural development, industrialization, deforestation, oil from the burning of fossil fuels, coal and gas, have caused much larger quantities of greenhouse gases and at a much faster rate than their natural processes to be released. There has been an increase of 40% of Carbon dioxide since pre-industrial times (Spotlight IPCC, 2013). Taking into account the destruction that has
already been done to the environment, nature is starting to dictate the course, which will soon be of no return.
In accordance to the global poverty project there will be a decline in agricultural productivity, an example of this will be that some African countries could eventually see their agricultural harvests decrease by 50% by the year 2050 which would all be due to the impacts of climate change. Affirmed by an Oxfam report (Oxfam media briefing 9/2014) also as a result of climate change, by 2050 there could 50 million more hungry people and an extra 25 million malnutrition children under the age of five. As always the most vulnerable and poorest people are being affected first and in the worst possible of ways. Grave risks to human health and threats to ecosystems and biodiversity are due to climate change, because of rising sea levels and an increase in water stress.
The United Nations Development Programme released a report in 2006, stating that in the slums of developing countries, people will typically pay up to five to ten times more per unit of water than those who have access to piped water (UNDP, 2006). Current projections (UN World Water Development Report, 2015), say that with an increase emission of greenhouse gases there will be crucial changes in temporal and spatial distributing of water resources, and there will be a significant rise in the frequency and intensity of water-related disasters.
According to IPCC sea level has risen 17 centimeters in the past one hundred years and since the industrial revolution the Planet’s temperature has risen 0.8 degrees and between 2016 and 2035 it will rise between 0.4 to 1 degree. Nevertheless 25% of global emissions are due to agriculture and deforestation. Another direct link to climate change has been the expansion of global meat and dairy products and is something many people aren’t even aware of. According to the FAO the livestock sector are responsible for approximately 18 percent of global greenhouse gas emissions.
With this being said, it’s important to first understand what it is that we are facing so then take action, and as engineers try to solve the problem by coming up with an efficient solution.
2.2. Water
In the world, there is no force that has a greater power over us than the power of water. It is the basis for sustainable development, and its vast range is responsible for environmental sustainability, economic growth, and the reduction of poverty in many countries. Despite our planet being covered by 70% water, it is misleading to think that it is bountiful. Water for millions of people in developing countries is not as easy as it is for most of us, simply a tap away. Women and children have to walk for miles every day to get some water. Human and animal waste often contaminates their water, which is a cause for much illness and death. If there is a problem, it has to do with economics and politics. In the developed world there isn't a water shortage; technology and wealth provide clean water for everyone but at an increasing cost. According to the UN, in 2006 the problem for the undeveloped world was caused by corruption, mismanagement, lack of investment, and the shortage of appropriate institutions which all leads to poor sanitation and unsafe water.
400 million people in India live along the Ganges River, which is one of the five most polluted rivers in the world. Many of the poorer population use the river daily for washing clothes, bathing, cooking and much more. Even though released into the river every day is industrial waste, human sewage, religious offerings and even partially cremated Human bodies it does not stop them from using the river.
In Yemen, the groundwater is being extracted four times the rate of natural recharge (International Crisis Group, 2003). This crisis is yet and another example of the adverse effect of climate change. The main reason for the increase demand in water is the because of population growth, thus cause this crisis. Underwater exploitation is getting out of hand. Agriculture plays a big role in Yemen's economy, adding to the hardships this country is going through.
Investing in water and sanitation yields would show health benefits, according to a 2014 UN Report (GLAAS 2014 Report). Millions of children would be saved from malnutrition illnesses, water-borne diseases and premature deaths. Better care for newborns, maternal health, and adults would live a healthier and longer life. The quality of life would also be greatly improved from using unsafe facilities and time would be saved from searching for and carrying water. With a reduction in the pollution of water and land resources, there would be a
positive impact on coastal fisheries and broader water ecosystems, which lie in the heart of the global water cycle. Also an important aspect is Energy. Water is required to generate energy and energy is required to deliver water. Water is heated to create steam to drive electrical generators (UN -Water, 2015). Over 80% of today’s power is produced by thermal electricity.
An opportunity for the growth of new industries, greater involvement in the workplace due to improved access facilities, and better productivity. There would be a sense of well-being and dignity for all with improved school attendance and completion. Freshwater fundamentally depends on the continued healthy operating of the ecosystems and acknowledging the importance of the water cycle as essential to achieving sustainable water management.
2.2.1. Food and Water Security
Food Security is when all the people have safe, nutritious and enough food all the time to be able to live a healthy life. Food is a basic human need, yet millions of people in the world are going to bed hungry every day. This problem is exacerbated by the population growth and hence the population demand for food. On the other hand water security is defined as the capacity of a population to safeguard sustainable access to adequate quantities of acceptable quality water for sustaining livelihoods, human well-being and socio-economic development, for ensuring protection against water-borne pollution and water-related disasters, and for preserving ecosystems in a climate of peace and political stability (UN-Water, 2013). Investing in water security is a long-term pay-off for human development and economic growth, with immediate visible short-term gains.
2.2.2. Water Management
Another very critical factor linked to water is its appropriate management. As the scarcity of water becomes more and more of a concern so does the importance of how it is managed. Minimizing the environmental impact and optimizing the use of water on the natural environment leads to successful management of any resources. Our failure to meet basic human needs is the root of all these problems. As a result of our in ability to balance human need with the needs of the natural world, and inappropriate or ineffective institutions and
management. “Many issues have been over looked” according to the Pacific Institute research, for example: water as a basic human right, the importance of efficiency and conservation of water, the impact of climate change, the privatization and globalization of water, and the role of water in conflict.
The sustainability of the current and future water resource allocation is one of the largest concerns related to water in the future. An important step in the sustainability of water resources is to find a balance between what is needed in the environment and what is needed by humans. The decision making will not get any easier with the ongoing climate change, and all its uncertainty, which will lead to a never before encountered situation.
“The objective of sustainable water management is to promote water use in such a way that society’s need is both met to the extent possible now in the future. This tool allows adequate, inexpensive and sustainable supplies and qualities of water.” András Szollosi-Nagy, 2005.
2.2.3. Water Quality
It’s important to understand that water quality is just as important as water quantity for satisfying basic human needs and environmental needs. It’s of great concern to know the water which is about to be used or even drunk. It is measured by several factors, such as the concentration of dissolved oxygen, bacteria levels, the amount of salt or the amount of material suspended in the water, depending mainly of the purpose of that water. So it’s fundamental for good river health and sustains ecological processes that support native fish population, vegetation, wetlands and birdlife. Also, many of our own uses depend on water quality that is suitable of irrigation, watering stock, drinking, fishing, recreation and to meet cultural needs.
According to the World Water Development Report 2012, nearly 3.5 million deaths are related to inadequate water supply, sanitation and hygiene happen each year mainly in developing countries. Poor water quality incurs many economic costs such as degradation of ecosystem services; health related costs, agriculture, industrial production and tourism, increased water treatment costs and reduced poverty, for example.
2.3. Sefficiency: What does it mean?
First of all there must be an understanding about the meaning of Sustainability and Efficiency. Sustainability is a concept which is based on our natural environment, meaning that everything that us humans need for our own survival and well-being depends in some way of that same natural environment. It’s important to remember ourselves that we all live on common ground, our forests exhale the air we breathe and connect us all. Every living creator, no matter how small, sustains the whole. Even though there are many who believe that we belong to the planet others feel that the planet belongs to us and this is what brings us to the unsustainable planet we live in.
On the other hand we have Efficiency, which represents a level of performance that describes processes that uses the lowest amount of inputs to create the greatest amount of outputs, reducing the amount of waste of the inputs. In this context efficiency improvements of the irrigation system, which is what is being dealt with, are important water saving measures as they result in water loss reduction.
Water efficiency has become a growing concern worldwide and Organizations like UNESCO, World Water Council, and The International Water Management Institute have been promoting water efficiency alongside water conservation.
There must be an understanding that water is reaching a critical point and there’s more to it than the classical efficiency or trying use water in a more sustainable manner. Linking these two concepts allows a more complete and accurate view on what’s needed for water. From what was previously mentioned it’s possible to conclude that both sustainability and efficiency should meet half way. A more complete approach to the efficiency concept, which also includes sustainability, is called Sefficiency. This term is the main focus of this thesis and will be exemplified through three different Water Use Systems.
2.4. Guadiana Basin
The Guadiana river basin covers 66.800 km2 of which 11.580 km2 are located in Portugal.
The largest dam along the Guadiana River is Alqueva. This river source is from Spain in Ruidera at an altitude of about 1.7 km, and stretches over a total length of 810 km making its way to Vila Real de Santo Antonio, where it meets the sea. In Portugal, the river has a total length of 260 km, of which 110 km correspond to the border between Portugal and Spain.
The Guadiana River has a Mediterranean fluvial regime where floods alternate with dry spells. It represents a typical semi-arid region where there is increasing water scarcity due to human activity and the modification of the hydrological regime over previous decades. During the drought years this kind of climate needs some level of irrigation to maximize crop yields. It also is an area with an ageing population because of unemployment and progressive population loss over the decades.
Both in Spain and Portugal the land has a predominantly rural occupation, some of the water quality issues are due to sewage water discharges from agro-industrial units and to agricultural activity.
The agricultural sector which is very important in this area is going through a big change. Climate change may affect directly or indirectly the water quality of the Guadiana river, according to the Portuguese Environmental Agency, as the rising temperature can lead to a decrease on the levels of saturation of the dissolved oxygen in the water and biological and chemical processes may be harmed, altering the ecosystem’s behavior; An alteration in the precipitation could cause more pollution, as the fertilizers and pesticides used in agricultural activities could be dragged to the river and a flow reduction may cause a larger concentration of pollutants.
Figure 1- This figure shows both location and extent of the Guadiana River Basin (http://environ.chemeng.ntua.gr/)
The Portuguese Environmental Agency states that the objectives to obey the Law of Water must be attained during the present year. These goals consist of achieving a good or potentially good state of the water mass. More specifically, according to the Management Plans of the River Basin Region the superficial water must carry out these next objectives:
Prevent the bodies of water from deteriorating;
Protect, improve and recover all mass of water with the objective of achieving the
good state of water – Chemically and ecologically;
Protect and improve the mass of water that was strongly modified and artificial with
the purpose of attaining a good ecological potential as well as a good chemical state;
Gradually decrease the pollution cause by dangerous substances and eliminate
2.5. Agriculture
Controlling nature to allow cities and empires to grow and satisfying human needs involves high quantities of water in order to obtain all produce wanted and needed which is the main part of agriculture. Industrial agriculture dominates and sustains a large part of the world. Food has become abundant and affordable to all through the use of chemical pesticides, fertilizers, biotechnology and mechanization. Resulting in a system of chemically intensive food production developed after the Second World War.
Monoculture is the practice of growing single crops intensively on a very large scale, year after year and relies heavily on chemical inputs such as synthetic fertilizers and pesticides. This system of planting the same crop year after year leaves the soil very weak and unable to support healthy plant growth. Farmers are forced to use chemical fertilizers to encourage plant growth as the soil quality and structure is so poor, however this practice adds to nutrient depletion. Planting diverse plant species so that crops will be able to withstand attacks from pests and insects can avoid this problem and eliminate the need to use pesticides. Using organic pesticides will reduce the amount of pollution. Also to help improve soil fertility the use of composted manure and other natural materials should be used, as well as crop rotation. All these practices result in protecting ground water supplies, and avoid runoff of chemicals that can cause dead zones and poisoned aquatic life.
According to a statement by the UN in 2013 (State of the World’s land and water resources for food and agriculture, FAO 2013) meeting agricultural needs through organic farming is a possibility, as the social and ecological price has been high: deforestation, depleted and contaminated soil and water resources, erosion, loss of biodiversity, the decline in family farming, and labor abuses.
Encouraging healthy soil by planting different crops in fields every year and also incorporating croplands with grazing livestock; avoiding the use of pesticide by nurturing the presence of organisms that control crop-destroying pests. Nevertheless, critics of sustainable agriculture claim that among other things, this method results in higher land use and lower crop yields.
Both food security and food production are linked to the availability of water and water security. High efficiency reflects in low losses, losses are non-recoverable waste of resources; reductions in losses will mean more is available for alternative uses and by implication high efficiency is good.
Producing food that respects natural life cycles is called Organic farming, and it minimizes the human impact on the environment. To ensure that resources are used efficiently crops are rotated, synthetic fertilizers, chemical pesticides, antibiotics and other substances are severely restricted, genetically modified organisms are banned, disease-resistant plant and animal species adapted to the local environment are used and livestock are raised in a free-range, open-air environment and are fed on organic fodder.
Concerns about water scarcity make us focus our attention on irrigation. Irrigation requires a great amount of water, being the largest water-using sector across the world (Perry, 2007). In many developing nations, irrigation accounts for over 90% of water withdrawn from available sources for use. Water used for irrigation in Spain, Portugal and Greece exceeds 70% of total usage (UN-Water, 2006). Irrigation has been the reason which enabled many developing countries to produce enough food to feed everyone.
As reported by the UN World Water Development Report 2015, by 2050 agriculture will need to produce 60% more food globally, and 100% more in devolving countries. As the current growth rates of global agricultural water demand are unsustainable, the sector will need to increase its water use efficiency by reducing water losses and increase crop productivity with respect to water. Agricultural water pollution, which may worsen with increased intensive agriculture.
2.5.1.Desertification
Even though desertification has a greater impact in developing countries it is an increasing problem in Portugal, as it’s the most affected country in the European Union (FAO, 2002). Human activities, over-exploitation of water and soil, uncontrolled wood-cutting, mining and excessive use of chemicals are the main cause of desertification. In the Alentejo region, the extensive agriculture mechanization and shortage of land resting periods and intensive erosion
processes resulted on soil fertility loss. Another example that may cause this problem is salinization. Water for irrigation purposes contain dissolved salts which may vary according to the origin of the water. The soil becomes concentrated with salt as the plants remove water through evapotranspiration (Letey, John, 2000). In arid or semi-arid regions salinization is a common phenomenon, meaning that this occurs in the Alentejo region, which is being studied. The increase in the salt levels in the soil affects the plant growth and kills them. Desertification in the Alentejo has been through a series of fazes, one of the most important one was in the XVII century when forests were destroyed to give place to cereal cultivation. During the world wars, due to fuel stocks running out, trees and scrub to produce coal, which
lead to a massive destruction of nearly all natural vegetation
(http://geografia.fcsh.unl.pt/lucinda/Leaflets/A2_Leaflet_PT.pdf).
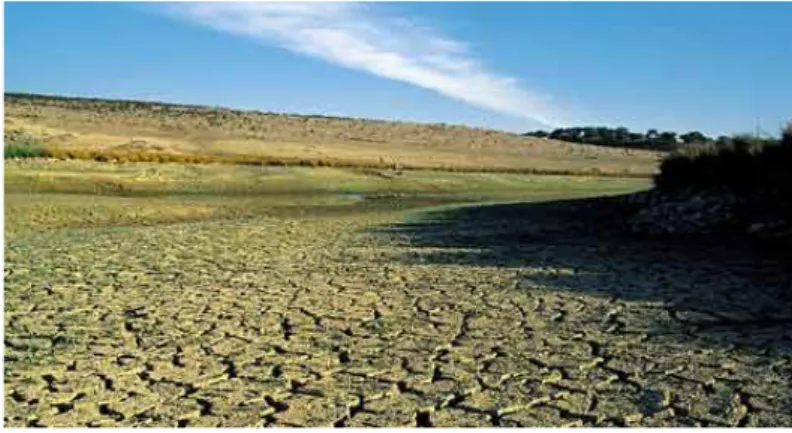
The IPPC has acknowledged desertification as one of the biggest environmental challenge of our days. In 2012 the UN made aware that every year 23 hectares are transformed into deserts every minute, covering 40% of our planet. Desertification represents a big ecologic and economic problem that affects the whole world. Once rural areas are no longer productive the people who lived in those areas tend to head towards the cities, causing not only an economic problem but also a social problem. The image below represents the harsh reality that is faced right here in Portugal.
2.5.2. Drip Irrigation
This type of irrigation will be used in one of the Water Use System. In drip irrigation the water is passed through the field through a system of pipes where a tube is installed next to a row of plants or trees. The tube has a hole made at regular intervals and it is also equipped with an emitter. The water then slowly comes out of the emitter in drops and waters the plants. The water drips out of the emitter and provides deep watering and a microclimate (Bamouni, Souleymane, 2011). Drip irrigation objectives are: low-flow supplying allows a low variation of moisture, providing water locally in the root zone, ensures the supply in a high frequency. Only a limited area of soil is wet. The higher degree of inbuilt management that drip irrigation offers substantially reduces deep percolation and runoff losses, attaining higher irrigation efficiencies, as the water soaks into the soil before it runs off or evaporates. The high efficiency is also due to the fact that the water is only applied to where it is needed rather than sprayed randomly.
The image below depicts drip irrigation being applied to Olive Trees.
Figure 3 – Drip Irrigation applied to Olive trees (http://homeguides.sfgate.com)
2.5.3. Surface Irrigation
Surface irrigation is the oldest type of irrigation. Once this water irrigation system is constructed it is easy to maintain and to operate. The water runs over the soil to either wet it completely or only partially. Despite surface irrigation being the most common type of irrigation it is also the most inefficient. The disadvantages being potentially wasteful run offs
and over watering (Bamouni, Souleymane, 2011). If the soil cannot readily absorb water or lacks proper sloping this can lead to standing water which damages plants and reduces yields for edible crops.
The three types of existing surface irrigation are the following:
Furrow Irrigation: where narrow ditches are dug in the field between rows of crops.
Here the water runs along the ditches as it moves down the slope.
Border Irrigation: depends on the topography of the field, which determines the
possible width that can be obtained while keeping a horizontal cross-section without requiring too much soil movement. The field to be irrigated is divided into strips by parallel dykes or border ridges.
Basin Irrigation; these are horizontal flat plots of land which are surrounded by small
dykes, that prevent water from flowing over to the surrounding fields.
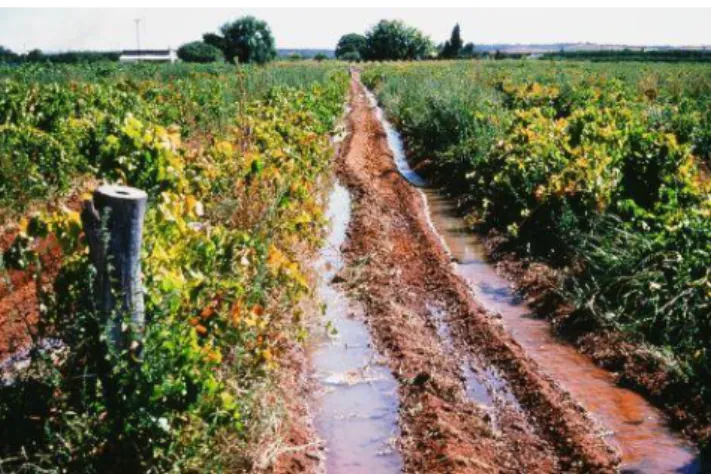
The image below represents a vineyard using furrow irrigation, showing excessive water application in South Australia.
Figure 4 - Furrow Irrigation in vineyard in Australia (http://pir.sa.gov.au)
Although the type of irrigation depends on the characteristics of the soil, the slope of the land, the kind of crops intended to plant, the climate, among other factors, the objective of this thesis takes in to account the obvious flaws and benefits of each one as there would be a need for a more detailed and cautious study of all the mentioned factors. So the main difference considered was regarding the benefit weights that are explained in section 4.
3. METHODS
3.1. Sefficiency
In order to comprehend Sefficiency, a Water Use System must be characterized, along with its variables and respective value and it also must include water quantity, quality and benefits (Haie & Keller, 2012).
The terms Macro, Meso and Micro efficiencies are a vital point of this dissertation. These are integrated indicators that should reflect dynamics of different scales, such as a farm and a basin, alongside with the law of conservation of mass. A set of variables which define the WUS must abide to the water totals: Total inflow and total consumption.
Every variable must have a beneficial dimension as well as a quality dimension to provide it with useful criteria. The boundaries of the WUS must be known to the manager and the analyst.
According to Haie and Keller (2012) the definitions of the previously mentioned integrated indicators are:
Micro-Efficiency (MicroE): This is the relationship between useful outflow and total
flow within a WUS. It also indicates the useful outflow generated by a WUS for itself.
Macro-Efficiency (MacroE): This is the relationship between useful outflow and total
flow as related to a river basin. MacroE indicates the impact of a WUS on a basin.
Meso-Efficiency (MesoE): This is the relationship between useful outflow and total
flow as related to a situation between Macro e Micro-levels.
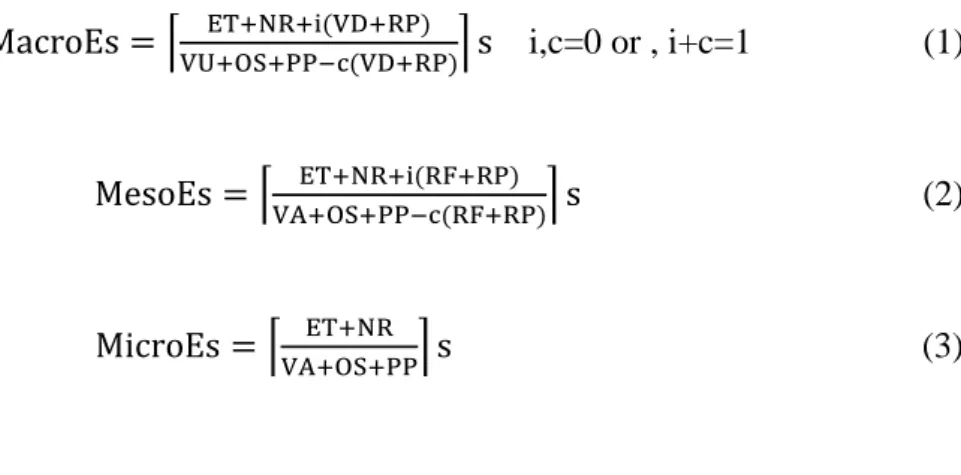
One of the mathematical views on these three concepts is called full models and can be represented by these next three equations ((i,c) = (0,1) gives the percentage of total consumption that is useful consumption and (i,c) = (1,0) gives the percentage of total useful inflow that is useful outflow):
MacroEs = ⌈VU+OS+PP−c(VD+RP)ET+NR+i(VD+RP) ⌉ s i,c=0 or , i+c=1 (1)
MesoEs = ⌈ ET+NR+i(RF+RP)
VA+OS+PP−c(RF+RP)⌉ s (2)
MicroEs = ⌈ ET+NR
VA+OS+PP⌉ s (3)
As explained above there are three different approaches and levels to understand Sefficiency. However, the present dissertation will focus only on MesoE, ignoring the volume upstream and downstream of the river, as both those variables are related to MarcoE. In order comprehend Meso-Efficiency in a more basic level there must be an understanding about Classical Efficiency, which basically represents the division between total output and total input in the system. However, when referring to water efficiency it’s difficult to bear in mind all the different aspects that water involves and so classical efficiency is seen as less complete
as it’s defined more specifically as 𝐸𝑇𝑏
𝑉𝐴 (Beneficial weight of Evapotranspiration and
Volume of water downstream after RF in main source).
Given the preview equations it’s possible to calculate in a more complete way the water efficiency acknowledging all variables that belong and influence a Water Use System as well as quality and beneficial weights associated to each one of those variables.
Figure 5 - General schematic of a Water Use System
In order to characterize a Water Use System water flow paths and attributes such as quality and benefits must be defined allowing the use of the law of conservation of mass. The figure above shows all the water flow paths that must be considered in a WUS. The present dissertation will have three WUS throughout the Guadiana River, which will be considered
the main source. It’s important to keep in mind that these WUS are hypothetical, even though the values obtained are as close to reality as possible. With an area of about a hectare each and although the main objective is to understand how Sefficiency works, it will be possible to understand how it can vary differently according to the type of irrigation used and the crops being cultivated. So, oranges, grapes and olives were chosen for the crop and drip irrigation and surface irrigation, as mentioned before.
Table 1 - Variables included in 3ME and description Variable Description
ET Evapotranspiration
NR Nonreusable, water consumption OS Water from other sources PP Total precipitation RF Return flows
RP Potential return (does not return to the main source) VA Abstracted water from the main source
VD Volume of water downstream after RF in the main source
VU Volume of water upstream before abstraction in the main source
V1 Volume of water at section 1 (VU or VA) V2 Volume of water at section 2 (VD or RF)
The final results presented in the fourth section are either full models or quantity models. The main difference between them is that full models attend to both beneficial (b) and quality (q) dimensions of the variables. The product of both these dimensions is called Usefulness Criterion (s). However, the quantity models attend only to the beneficial dimension (b) of the variables.
A full model is represented through equation (2). When i = 0 and c = 1 then equation (2) has this appearance:
The numerator of equation (4) which is (ET+NR) represents the consumption of the WUS. (RF + RP) represents the return flow and (VA+OS+PP) the total inflow in the system. Overall, when dealing with full models and c=1, which can also be presented as cMesoEs, means the effective consumption that is useful consumption.
On the other hand when i=1 and c=0, equation (2) has the following appearance:
iMesoEs = ⌈ET+NR+(RF+RP)VA+OS+PP ⌉ s (5)
In this case the numerator of equation (5) is the total outflow and the denominator (VA + OS + PP) means the total inflow in the system. So iMesoEs give us the useful inflow that is useful outflow.
Equation (6) is an example of the value of ET would be calculated, considering a full model.
ETs= ETwq × ET wb × Water Balance Quantity of ET (6)
Wq: Quality Weight Wb: Beneficial Weight
All the remaining variables are calculated the same way, according to their respective value.
Regarding the quantity models when c=1 and i=0, equation (2) becomes the following equation:
cMesoEb = ⌈VA+OS+PP−(RF+RP)ET+NR ⌉ b (7)
Even though both the numerator and denominator are the same as equation (4) the final result gains a different meaning as it’s regarding a beneficial dimension. cMesoEb represents the effective beneficial consumption that is beneficial consumption.
In this case, and using the same example regarding ET but now referring to a quantity model, the way of calculating ET is shown in the next equation.
ETb= ET wb × Water Balance Quantity of ET (7)
Again respecting quantity models but now when c=0 and i=1, equation (2) becomes the equation below:
iMesoEb = ⌈ET+NR+(RF+RP)VA+OS+PP ⌉ b (8)
Once again both the numerator and denominator are the same as equation (5) however; as it’s referring to a quantity model the final result has a different meaning. iMesoEb represents the effective beneficial consumption that is beneficial consumption.
3.2.WUS variables
As mentioned above the variables that define the Water Use System must be defined according the reality that surrounds it. Having in mind the definition of each one (table 1) the outflow variables are: ET, NR, RP and RF and on the other hand the inflow variables are: VA, PP and OS. These must have the same unit, such as volume, depth, percentage of fraction. In the present case all units are presented in millimeters per day. As previously mentioned the variables VU and VD were ignored as the present study is at a Meso-Efficiency level. Both OS and NR are zero as it was considered that there wasn’t any water provided from another source besides the river and all the water was reusable.
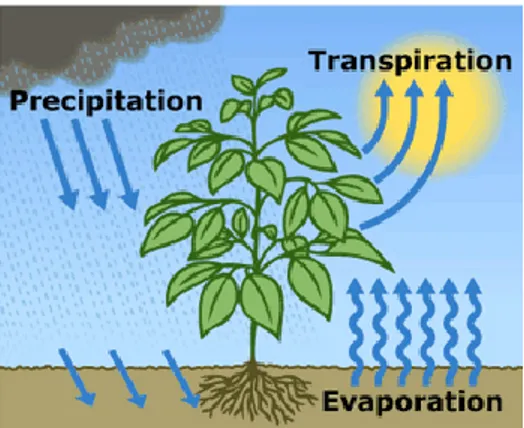
3.2.1. Evapotranspiration
Evapotranspiration (ET) is one the variables defined in a WUS. This term represents the sum of the plants evaporation and transpiration and in order for this to occur water is needed. The plant roots extract water from the soil to live and grow. The main part of this water doesn’t remain in the plant as it escapes to the atmosphere as vapor through the leaves and stems, called transpiration, which happens mainly during the day. The water on the soils surface
leaves and stem escape as vapor to the atmosphere as the phenomenon called evaporation. The figure (from the site water.usgs.gov) below represents all the process described above.
Figure 6 – Evapotranspiration. Image from site water.usgs.gov
It’s important to understand that the water the plant needs for evapotranspiration may be stored in the root zone and used when needed. This means that even though the plant needs a certain amount of water a day for this phenomenon to happen the excess or lack of water a day will not interfere negatively. The water that the crop needs mainly depends on the climate (hot climate crops need more water per day than crops in a cloudy and cool climate), humidity, wind speed, the crop type and growth stage.
The FAO Corporate Document Repository, Irrigation Water Management, provides the reader with a great amount of information regarding the determination of the reference crop evapotranspiration (ETo), the crop water need (ETcrop) and the irrigation water need. The definition of the reference crop evapotranspiration (ETo), conforming to the FAO Natural Resources Management and Environment Department is that ETo is the rate of evapotranspiration from a large area, covered by green grass, 8 to 15 cm tall, which grows actively, completely shades the ground and which is not short of water. Even though there are several methods to determine ETo (as experimental, using an evaporation pan or theoretical, using measured climatic data, e.g. the Blaney-Criddle method) it goes beyond the purpose of the present thesis, so indicative values were used, depending on the climatic zone (Arid, semi-arid, sub-humid, humid) and mean daily temperature (Low, medium and high). In the Guadiana case as the climatic zone is semi-arid and the mean daily temperature is medium (15/25 ºC) the indicative value of ETo is 5.
Once ETo is defined the next step is to find the value of Kc (crop factor), which depends on the climate, type of crop and growth stage of the crop, in order to obtain ETcrop. The relationship between the reference grass crop and the crop actually grown is given by the crop factor, Kc, through the next equation:
ETo × Kc = ETcrop (9) With ETcrop: Crop evapotranspiration (mm/day)
Kc: Crop factor
ETo: Reference evapotranspiration (mm/day)
Once again the values for Kc were provided by the FAO Natural Resources Management and Environment Department. These values vary from crop to crop and as all three WUS have different types of crop (Oranges, Olives and Grapes) hence the value of ETcrop will differ from WUS to WUS.
3.2.2. Total Precipitation
The variable total precipitation (PP) allows the use of less VA, once it’s also another source of water. Increased heating due to climate change leads to greater evaporation and thus surface drying, increasing the intensity and duration of drought. However, the water holding capacity of air increases, which leads to increased water vapor in the atmosphere. Hence, storms with increased moisture produce more intense precipitation events, increasing the risk of floods. With modest changes in wind, patterns of precipitation do not change much, but result in dry areas becoming drier and wet areas becoming wetter. (Trenberth, Kevin E. 2011).
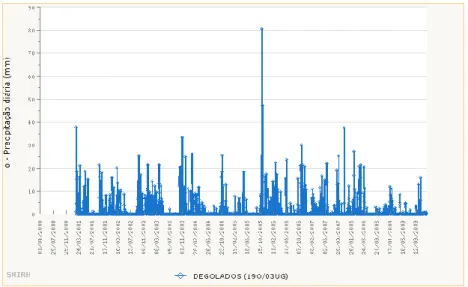
In order to obtain information regarding the precipitation values in the area being studied, the SNIRH website (http://snirh.apambiente.pt) provides the user with a great amount of information about precipitation values in various different regions. Once the river basin is selected it’s easy to obtain information about a particular area, in this case the WUS. The figure below is an example of how the information about total precipitation was obtained through the meteorological station called Degolados of the Water Use System 1. The period
of time selected for all three WUS was the average value of ten years, for a more precise result, using the daily precipitation.
Figure 7 - Example of how the values of precipitation were obtained through SNIRH
The image below allows a more visual understanding of how the precipitation varies during a period of ten years in the WUS 1 area.
3.2.3. Abstracted water from the main source
The abstracted water from the main source also known as the variable VA was determined according to the amount of water each WUS needed. The quantity of VA decreases as PP increases as there’s no need for more water to be abstracted when there’s another source involved. However, the opposite happens to VA when the value of ET increases, as the variable ET represents the quantity of water that the crop needs for Evaporation and Transpiration as mentioned in section 4.1.1. Having in mind that there’s no other source of water as OS is considered to be zero.
3.2.4. Return Flow
The value of the Return Flow variable (RF) was based on the type of irrigation considered for that particular WUS. The type of irrigation chosen influences runoff losses and deep percolation, for instances, which influences the amount of water that returns to the main source and also its quality and benefits. Having in mind that there must be water balance at all times.
3.2.5. Potential Return
The Potential Return (RP) represents all the water that doesn’t return back to the main source. It’s for example the water that infiltrates the soil and wonders off to neighbors land. The values were also obtained having in mind the type of irrigation for that particular WUS, as depending on the irrigation type the probability of occurring deep percolation or runoff losses are higher or lower. Based on that the quantities were estimated, always maintaining water balance. Both quality and benefit weights were also estimated according to irrigation type.
3.2.6. Volume Upstream and Volume Downstream
As it was mentioned previously the present thesis the WUS at a Meso-Efficiency level. With that in mind only equation (2) will be used. In this equation all variables are used except the Volume Upstream (VU) and the Volume Downstream (VD) so their values are irrelevant for this present study.
3.2.7. Other Sources and Non-Reusable
The present study does not consider that there’s water provided from any other source but the rivers (main source) and there’s no non-reusable water, which means that both OS and NR are considered to be zero.
3.3. Calculating Water Quality through the Canadian Water Quality Index
In order to analyze the water’s quality we are given a great amount of parameters regarding the water quality. However, the CCME (Canadian Council of Ministers of the Environment) Water Quality Index compiles all the complicated data, providing an easier way to overcome the complex information regarding water quality parameters, which is based on a formula developed by the British Columbia Ministry of Environments, Lands and Parks and modified by Alberta Environment. Through the process mentioned below, it’s possible to summarize a great amount of information into a single value and easy for anyone to interpret.
Through this index it will be possible to understand if the water in cause is actually good enough to be used for a determined purpose, which in this particular case is irrigation. However, all the necessary information, such as time period, variables and objectives must be gathered beforehand.
To calculate the water quality index one must attend to the factors below:
1. F1(Scope) During a considered period of time F1 is the percentage of variables that do not meet their objectives at least once, relative to the total number of variables measured:
F1 = (Number of failed variablesTotal number of variables) × 100 (10)
2. F2 (Frequency) represents the percentage of individual tests that do not meet the objectives:
F2 = (Number of failed testsTotal number of tests) × 100 (11)
3. F3 (Amplitude) represents the amount by which failed test values do not meet their objectives. F3 is calculated in three steps.
i) The number of times by which an individual concentration is greater than the objective is called an excursion
excursioni =(
Failed Test Valuei
Objectivej ) − 1 (12)
For the cases in which the test value must not fall below:
excursioni =(
𝑂𝑏𝑗𝑒𝑐𝑡𝑖𝑣𝑒𝑗
𝐹𝑎𝑖𝑙𝑒𝑑 𝑇𝑒𝑠𝑡 𝑉𝑎𝑙𝑢𝑒𝑖) − 1 (13)
ii) Summing the excursions of individual tests from their objectives and diving by the total number of tests. nse = ∑ excursioni n i=1 number of tests (14) Finally to calculate F3: F3 = ( 0.01nse+0.01nse ) (15)
After all three factors have been calculated, it’s possible to obtain the index by summing these factors, through the next equation:
CCMEWQI = 100 - ( √F1²+F2²+F3²1.732 ) (16)
The divisor 1.732 normalizes the resultant values to a range between 0 and 100, where 0 represents the worst water quality and 100 represent the best water quality.
Once the CCME WQI value has been determined, water quality is ranked by relating it to one of the following categories:
Excellent: (CCME WQI Value 95-100) – water quality is protected with a virtual
Good: (CCME WQI Value 80-94) – water quality is protected with only a minor degree of threat or impairment; conditions rarely depart from natural or desirable levels.
Fair: (CCME WQI Value 65-79) – water quality is usually protected but occasionally
threatened or impaired; conditions sometimes depart from natural or desirable levels.
Marginal: (CCME WQI Value 45-64) – water quality is frequently threatened or
impaired; conditions often depart from natural or desirable levels.
Poor: (CCME WQI Value 0-44) – water quality is almost always threatened or
impaired; conditions usually depart from natural or desirable levels.
Given the previously mentioned process of calculating the water quality it’s now possible to analyze the water of the river in hand. As the purpose of this water is entirely for irrigation it’s easier organize all the different parameters that make the water suitable for irrigation or not. The Portuguese law defines several parameters for various different ends, so in case of irrigation Decree Law 236/98 Annex XVI allows the user to know if that particular water obeys or not the precise Law regarding irrigation. This Annex contains 29 different parameters which include, for example: pH, Nickel, Zinc, Salinity, Copper, Lead, Cobalt, among others.
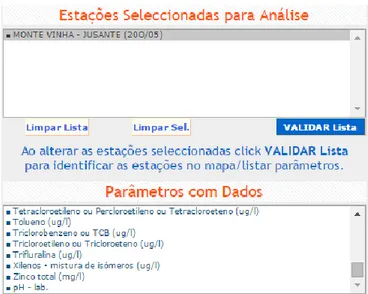
For each Water Use System the nearest Hydrometric Station was selected (All this information was provided by the site SNIRH – Portuguese Environmental Agency) in order to obtain all the parameters necessary to obey the irrigation law as well as enough information to use the Canadian Quality Index mathematical framework.
The figure below was obtain from the previously mentioned site SNIRH and has an example of Hydrometric Station selected for WUS 2 called Monte Vinha – Jusante, which can be observed in the first box as the second one has all the parameters, with their respective unit, related to that station and consequently that water.
Figure 9 - Example of how data was obtained for WUS 2 figure from SNIRH
3.4. Water Allocation Policy
Due to several factors such as climate change, which is one the main focus of this dissertation, that make water scarcity a great problem there is an increased concern about how water should be distributed according to need and priority, for example to guarantee enough water for all demands. So economic consideration has developed a big part in all that’s of public concern, such as reallocation proposals and other water policies and water projects. (Dinar, Ariel et al. 1997). When done correctly it’s possible to take a great advantage of its benefits, like achieving higher levels of efficiency and equity satisfying the needs of those whom are involved.
Based on an example given by Loucks, D.P. & Van Beek, E. (2005) about a water allocation problem, four different Policies were defined, such as:
Policy 1: The minimum amount of water in the river is 2 units;
Policy 2: WUS 3 is the only one that receives water and it can go up to 2 units;
Policy 3: WUS 1 and WUS 2 are able to receive water in equal amounts until both
have also 2 units;
Policy 4: After all three WUS have two units all receive water equally until the
All quantities units used in the previous sections were defined in millimeters per day however, for a better understanding they will be called only units.
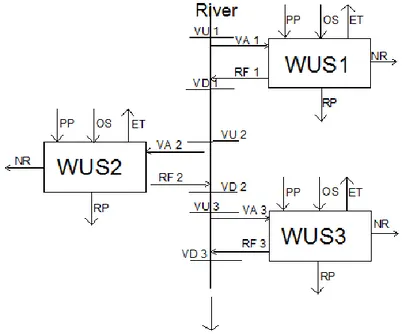
In other words and according to the hypothetical Water Allocation Policy considered:
At all times there must be 2 units in the river;
VD1=VU2 and VD2=VU3 which means that there won’t be any other source of water
entering the river;
WUS 3 has priority over the two remaining WUS, meaning that it will be the first one
to receive water;
Once WUS 3 receives a total of 2 units, the remaining two will receive equally the
same amount;
When all tree WUS achieve 2 units they all start to receive equally;
WUS 3 will be the first one to receive its total amount of 3 units, as VA3 = 3;
As WUS 3 won’t need to receive any more as its total amount was satisfied, WUS 1
and WUS 2 will continue to receive equal amounts until they fulfil their goals of 4 units each;
The figure below allows a more visual understanding of what has been said.
Figure 10 – General schematic of the WUS display throughout the main source with all variables defined.
Table 2 - Description of all variables represented in figure 9
Variable Description
ET Evapotranspiration
NR Nonreusable,water consumption
OS Water from other sources
PP Total precipitation
RF Return flows
RP Potential return (does not return to
the main source)
VA Abstracted water from the main
source
VD Volume of water downstream after
RF in the main source
VU Volume of water upstream before
4. RESULTS
The Figure below shows the location of all three WUS that were considered for this study – Sefficiency and represents a more visual form of what is present in the general schematic in figure 9. Throughout the Guadiana River which is the main source, three plots of land with different crops, which are oranges, olives and grapes, were studied.
Figure 11 - Image obtained from Google maps with the WUS localization
4.1. Water Use System 1
In order to analyze Sefficiency the first Water Use System will be considered a small agricultural land of about a hectare. This land produces olives which are of a great importance in the Mediterranean region as the source of olive oil.
In Portugal the main region of olive trees cultivation is where WUS is localized which is in the Alentejo (42%) (INE, 2009). As an example, during the year of 2009 in all of Portugal 362.600 tons of olives were produced with 380.700 ha of cultivated area and 0.95 Ton/ha yield (OLIVAE, Official magazine of the international Olive Council / FAOSTAT).
4.1.1. Evapotranspiration WUS1
According to the information granted by the FAO Natural Resources Management and Environment Department about olives the values of Kc for wide spacing of trees is 0.4 and for close spacing of trees is 0.7. In this particular case, it was considered close spacing of trees, so Kc = 0.7. As the climatic zone of area being studied is semi-arid and the mean daily temperature is medium the value given for ET0 is 5 mm/day. In consonance with the equations mentioned in section 3.2.1. the value for the variable ET for the olive trees is 3.5
mm/day.
𝐸T crop = 5 × 0.7 = 3.5 mm/day (17)
4.1.2. Total Precipitation WUS1
There’s a particular time of the year when the olive trees, in this case, need water, this is, during the growing season. For them the growing season is from April to December, so the values of precipitation only have interest if they’re during these months. For the sake of being a bit more precise an interval of ten years was considered in order to achieve the average precipitation value.
As mentioned above the total precipitation value was obtained from SNIRH and in this case for WUS 1 the meteorological station with the daily precipitation is called Degolados. The next table contains the minimum, maximum and average value of daily precipitation during ten years.
Table 3 - Values of PP for WUS 1 Total Precipitation PP (mm/day)
Minimum Maximum Average
4.1.3. Water Quality
To analyze the water quality according to the Canadian Water Quality Index there was a need to understand the Portuguese law regarding crop irrigation. Decree law number 236/98 Annex XVI attends to all specific parameters related to this topic allowing the reader to know if the water in hand may or may not be used for irrigation, as specified in section 3.3.
The site SNIRH from the Agencia Portuguesa do Ambiente (Portuguese Environmental Agency) provides a wide range of information about different parameters regarding the water quality of the desired river. The closest Hydrometric station to the WUS 1 is called Xevora and allowed the water quality to be analyzed.
Once all variables were obtained (pH, arsenic, cadmium, lead, chromium, iron, manganese, nickel, zinc, nitrates and total suspended solids – eleven variables-) and compared to the Portuguese Decree Law mentioned above only one parameter didn’t meet the objective out of a total of 62 tests. The failed parameter was total suspended solids with 61 mg/L which the objective failed to meet was of 60 mg/L. (See Annex A)
Section 3.3. explains each equation in more detail.
𝐹1 = (𝑁𝑢𝑚𝑏𝑒𝑟 𝑜𝑓 𝑓𝑎𝑖𝑙𝑒𝑑 𝑣𝑎𝑟𝑖𝑎𝑏𝑙𝑒𝑠𝑇𝑜𝑡𝑎𝑙 𝑛𝑢𝑚𝑏𝑒𝑟 𝑜𝑓 𝑣𝑎𝑟𝑖𝑎𝑏𝑙𝑒𝑠) × 100 ↔ 𝐹1 = (111) × 100↔ 𝐹1 = 9.090909 (18) 𝐹2 = (𝑁𝑢𝑚𝑏𝑒𝑟 𝑜𝑓 𝑓𝑎𝑖𝑙𝑒𝑑 𝑡𝑒𝑠𝑡𝑠𝑇𝑜𝑡𝑎𝑙 𝑛𝑢𝑚𝑏𝑒𝑟 𝑜𝑓 𝑡𝑒𝑠𝑡𝑠) × 100 ↔ 𝐹2 = (621) × 100↔ 𝐹2 = 1.612903 (19) Excursion1=( 𝐹𝑎𝑖𝑙𝑒𝑑 𝑇𝑒𝑠𝑡 𝑉𝑎𝑙𝑢𝑒𝑖 𝑂𝑏𝑗𝑒𝑐𝑡𝑖𝑣𝑒𝑗 ) − 1 ↔excursion1=( 61 60) − 1 ↔ excursion1 =0.016667 (20) nse = ∑ 𝑒𝑥𝑐𝑢𝑟𝑠𝑖𝑜𝑛𝑖 𝑛 𝑖=1 𝑛𝑢𝑚𝑏𝑒𝑟 𝑜𝑓 𝑡𝑒𝑠𝑡𝑠 ↔ nse = 0.016667 62 ↔ nse = 0.000269 (21) F3 = ( 0.01𝑛𝑠𝑒+0.01𝑛𝑠𝑒 ) ↔ F3 =( 0.01× 0.000269+0.01 0.000269 ) ↔ F3 =0.026874 (22) CCMEWQI = 100 - ( √𝐹1²+𝐹2²+𝐹3² 1.732 ) ↔
4.1.4. Variable Values
Once the values that needed to be calculated are obtained, the remaining are assumed and explained below.
Table 4 - Water Balance Quantities
Both outflow and inflow must represent water balance (Mass Conservation) meaning that all that enters must leave. According to the data found regarding VA and PP the total inflow is 5 mm/day and considered that OS is 0 mm/day, meaning that there isn’t another source that can provide inflow. Also the data found for ET is 3.5 mm/day and the remaining outflow variables where assumed due to the fact that the system is hypothetical. As drip irrigation is assumed leads us to attribute a small value for RP 0.2 mm/day, once deep percolation is prevented by this irrigation method, and consequently the return flow to the main source is 1.3 mm/day, mainly through the root area. Once all quantities are defined the next stage is to define the usefulness of the variables, in quality and benefits.
Table 5 - Quality Weights Wq
Variable Value (mm/day) VA 4 RF 1.4 NR 0 RP 0.2 ET 3.5 PP 1.1 OS 0 VU 1 VD 1 Variable Value (mm/day) VA 0.97