Genetic variability of rice recurrent selection populations as affected
by male sterility or manual recombination
Letícia da Silveira Pinheiro(1), Paulo Hideo Nakano Rangel(1), Rosana Pereira Vianello(1) and Claudio Brondani(1)
(1)Embrapa Arroz e Feijão, Caixa Postal 179, CEP 75375‑000 Santo Antônio de Goiás, GO, Brazil. E‑mail: [email protected], [email protected], [email protected], [email protected]
Abstract – The objective of this work was to determine the effect of male sterility or manual recombination on genetic variability of rice recurrent selection populations. The populations CNA-IRAT 4, with a gene for male sterility, and CNA 12, which was manually recombined, were evaluated. Genetic variability among selection cycles was estimated using14 simple sequence repeat (SSR) markers. A total of 926 plants were analyzed, including ten genitors and 180 individuals from each of the evaluated cycles (1, 2 and 5) of the population CNA-IRAT 4, and 16 genitors and 180 individuals from each of the cycles (1 and 2) of CNA 12. The analysis allowed the identification of alleles not present among the genitors for both populations, in all cycles, especially for the CNA-IRAT 4 population. These alleles resulted from unwanted fertilization with genotypes that were not originally part of the populations. The parameters of Wright’s F-statistic (FIS and FIT) indicated that the manual recombination expands the genetic variability of the CNA 12 population, whereas male sterility reduces the one of CNA-IRAT 4.
Index terms: Oryza sativa, allele variation, rice breeding, molecular markers, population improvement.
Variabilidade genética de populações de seleção recorrente de arroz,
influenciada por macho‑esterilidade ou recombinação manual
Resumo – O objetivo deste trabalho foi determinar os efeitos da macho-esterilidade ou da recombinação manual sobre a variabilidade genética de populações de seleção recorrente de arroz. Foram avaliadas as populações CNA-IRAT 4, com gene de macho-esterilidade, e CNA 12, recombinada manualmente. A variabilidade genética entre os ciclos de seleção foi estimada por 14 marcadores de sequências simples repetidas (SSR). Foram analisadas 926 plantas, incluindo dez genitores e 180 indivíduos de cada um dos ciclos avaliados (1, 2 e 5) da população CNA-IRAT 4, e 16 genitores e 180 indivíduos de cada um dos ciclos (1 e 2) da CNA 12. A análise possibilitou a identificação de alelos não existentes nos genitores nas duas populações, em todos os ciclos, principalmente para a população CNA-IRAT 4. Esses alelos foram resultantes da fecundação indesejada a partir de genótipos que não faziam parte das populações. Os parâmetros da estatística F de Wright (FIS e FIT) indicaram que a recombinação manual amplia a variabilidade genética da população CNA 12, enquanto a macho-esterilidade reduz a de CNA-IRAT 4.
Termos para indexação: Oryza sativa, variação alélica, melhoramento do arroz, marcadores moleculares, melhoramento populacional.
Introduction
The recurrent selection population breeding method,
first proposed by Hull (1945), consists of a cyclical and
iterative process of selection, and of the subsequent recombination of the best families or progenies. This process provides, theoretically, a gradual increase in the frequency of favorable alleles in the population, with no reduction in genetic variability. The increased frequency of these alleles results in a higher probability of success in obtaining superior inbred lines (Borém & Miranda, 2005). Therefore, the choice of the genitors
that will begin the population is of fundamental importance, since the future genetic gains will depend on the high combining ability of the genitors.
recombination in the field without the need for manual
crosses. It was initiated by the interbreeding of ten cultivars/lines used in irrigated cultivation systems,
and resulted in the world’s first cultivar derived from
recurrent selection – originally named SCS-BRS Tio Taka, released in 2002 (Rangel et al., 2007). Other populations from irrigated cultivation systems were obtained later, such as CNA 1 in 1991, CNA 5 in 1993, CNA 11 in 1996, and CNA 12 (also used in the present study) in 2002 (Rangel & Neves, 1997; Rangel et al., 2003).
The monitoring of genetic variability among generations of recurrent selection populations is based on the calculation of genetic gains. Despite being an essential parameter, this estimate is not able to indicate whether the procedures adopted to conduct the population facilitate the occurrence of new combinations or whether the genetic variability is being exhausted by the intensity of selection or simply by drift resulting from preferential mating (Courtois et al., 2003). The use of molecular markers allows for the tracking of the number and frequency of alleles, which determinate the population parameters that can increase the genetic gains in populations of recurrent selection (Ferreira et al., 2000). Among the molecular markers, microsatellites or simple sequence repeats (SSR) stand out for their high information content, co-dominance, large number of loci available for
rice, and ability to be amplified by polymerase chain
reaction (PCR) (Semagn et al., 2006). SSR markers have been used to monitor the genetic variability over cycles of recurrent selection in crops like rice (Ramis et al., 2003), wheat (Liu et al., 2007), barley (Emebiri,
2010), and maize (Wisser et al., 2008). However, the
utility of molecular markers to monitor the genetic variability and to administrate the allele variation among cycles of recurrent selection populations still needs to be assessed for rice.
The objective of this work was to determine the genetic variability of the recurrent selection populations CNA-IRAT 4, with a gene for male sterility, and CNA 12, which was manually recombined, as well as to evaluate the effect of manual or male-sterility recombination on genetic variability.
Materials and Methods
The CNA-IRAT 4 population of rice (Oryza sativa L.) was recombined in the field through the
male sterility gene. The ten parents that initiated this population (BG 90-2, CNA 7, CNA 3815, CNA 3848, CNA 3887, Colombia 1, Eloni, Nanicão, UPR 103, and IR-36) and the 180 individuals from each of the assessed cycles (1, 2 and 5) were evaluated. These individuals were derived from S0 seeds, resulting from
the previous cycle of recombination (S0:1 seeds from
male-sterile plants).
In order to evaluate the CNA 12 population, which was manually recombined in greenhouse, the 16 parents that initiated this population (BRS Formoso, Oryzica-1, Chui, CNAi 9020, CNA 5287, CNA 8621, Oryzica Lhanos-4, IRGA 417, CNAi 9029, Java, Jequitiba, Taim, Diamante, CNA 8502, Maraj, and
Huan-Sen-Go) and the 180 individuals from each of
the cycles (1 and 2) were analyzed. These individuals were derived from F2 plant seeds, which resulted from
one selfing of hybrid plants manually recombined. The
seeds of 26 genitors and 360 individual plants from recurrent selection cycles were germinated and, after 20 days, harvested and stored at -20oC.
Samples of leaf tissue from each plantlet were used for DNA extraction according to Doyle & Doyle (1987). Seventeen SSRs loci (Table 1) were chosen for genotyping, based on their high information content and pattern resolution on acrylamide gels, and 14 loci were
used for each population. Amplification reactions were performed in a final volume of 15 μL containing 1.4 μL
Table 1. SSR markers used in the analysis of the CNA-IRAT 4 and CNA 12 populations and their location on the respective chromosome.
of Milli-Q autoclaved water, 1.5 μL of 10X buffer (with final concentration of 10 mmol L-1 Tris-HCl,
pH 8.3, 50 mmol L-1 KCl, and 1.5 mmol L-1 MgCl 2),
1.3 μL of dNTP (2.5 mmol L-1), 1.3 μL of DMSO (final
concentration of 50%), 0.2 μL of Taq polymerase (five units per μL), 4.3 μL of primer (0.9 mmol L-1), and
1.0 μL of genomic DNA (3.0 ng μL-1). The reactions
were conducted in a thermocycler PT-100 thermal controller (MJ Research, Watertown, MA, USA), with the following steps: a pre-cycle of 96°C for 2 min followed by 30 cycles of 94°C for 1 min, 56°C
for 1 min, 72°C for 1 min, and a final step of 72°C for 7 min. Electrophoresis of the amplified products
was performed on 6% denaturing polyacrylamide gels (containing 7.0 mol L-1 of urea), stained with silver
nitrate, following the protocol described by Creste et al. (2001).
The apparent outcrossing rate (ta) was calculated
by the formula ta = (1 - f)/(1 + f), in which f is the
inbreeding coefficient previously described by
Cockerham (1969).
Wright’s F-statistics was calculated using the formula: 1 - FIT = (1 - FIS) × (1 - FST), in which FIT
is the fixation index or inbreeding coefficient for all
the populations due to the reproductive system and subdivision; FIS is the setting or population inbreeding
coefficient due to the reproductive system; and FST
is the fixation index or inbreeding coefficient among
populations due to the subdivision.
The number of alleles per locus and the estimation
of genetic diversity (He) were calculated using the
program GDA (Lewis & Zaykin, 2002). The inbreeding
coefficient (f) and Wright’s F-statistics (Wright, 1965)
were determined using the Powermarker software (Liu & Muse, 2004).
Results and Discussion
Based on the number of parental alleles, which were not sampled in one cycle but reappeared in the next one, results indicated that 93 to 94% of the alleles of the parents were sampled every cycle, which is
sufficient for assessing the genetic variability over the
cycles. The total number of alleles from the genitors of the CNA-IRAT 4 population decreased continuously from cycles 1 through 5, showing that the process of recombination and selection of individuals leads to the loss of allelic variability (Table 2). This may be related
to the increase in the frequency of the best-fit alleles
or to the presence, during recombination in the field,
of a group of plants that were taller or had a higher pollen production, which allowed a better dispersion of pollen.
Estimates of the ta were higher for the CNA-IRAT
4 population, although stabilized between cycles 2 and 5 (Table 3). Contrarily, there was a considerable increase in the ta in just one cycle of recombination
in the CNA 12 population, which indicates that the planned recombination between families contributed to the reduction of inbreeding in this population and, consequently, to an increase in the ta.
Table 3. Average inbreeding coefficient (f) and apparent outcrossing rates (ta) detected for each cycle of recurrent selection in the CNA-IRAT 4 and CNA 12 populations.
Selection cycle f (average) ta(1)
CNA-IRAT 4
Cycle 1 0.24 0.61
Cycle 2 0.30 0.54
Cycle 5 0.29 0.55
CNA 12
Cycle 1 0.61 0.24
Cycle 2 0.55 0.29
(1)t
a = (1-f)/(1+f); f, according to Cockerham (1969).
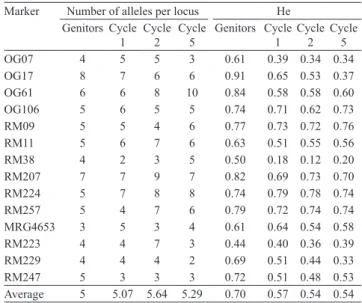
Table 2. Number of alleles per locus in the genitors and in the individuals sampled in the selection cycles, and estimation of genetic diversity (He) values for the SSR markers used in the analysis of recurrent selection of CNA-IRAT 4 population.
Marker Number of alleles per locus He
Genitors Cycle 1
Cycle 2
Cycle 5
Genitors Cycle 1
Cycle 2
Cycle 5
OG07 4 5 5 3 0.61 0.39 0.34 0.34
OG17 8 7 6 6 0.91 0.65 0.53 0.37
OG61 6 6 8 10 0.84 0.58 0.58 0.60
OG106 5 6 5 5 0.74 0.71 0.62 0.73
RM09 5 5 4 6 0.77 0.73 0.72 0.76
RM11 5 6 7 6 0.63 0.51 0.55 0.56
RM38 4 2 3 5 0.50 0.18 0.12 0.20
RM207 7 7 9 7 0.82 0.69 0.73 0.70
RM224 5 7 8 8 0.74 0.79 0.78 0.74
RM257 5 4 7 6 0.79 0.72 0.74 0.74
MRG4653 3 5 3 4 0.61 0.64 0.54 0.58
RM223 4 4 7 3 0.44 0.40 0.36 0.39
RM229 4 4 4 2 0.69 0.51 0.44 0.33
RM247 5 3 3 3 0.72 0.51 0.48 0.53
In the CNA-IRAT 4 population, 105 alleles were
identified (average of 7.5 alleles per locus). Among the genitors, 74 alleles were detected (average of five
alleles per locus) (Table 2). In cycles 1, 2 and 5, a total of 71 (average of 5.07 alleles per locus), 79 (average of 5.64 alleles per locus), and 73 alleles (average of 5.28 alleles per locus) were found, respectively.
The values for the genetic variability estimates (He)
for the genitors ranged from 0.91 (marker OG17)
to 0.44 (RM223), with an average of 0.70. The first
cycle ranged from 0.79 (RM224) to 0.18 (RM38), with an average of 0.57; the second cycle ranged from 0.78 (RM224) to 0.12 (RM38), with an average of
0.54; and the fifth cycle ranged from 0.76 (RM09) to
0.20 (RM38), with an average of 0.54.
In the CNA 12 population, 95 alleles were identified
(average of 6.7 alleles per locus) (Table 4). Among the genitors, 83 alleles (average of 5.93 alleles per locus) were detected, whereas in cycles 1 and 2, a total of 76 (average of 5.43 alleles per locus) and 87 alleles (average of 6.21 alleles per locus) were found, respectively. The
He values ranged from 0.84 (RM224) to 0.47 (OG07) for the genitors, with an average of 0.68. In the first cycle, the He values ranged from 0.78 (OG17 and
RM224) to 0.4 (RM38), with an average of 0.59; and, in the second cycle, the values ranged from 0.78 (OG17) to 0.36 (RM247), with an average of 0.57. The genitors
from each population showed a higher He average in
comparison to those from the subsequent recurrent selection cycles, which showed little average variation
as a result of the natural fluctuations in the number and
frequency of alleles detected over the cycles.
The values for the number of alleles per locus obtained in the CNA-IRAT 4 and CNA 12 populations were similar to the averages found in other rice populations of recurrent selection. For example, the CNA 7 population, which was developed through the use of male sterility, showed averages of 5.3 and 5.0 alleles per locus for cycles 0 and 2, respectively, through the genotyping of 96 individuals per cycle using ten SSR markers (Badan et al., 2005). The recurrent selection population PFD-1, developed in Venezuela
and recombined in the field using the male-sterility
gene, was also analyzed by SSRs, and similar values were found using ten markers in 92 individuals per cycle, with an average of 5.3 and 4.6 alleles per locus for cycles 0 and 2, respectively (Ramis et al., 2003). In another study, seven SSR markers were used to genotype 55 individuals in cycle 0 and 60 individuals in cycle 3, of the CNA 5 recurrent selection population, resulting in 5.14 and 4.5 alleles per locus, respectively (Ferreira et al., 2000). The similar averages found in the different cycles and populations indicate that recurrent
selection populations preserve a sufficient number of
alleles per locus, which is necessary for obtaining new allelic combinations and, consequently, for increasing the chances of obtaining individuals with superior agronomic performance.
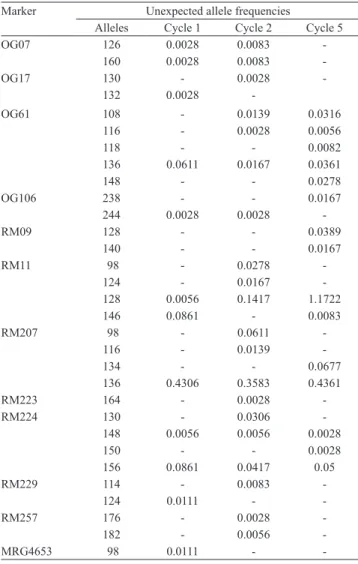
Alleles not previously detected in the genitors of both recurrent selection populations were observed. Thirty one alien alleles (29.5% of the total alleles detected) were sampled for the CNA-IRAT 4 population: 12 were found in cycle 1, 20 in cycle 2, and 15 in cycle 5 (Table 5). Only markers RM38 and RM247 did not detect alien alleles. The highest number of alien alleles
(five alleles each) was detected by the RM207 and
RM11 markers, when considering the three analyzed cycles. Despite their low frequency, these alleles could be detected in subsequent cycles, including unexpected alleles 126 and 160 (marker OG07) in cycles 1 and 2, which were not detected in cycle 5. Some alleles also increased their frequency in the population, such as allele 128 (marker RM11). Allele 146 (RM11) was detected in cycles 1 and 5, but not in cycle 2, most likely due to the number of individuals sampled. Nine unexpected alleles continued from cycle 1 through Table 4. Number of alleles per locus in the genitors and in the
individuals sampled in the selection cycles, and estimation of genetic diversity (He) values for the SSR markers used in the analysis of recurrent selection of CNA 12 population.
Marker Number of alleles per locus He
Genitors Cycle 1 Cycle 2 Genitors Cycle 1 Cycle 2
OG07 4 3 5 0.47 0.43 0.42
OG17 7 7 8 0.83 0.78 0.78
OG61 8 9 10 0.74 0.70 0.61
OG106 4 3 4 0.56 0.50 0.55
RM09 7 6 6 0.77 0.70 0.63
RM11 7 7 7 0.64 0.59 0.65
RM38 5 4 6 0.70 0.40 0.47
RM207 5 4 6 0.70 0.61 0.68
RM224 7 6 6 0.84 0.78 0.74
RM257 5 3 6 0.65 0.48 0.60
RM247 6 6 6 0.56 0.43 0.36
RM204 6 6 5 0.75 0.67 0.60
RM248 6 6 7 0.69 0.54 0.45
MRG4961 6 6 5 0.69 0.63 0.47
cycle 2 but were not detected in cycle 5, whereas four alien alleles were maintained over the three evaluated cycles (OG61, RM11, RM207, and RM224). Twelve unexpected alleles were detected in cycle 2 and seven remained until cycle 5. In cycle 5, eight alleles that had not been previously detected in cycles 1 and 2 were
identified. The detection of alien alleles indicates that
the recombination in CNA-IRAT 4 included these alien alleles, which were not present in the genitors and could
potentially be fixed in the population, undermining the objective to fix the best fit alleles from the genitors.
The occurrence of unexpected alleles in the CNA 12 population was less frequent than in the CNA-IRAT 4 population. In total, 12 alien alleles were detected in cycles 1 and 2 (12.63% of the total alleles detected) (Table 6). The unexpected alleles detected in the
manually recombined CNA 12 population may have been derived from a controlled pollination failure during or resulting from cross-pollination in
the field – either for obtaining F2 plants or for the
evaluation and selection of the F2:3 or F2:4 families. In a
study of recurrent selection in two maize populations, in which the progenies were analyzed by RFLP and SSR markers, alien alleles were detected at a ratio of approximately 10% of the last analyzed cycles (Falke et al., 2007).
Cultivated rice is predominantly self-pollinating, with a low percentage of natural cross-pollination, typically less than 1%, which can be higher, for example, between adjacent panicles that are in physical contact (Reaño & Pham, 1998). The results found here showed that, regardless of the method used for recombination (manual or male-sterility), the occurrence of alien alleles is a reality in recurrent
selection. The identification of individuals with alien
alleles during the recombination step would allow the elimination of those genotypes, maintaining only the individuals with parental alleles. In both of the analyzed populations, alien alleles were detected in all evaluated cycles. In CNA-IRAT 4, the alien alleles were
identified in 149 individuals (83.33%) in cycle 5. The
high number of unexpected alleles in the CNA-IRAT 4 population may be primarily attributed to fertilization with pollen of rice plants cultivated in adjacent areas during the recombination step. In contrast, the CNA 12 population showed 14 individuals with alien alleles (7.78%) in cycle 2. To avoid unexpected alleles in CNA 12, special care should be taken during manual crossing.
Table 5. Frequency of unexpected alleles in the CNA-IRAT 4 population.
Marker Unexpected allele frequencies
Alleles Cycle 1 Cycle 2 Cycle 5
OG07 126 0.0028 0.0083
-160 0.0028 0.0083
-OG17 130 - 0.0028
-132 0.0028
-OG61 108 - 0.0139 0.0316
116 - 0.0028 0.0056
118 - - 0.0082
136 0.0611 0.0167 0.0361
148 - - 0.0278
OG106 238 - - 0.0167
244 0.0028 0.0028
-RM09 128 - - 0.0389
140 - - 0.0167
RM11 98 - 0.0278
-124 - 0.0167
-128 0.0056 0.1417 1.1722
146 0.0861 - 0.0083
RM207 98 - 0.0611
-116 - 0.0139
-134 - - 0.0677
136 0.4306 0.3583 0.4361
RM223 164 - 0.0028
-RM224 130 - 0.0306
-148 0.0056 0.0056 0.0028
150 - - 0.0028
156 0.0861 0.0417 0.05
RM229 114 - 0.0083
-124 0.0111 -
-RM257 176 - 0.0028
-182 - 0.0056
-MRG4653 98 0.0111 -
-Table 6. Frequency of unexpected alleles in the CNA 12 population.
Marker Unexpected allele frequencies
Alleles Cycle 1 Cycle 2
OG07 146 - 0.0056
OG17 114 - 0.0056
160 - 0.0083
OG61 132 - 0.0194
138 0.0184 0.0056
RM11 122 - 0.0028
134 0.0031
-RM38 280 - 0.0083
RM207 130 - 0.025
RM248 88 - 0.0083
RM257 170 - 0.0028
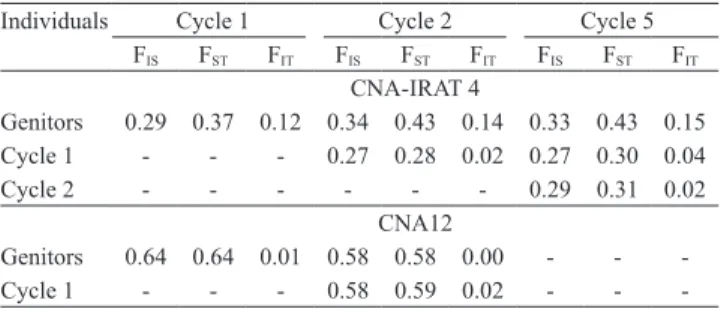
-The loss of genetic variability or an increase in inbreeding could be estimated by Wright’s F-statistic, which is able to measure the effects of the fragmentation of the population (FST) and of the reproductive system
(FIS) (Brondani et al., 2005). In the CNA-IRAT 4
population, the FST values of the genitors and individuals
in the cycles were always higher than or equal to the FIS values, indicating that inbreeding was mainly due
to subdivision, i.e., resulting from preferential crosses between certain groups of individuals (Slatkin, 1995). In addition, a higher differentiation between cycles was observed in this population, as the variation of FST was
higher among the group of genitors and the last cycle (Table 7), indicating a tendency towards differentiation between the genitors and the progeny. The CNA 12 population differed from CNA-IRAT 4, since the FST and FIS values declined between the genitors and
cycle 2 (Table 7).
The value of total inbreeding (FIT) of the
CNA-IRAT 4 population increased over the cycles, when compared to the genitors, in spite of the presence of alien alleles. The FIT values of cycles 1 and 2 of
CNA 12 declined in comparison to the inbreeding of the genitors. This indicates that the manual recombination is broadening the genetic variability in this population. The calculated values for FIS within
each cycle showed that the CNA-IRAT 4 and CNA 12 populations are going in opposite directions: while the number of heterozygous loci decreased with the progression of cycles in CNA-IRAT 4, this number increased due to the manual crosses in CNA 12. The
deficit in the number of heterozygous SSR loci was
also observed in the CNA 7 and PFD-1 (recombined using a male-sterility gene) populations (Badan et al., 2005). According to Ramis et al. (2003), the reduced number of heterozygous loci may be attributed to the existence of preferred crossings, few opportunities for recombination in the base population or the presence of some degree of inbreeding within the population. Planned crosses, despite the need for an increase in the workforce, are recommended because they ensure the allelic recombination of all genitors.
Conclusions
1. Based on SSR marker analysis, the CNA-IRAT 4 and CNA 12 populations are established from parents of a broad genetic basis.
2. In both populations, alleles that did not originate from the genitors are present.
3. Manual recombination is expanding the genetic variability of the CNA 12 population, whereas recombination using the male-sterility gene is reducing the genetic variability of the CNA-IRAT 4 population.
Acknowledgments
To Coordenação de Aperfeiçoamento de Pessoal de Nível Superior, for the scholarship granted; and to
Conselho Nacional de Desenvolvimento Científico e Tecnológico, for financial support.
References
BADAN, A.C.C.; GUIMARÃES, E.P.; RAMIS, C. Genetic gain for resistance to blast in a rice population. In: GUIMARÃES, E.P. (Ed.). Population improvement: a way of exploiting the genetic resources of Latin America. Cali: Centro Internacional de Agricultura Tropical, 2005. p.229-329.
BORÉM, A.; MIRANDA, G.V. Seleção recorrente. In: BORÉM, A. (Ed.). Melhoramento de plantas. 4.ed. Viçosa: UFV, 2005. p.283-303.
BRONDANI, C.; BRONDANI, R.P.V.; RANGEL, P.H.N.; FERREIRA, M.E. Development and mapping of Oryza
glumaepatula – derived microsatellite markers in the interspecific
cross Oryza glumaepatula x Oryza sativa. Hereditas, v.134, p.59-71, 2001.
BRONDANI, R.P.V.; ZUCCHI, M.I.; BRONDANI, C.; RANGEL, P.H.N.; BORBA, T.C.O.; RANGEL, P.N.; MAGALHÃES, M.R.; VENCOVSKY, R. Genetic structure of wild rice Oryza
glumaepatula populations in three Brazilian biomes using
microsatellite markers. Genetica, v.125, p.115-123, 2005. Table 7. Comparison of the Wright statistics (FIS, FIT, and
FST)(1) between the cycles of recurrent selection in the CNA-IRAT 4 and CNA 12 populations.
Individuals Cycle 1 Cycle 2 Cycle 5
FIS FST FIT FIS FST FIT FIS FST FIT
CNA-IRAT 4
Genitors 0.29 0.37 0.12 0.34 0.43 0.14 0.33 0.43 0.15
Cycle 1 - - - 0.27 0.28 0.02 0.27 0.30 0.04
Cycle 2 - - - 0.29 0.31 0.02
CNA12
Genitors 0.64 0.64 0.01 0.58 0.58 0.00 - -
-Cycle 1 - - - 0.58 0.59 0.02 - -
-(1)Wright statistics, 1 - ˆF
IT = (1 - ˆFIS) × (1 - ˆFST) , in which: FIT is the fixation
index inbreeding coefficient due to the reproductive system and subdivision; FIS is the population inbreeding coefficient due to the reproductive system;
FST is the fixation index or inbreeding coefficient among the population due
BRUNES, T.O.; RANGEL, P.H.N.; BRONDANI, R.P.V.; MOURA NETO, F.; NEVES, P. de C.; BRONDANI, C. Fluxo gênico entre arroz vermelho e arroz cultivado estimado por meio de marcadores microssatélites. Pesquisa Agropecuária Tropical, v.37, p.86-92, 2007.
CHÂTEL, M.; OSPINA, Y.; RODRIGUEZ, F.; LOZANO, V.H.; DELGADO, H. Upland rice composite population breeding and selection of promising lines for Colombian savannah ecosystem.
Pesquisa Agropecuária Tropical, v.38, p.1-5, 2008.
CHEN, X.; TEMNYKH, S.; XU, Y.; CHO, Y.G.; MCCOUCH, S.R. Development of microsatellite framework map providing genome-wide coverage in rice (Oryza sativa L.). Theoretical and Applied Genetics, v.95, p.553-567, 1997.
COCKERHAM, C.C. Variance of gene frequencies. Evolution, v.23, p.72-84, 1969.
COURTOIS, B.; FILLOUX, D.; AHMADI, N.; NOYER, J.-L.; BILLOT, C.; GUIMARÃES, E.P. Uso de marcadores moleculares para el manejo de poblaciones de arroz mejoradas mediante selección recurrente. In: GUIMARÃES, E.P. (Ed.). Mejoramiento poblacional, una alternativa para explorar los recursos genéticos del arroz en américa latina. Cali: Centro Internacional de Agricultura Tropical, 2003. p.53-75.
CRESTE, S.; TULMANN NETO, A.; FIGUEIRA, A. Detection of single sequence repeat polymorfisms in denaturing polyacrylamide sequencing gels by silver staining. Plant Molecular Biology Reporter, v.19, p.229-306, 2001.
DOYLE, J.J.; DOYLE, J.L. Isolation of plant DNA from fresh tissue. Focus, v.12, p.13-15, 1987.
EMEBIRI, L.C. An EST-SSR marker tightly linked to the barley male sterility gene (msg6) located on chromosome 6H. Journal of Heredity, v.101, p.769-774, 2010.
FALKE, K.C.; FLACHENECKER, C.; MELCHINGER, A.E.; PIEPHO, H.P.; MAURER, H.P.; FRISCH, M. Temporal changes in allele frequencies in two European F2 flint maize populations under
modified recurrent full-sib selection. Theoretical and Applied Genetics, v.114, p.765-776, 2007.
FERREIRA, M.E.; PENTEADO, M.I.O.; BRONDANI, C.; BELÓ, A.; FERREIRA, M.A.; RANGEL, P.H.N. Caracterización y uso de marcadores RAPD y microssatélites (SSR) en el monitoreo del programa de mejoramiento poblacional en arroz. In: GUIMARÃES, E.P. (Ed.). Avances en el mejoramiento poblacional en arroz. Santo Antônio de Goiás: Embrapa Arroz e Feijão, 2000. p.37-64. HULL, F.H. Recurrent selection and specific combining ability in corn. Journal of the American Society of Agronomy, v.37, p.137-145, 1945.
LEWIS, P.O.; ZAYKIN, D. Genetic data analysis: computer program for the analysis of allelic data. Version 1.1. 2002. Available at: <http://hydrodictyon.eeb.uconn.edu/people/plewis/software. php>. Accessed on: 20 Feb. 2011.
LIU, J.; LIU, L.; HOU, N.; ZHANG, A.; LIU, C. Genetic diversity of wheat gene pool of recurrent selection assessed by microsatellite markers and morphological traits. Euphytica, v.155, p.249-258, 2007.
LIU, K.; MUSE, S. Powermarker: new genetic data analysis software. Version 3.0. 2004. Available at: <http://www. powermarker.net>. Accessed on: 16 Feb. 2011.
PANAUD, O.; CHEN, X.; MCCOUCH, S.R. Development of microsatellite markers and characterization of simple sequence length polymorphism (SSLP) in rice (Oryza sativa L.). Molecular and General Genetics,v.252, p.597-607, 1996.
RAMIS, C.; BADAN, A.C.C.; DÍAZ, A.; GAMBOA, C.E. Marcadores moleculares como herramientas para el mejoramiento poblacional en arroz. In: GUIMARÃES, E.P. (Ed.). Mejoramiento poblacional, una alternativa para explorar los recursos genéticos del arroz en América Latina. Cali: Centro Internacional de Agricultura Tropical, 2003. p.77-97.
RANGEL, P.H.N.; BRONDANI, C., MORAIS, O.P. de; SCHIOCHETT, M.; BORBA, T.C.O.; RANGEL, P.N.; BRONDANI, R.P.V.; YOKOYAMA, S.; BACHA, R.; ISHIY, T. Establishment of the irrigated rice cultivar SCSBRS Tio Taka by recurrent selection. Crop Breeding and Applied Biotechnology, v.7, p.103-110, 2007.
RANGEL, P.H.N.; CORDEIRO, A.C.C.; BRONDANI, C.; BRONDANI, R.P.V.; LOPES, S.I.G.; MORAIS, O.P.; SCHIOCCHET, M.; YOKOYAMA, S.; BACHA, R.; ISHIY, T. Avances en el mejoramiento poblacional del arroz de riego en Brasil. In: GUIMARÃES, E.P. (Ed.). Mejoramiento poblacional, una alternativa para explorar los recursos genéticos del arroz en América Latina. Cali: Centro Internacional de Agricultura Tropical, 2003. p.151-198.
RANGEL, P.H.N.; NEVES, P.C.F. Selección recurrente aplicada al arroz de riego en Brasil. In: GUIMARÃES, E.P. (Ed.). Selección recurrente en arroz. Cali: Centro Internacional de Agricultura Tropical, 1997. p.79-97.
REAÑO, R.; PHAM, J.L. Does cross-pollination between accessions occur during seed regeneration at the International Rice Genebank?
International Rice Research Notes, v.23, p.5-6, 1998.
SEMAGN, K.; BJORNSTAD, A.; NDJIONDJOP, M.N. An overview of molecular marker methods for plants. African Journal of Biotechnology, v.5, p.2540-2568, 2006.
SLATKIN, M. A measure of population subdivision based on microsatellite allele frequencies. Genetics, v.139, p.457-462, 1995.
WISSER, R.J.; MURRAY, S.C.; KOLKMAN, J.M.; CEBALLOS, H.; NELSON, R.J. Selection mapping of loci for quantitative disease resistance in a diverse maize population. Genetics, v.180, p.583-599, 2008.
WRIGHT, S. The interpretation of population structure by F-statistics with special regard to systems of mating. Evolution, v.19, p.395-420, 1965.