Received September 10, 2008 and accepted March 5, 2009. Corresponding author: [email protected]
ISSN 1806-9290 (on-line) www.sbz.org.br
Performance and carcass characteristics of beef cattle fed with ammoniated
marandugrass hay
1Marcella de Toledo Piza Roth2, Flávio Dutra de Resende3, Ricardo Andrade Reis4, Gustavo Rezende Siqueira3, Marcelo Henrique de Faria3, Telma Teresinha Berchielli4
1 Projeto financiado pela FAPESP.
2 Programa de Pós-Graduação em Zootecnia da UNESP/Campus de Jaboticabal.
3 Apta - Pólo Regional do Desenvolvimento dos Agronegócios da Alta Mogiana - Colina/SP.
4 Departamento de Zootecnia da UNESP/Campus de Jaboticabal. Pesquisador do CNPq e membro do INCT-CA.
ABSTRACT - This trial was conducted aiming to evaluate the effects of Brachiaria brizantha vegetative seed harvest residues hay treated with anhydrous ammonia (NH3) or urea, and protein sources on the steers performance, and carcass quality. Twenty-four male beef cattle were (12 F1 Nellore × Aberdeen Angus and 12 F1 Nellore × Red Angus), distributed in four treatments, with six replications. Animal crossbreed type and initial body weight were considered blocks. The diets were: Untreated hay supplemented with non-protein nitrogen (UHNPN); untreated hay supplemented with cottonseed meal (UHCM), hay treated with 5% urea (HTU), hay treated with 3% anhydrous ammonia (HTA) of DM%. Diets were formulated to be isoproteic and isoenergetic. The initial body weight (kg), daily DM intake (kg), and percentage of body weight (% BW) did not differ among treatments, and the average values observed were 422.6 kg, 10.24 kg, and 2.16% BW, respectively. Animals fed with HTA showed better daily weight gain, feed efficiency, 1.336 kg/day, and 7.78 kg/kg of weight gain, followed by the UHCM, 1.161 kg/day, and 8.98 kg/kg, respectively. Animals of the HTA showed highest NDF, ADF and cellulose intake. Carcass fat thickness was highest on the HTA animals, 6.3 mm.
Key Words: ammoniation, animal performance, carcass characteristics, chemical treatment, forage quality, haymaking
Desempenho e características de carcaça de bovinos de corte alimentados
com fenos de capim-marandu amonizados
RESUMO - Objetivou-se avaliar o efeito da inclusão da amônia anidra ou ureia em fenos de resíduo pós-colheita de sementes de Brachiaria brizantha e da fonte proteica suplementar ao feno não-tratado sobre o desempenho e as características de carcaça de bovinos confinados. Vinte e quatro animais não-castrados (12 animais F1 Nelore Aberdeen Angus, variedade preta, e 12 F1 Nelore Aberdeen Angus, variedade vermelha) foram distribuídos aleatoriamente em quatro tratamentos, totalizando seis repetições, considerando blocos o cruzamento e o peso inicial. As dietas experimentais consistiram de feno não-tratado suplementado com nitrogênio não-proteico; feno não-tratado suplementado com farelo de algodão; feno tratado com 5% de ureia; e feno tratado com 3% de amônia anidra (% MS). Os valores de peso vivo inicial, consumo diário e consumo relativo de MS não diferiram entre as dietas e apresentaram médias de 422,6 kg, 9,80 kg e 2,1%, respectivamente. O ganho médio diário (GMD) e a conversão alimentar apresentaram diferenças que evidenciaram melhor desempenho dos animais alimentados com o feno tratado com amônia, cujos valores foram de 1,336 kg/dia e 7,78 kg de MS ingerida/kg de GMD, seguidos daqueles alimentados com o feno não-tratado e suplementado com farelo de algodão, de 1,161 kg/dia e 8,98 kg de MS ingerida/kg de GMD, respectivamente. Os consumos de nutrientes diferiram, resultando em maiores consumos de fibra em detergente neutro (FDN), fibra em detergente ácido (FDA) e celulose pelos animais alimentados com feno tratado com amônia. Os maiores valores de espessura de gordura subcutânea foram obtidos com a dieta com feno tratado com amônia (6,3 mm).
Introduction
Using crop residues in animal feed can be interesting when it results in low costs for the process, providing it maintains the animal production index and satisfactory animal performance.
According to Reis et al. (2002), the vegetative portion of the plant that remain from the harvest of seed forage grass by the sweeping method may be used as a forage source of low nutritive value. Chemical treatment on this forage may increase its utilization efficiency, because it equals its nutritive value to that of other preserved forages. Among the most used chemical products are urea and anhydrous ammonia. Urea is the cheapest and easiest to be applied, but Reis et al. (2001) and Fernandes et al. (2002) reported its lower efficiency in increasing the in vitro dry
matter disappearance values (DM). In a study conducted by Roth et al. (2005), doses of 2 and 3% ammonia applied on Brachiaria brizantha cv. Marandu seed post harvest
residue were efficient in improving this hay’s nutritive value. Another way of reducing feeding costs for finishing animals is the incorporation of urea in the diet as a source of ammonia for microbial protein synthesis. Furthermore, urea can act as a buffer, keeping the rumen pH more appropriate to cellulose digestion (Huber, 1994).
The objective of this study was to evaluate the effect of anhydrous ammonia or urea application and protein supplementation on the animal performance quantitative and qualitative carcass characteristics of beef cattle finished in feedlot, fed with Brachiaria brizantha cv. Marandu hay
from vegetative portion remain after seed harvest process.
Material and Methods
The experiment was carried out at the experimental feedlot of the Apta Regional – Alta Mogiana, unit of the Agência Paulista de Tecnologias dos Agronegócios (APTA), of the Secretaria da Agricultura de Abastecimento
do Estado de São Paulo. The Apta Regional – Alta Mogiana is located in Colina, São Paulo (20º 43' 05" S latitude; 48º 32' 38" W longitude), where the climate is the AW type (according to the Köppen classification), the rainfall in the driest months is less than 30mm, the average temperature in the warmest months is over 22°C and over 18°C in the coldest months. The monthly average rainfall registered in the research unit in recent years has shown that, from October to May, there are 1222mm, corresponding to 93.7% of the total annual rainfall, while from June to September there was 82 mm rain (6.3% of the total annual rainfall). The soil of the location is classified as dark red latosol, sandy phase, with an almost flat topography and good drainage. Twenty-four male beef cattle were used (12 F1 Nelore × black Aberdeen Angus and 12 F1 Nellore × red Aberdeen Angus) crossed Nellore × Aberdeen Angus, non castrated, initial age 24 months, initial mean weight 422.6 kg. The animals were distributed randomly in four treatments, each one with six replications and three animals from each crossbreed. Animal crossbreed type and initial body weight were considered as blocks.
The diets were based on hay harvested post flowering stage, simulating the Brachiaria brizantha cv. Marandu
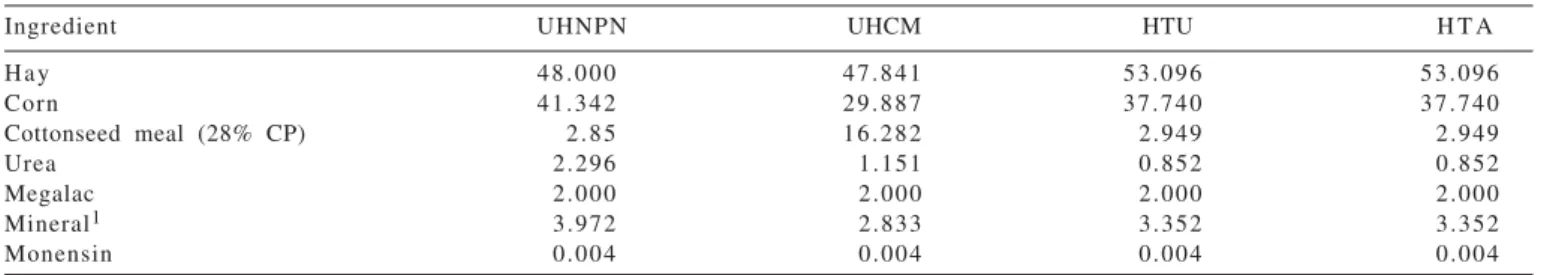
seed post harvest residue. The diets were: untreated hay supplemented with non-protein nitrogen (UHNPN); untreated hay supplemented with cottonseed meal (UHCM); hay treated with 5% urea (HTU) and hay treated with 3% anhydrous ammonia (% DM) (HTA). Experimental diets were isoprotein and isoenergetic (considering the total digestible nutrients TDN) of the hay as 50%), the probable increase in the fiber digestibility by the hydrolyses caused by the chemical treatments was not considered. Diet was formulated to attend requirement to daily weight gains of 1.1 kg/animal/day, as recommended by the NRC (1996). Diets (Table 1) were supplied in individual stalls in the morning, to allow 5% of ort for animal per day. The orts were weighed daily and sampled weekly to determine the daily individual dry matter intake (DMI).
Ingredient UHNPN UHCM HTU H T A
Hay 48.000 47.841 53.096 53.096
Corn 41.342 29.887 37.740 37.740
Cottonseed meal (28% CP) 2.85 16.282 2.949 2.949
Urea 2.296 1.151 0.852 0.852
Megalac 2.000 2.000 2.000 2.000
Mineral1 3.972 2.833 3.352 3.352
Monensin 0.004 0.004 0.004 0.004
UHNPN = untreated hay supplemented with non-protein nitrogen; UHCM = untreated hay supplemented with cotton meal; HTU = hay treated with 5% urea; HTA = hay treated with 3% anhydrous ammonia.
1 Sodium chloride, manganese and zinc oxides, sodium selenite, cobalt, copper and manganese sulfates, calcium iodate, calcite, livestock sulfur, vitamin A and monensin.
The forage were treated by baling 7 to 8 kg of hay, arranged in layers. Each hay stack consisted of six layers of bales, placed on plastic sheet, totaling 4000 kg DM. Another plastic sheet was used to cover the stacks, allowing storage in hermetically conditions for the treatment period of 150 days. Urea application was held by dilute it in enough water to adjust the moisture to 30% and applied to the piles of hay bales at the calculated dose of 5% of the hay DM. Later the stacks were covered with plastic and sealed for better action of the product. The amount of water was calculated by the total weight of the stack and the hay DM content. The weight of the stack was then divided by the desired DM content and multiplied by the original DM, to obtain the weight of the stack after the water addition.
Anhydrous ammonia application was performed in closed stacks connected to the container by rubber hoses. Ammonia containers were weighted to observe the difference in weight to calculate the dose applied of 3% hay DM. Before fed, the treated hays were aerated for three days and chopped in a hammer mill without a mesh to obtain particles of approximately 5 cm, for easier management and animal intake.
Feed samples and the animals’ individual orts were collected, stored and then taken to the Laboratório de
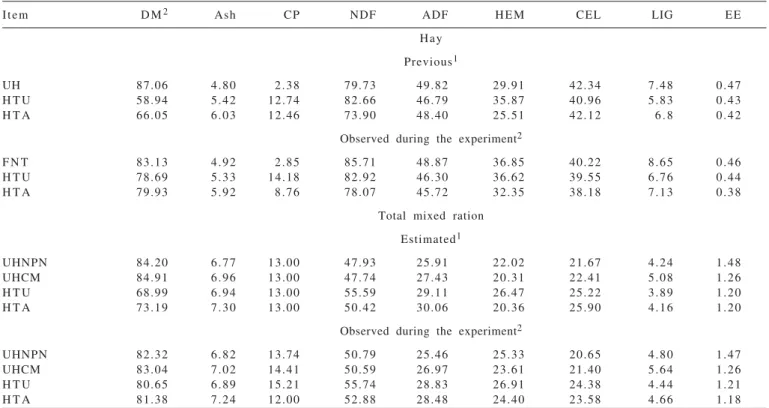
Nutrição Animal (LANA) at FCAV/Unesp, and analyzed following procedure described by Silva & Queiroz (2002). The following traits were determined: dry matter content (DM), ash, crude protein (CP), ether extract (EE), neutral detergent fiber (NDF), acid detergent fiber (ADF), lignin (LIG) and the hemicellulose (HEM) and cellulose (CEL) contents were calculated (Table 2).
The experiment lasted 98 days, and was splited into three 28-day periods plus the 14-day of adaptation period. Animals were weighed after adaptation period in order to obtain the initial body weight and submitted to the 16 hours fast at the end of each experimental period, to obtain the animal performance, body weight at slaughter and average daily gain.
Animals were slaughtered at the Minerva slaughterhouse in Barretos, São Paulo, following the standard procedure of the location. The liver and renal, pelvic and inguinal fats were collected and weighed. The carcass was splited in half and each half carcass was weighed individually, to obtain the hot carcass weight, and stored in a cold chamber at -3°C for 24 hours. Carcass pH and temperature were monitored during this period. After chilling, the cold half carcass was again weighed to determine the cold carcass yield and the chilling losses. In the right half carcass, the primary cuts
Item D M2 Ash CP NDF ADF H E M CEL LIG EE
Hay
Previous1
UH 87.06 4.80 2.38 79.73 49.82 29.91 42.34 7.48 0.47
H T U 58.94 5.42 12.74 82.66 46.79 35.87 40.96 5.83 0.43
H T A 66.05 6.03 12.46 73.90 48.40 25.51 42.12 6 . 8 0.42
Observed during the experiment2
F N T 83.13 4.92 2.85 85.71 48.87 36.85 40.22 8.65 0.46
H T U 78.69 5.33 14.18 82.92 46.30 36.62 39.55 6.76 0.44
H T A 79.93 5.92 8.76 78.07 45.72 32.35 38.18 7.13 0.38
Total mixed ration
Estimated1
UHNPN 84.20 6.77 13.00 47.93 25.91 22.02 21.67 4.24 1.48
UHCM 84.91 6.96 13.00 47.74 27.43 20.31 22.41 5.08 1.26
H T U 68.99 6.94 13.00 55.59 29.11 26.47 25.22 3.89 1.20
H T A 73.19 7.30 13.00 50.42 30.06 20.36 25.90 4.16 1.20
Observed during the experiment2
UHNPN 82.32 6.82 13.74 50.79 25.46 25.33 20.65 4.80 1.47
UHCM 83.04 7.02 14.41 50.59 26.97 23.61 21.40 5.64 1.26
H T U 80.65 6.89 15.21 55.74 28.83 26.91 24.38 4.44 1.21
H T A 81.38 7.24 12.00 52.88 28.48 24.40 23.58 4.66 1.18
UH = untreated hay; UHNPN = untreated hay supplemented with non-protein nitrogen; UHCM = untreated hay supplemented with cotton meal; HTU = hay treated with 5% urea; HTA = hay treated with 3% anhydrous ammonia.
1 Sampling of the hay realized 45 before experiment start and composition of concentrate according to Valadares Filho et al. (2006). 2 Sampling realized during the experiment period.
were separated in hindquarter, forequarter and spareribs to determine their respective yields. The loin eye area (cm2),
and the subcutaneous fat thickness (mm), were measured between the 12th and 13th rib sections, on the left half carcass. Measures of the carcass length (cm), depth (cm) were made and the compactness index was calculated by the length (cm) and the hot carcass weight (kg).
A sample was taken from the Longissimus dorsi
muscle at the 12th and 13th rib sections for the meat qualitative analysis. These samples were vacuum packed and frozen. Later these samples were transferred to a cold chamber, at approximately 2°C for 12 hours, until tenderness so the cooking loss analyses could be made. Water loss in cooking was determined by the weight of the section before and after cooking, expressed in percentage, according to the process reported in the Manual of Meat Cooking and Sensorial Assessment (Cross et al., 1978).
A 25 kg capacity Warner-Bratzler Shear appliance (G-R Electrical Manufacturing Company, Manhattan, USA) was used to determine the shearing force. Six 2.5 cm thick cylinders were removed from each steak using a manual piercer and average shear force (in kgf) was measured transversal to the meat fiber.
A randomized block design was used where the cross breed type and initial body weights were considered blocks, with four treatments and six replications, analyzed by the SAS program (1999) and the means were compared by the Tukey test (P<0,05).
Results and Discussion
There was no difference in the initial body weight (IBW) of the experimental animals (Table 3), and the average value was 422.6 kg.
Although the diets resulted in suitable animals weights for commercial slaughter, the final body weight (FBW) values were different (P<0.05). The smallest final body weight, 484.8 kg, was observed in animals fed with untreated hay supplemented with non-protein nitrogen (UHNPN); the
weights were intermediate in the animals fed with untreated hay supplemented with cottonseed meal (UHCM) and with hay treated with 5% DM urea (HTU), of 510.7 and 513.7 kg, respectively. Therefore, the animals fed using hay treated with ammonia (3% DM) presented greatest final body weight, of 539.2 kg.
Animals fed hay treated with ammonia presented the greatest daily weight gains (1.336 kg/day) compared to those fed hay treated with urea (1.014 kg/day) and with untreated hay supplemented with NNP (0.871 kg/day), but the animals fed UHCM (1.161 kg/day) was not different from the other treatments. These results indicated better use of the diet fed to the animals that consumed HTA compared to those that consumed HTU and UHNPN, probably because of the increase in the hay digestibility in this treatment. According to Reis et al. (2001), chemical treatment of low nutritive value forage increase the cell wall digestibility due to the expansion of the cellulose, because their hydrogen bonds are broken and fiber hydration increases, this process allows faster microorganism access to fiber. Evaluating the same type of hay, Roth et al. (2009) observed that in vitro
digestibility of ammonia-treated hay content 30% moisture increased by 20.7 percentage units compared to untreated hay (58% versus 37.3%, respectively). This difference was greater by 8.6 percentage units than that of hay treated with urea (49.4%). It was further pointed out in the literature that the increase in digestibility was consolidated when this chemical treatment was performed in low quality tropical grass (Fernandes et al., 2002).
Untreated hay supplemented with cottonseed meal supported the second largest average daily gain and did not differ from the other treatments, probably because it was a diet with greater true protein proportion, due to the cottonseed meal. According to Huber (1994) substituting plant protein by urea reduced the availability of essential factors, present in the vegetal protein source, to rumen microorganisms and consequently to the ruminants, including the need of carbon skeletons for maximum microbial protein synthesis. It should be further considered that high
Item UHNPN UHCM H T U H T A Means CV1 P>F
Initial body weight (kg) 414.3 416.7 431.0 428.5 422.6 6.22 0.62
Final body weight (kg) 484.8b 510.7ab 513.7ab 539.2a 512.0 5.33 * Average daily gain (kg/day) 0.871b 1.161ab 1.014b 1.336a 1.103 17.99 * * Feed conversion (kg of DM intake/kg de ADG) 10.91a 8.98 ab 9.83ab 7.78b 9.37 16.64 * *
UHNPN = untreated hay supplemented with non-protein nitrogen; UHCM = untreated hay supplemented with cotton meal; HTU = hay treated with 5% urea; HTA = hay treated with 3% anhydrous ammonia.
Means followed by the same small letter do not differ (P>0.05) by Tukey test. *P<0.05, **P<0.01.
1 CV = coefficient of variation (%).
forage availability, hay ad libitum in the trough, with high
fiber and low protein contents, when supplemented with protein resulted in a high response, but when supplemented with NNP presented low response (Siebert & Hunter, 1982). That justified the low average daily gain of the animals fed UHNPN diet. Even considering that fiber fermenting bacteria use ammonia as a single nitrogen source (Russel et al., 1992; Tedeschi et al., 2000), the diets UHNPN contained 43.2% corn and for the efficient degradation of this energy source, is necessary the presence of true protein.
Feed conversion (FC) was also different, with values inversely proportional to those of the average daily gain, because low feed conversion values indicated greater animal efficiency in response to the diet. These results may also be related to the probable increase in digestibility of ammonia-treated hay (Roth et al., 2009) and to the better response of the animal when it received supplementation with true protein. There was no difference (P>0.05) in the dry matter intake per animal per day (DMI) in percentage of body weight (%BW), and in percentage of metabolic weight (%BW0.75) whose average values where 9.8 kg of DM, 2.1%
BW and 97.44g/ BW0.75, respectively (Table 4).
Crude protein intake (CPI), in kg, in percentage of body weight (%BW) or in grams per unit of metabolic size (CPBW0.75)
did not differ and presented the same DM intake performance, with average values of 1.35 kg, 0.29% and 13.45 g/BW0.75,
respectively. Based on these values, it can be stated that the differences in the diets CP contents did not affect the CP intake. Neutral detergent fiber intake (NDFI) in kg (Table 4) differed among the diets, so that it was greater in the animals fed diet with HTA (5.55 kg) than that observed in the UHNPN diet (4.43 kg), but it did not differ among the animals fed HTU (5.30 kg) and UHCM (5.09 kg). The increase in NDFI in HTA, compared to UHNPN, may have been due to the greater digestibility of this fraction with the ammonia treatment, that is, the rupture of NDF by the ammonia that improved its use. This fact may have increased the passage rate of the forage through the digestive tract, resulting in a greater total diet intake. However, the intakes compared to body weight (NDFBW) of 1.09%, and for the metabolic weight (NDFBW0.75) of 50.57 g/BW0.75 did not differ and
the intake in kg/day was directly related to the animal weight that was greater in the animals fed HTA at the end of the experiment (Table 3).
Acid detergent fiber intake (ADFI) and cellulose intake (CELI) (kg/day) performed similarly, as did the intake of those fractions in percentage of body weight or metabolic weight. Thus, in percentage of body weight, ADF (ADFBW) and cellulose (CELBW) intakes were greater among the animals fed with HTA, 0.62% and 0.52%, compared to that of the animals that was fed UHNPN (0.49% and 0.40%, respectively).
Intake UHNPN UHCM H T U H T A Means CV1 P>F
Dry mater (kg/day) 9.02 10.14 9.47 10.57 9.80 12.44 0.16
Dry mater (% BW) 2.00 2.19 2.01 2.19 2.10 11.32 0.36
Dry mater (g/BW0,75) 92.10 101.38 93.78 102.49 97.44 11.37 0.29
Crude protein (kg/day) 1.26 1.45 1.44 1.26 1.35 12.81 0.13
Crude protein (% BW) 0.28 0.31 0.31 0.26 0.29 11.94 0.09
Crude protein (g/BW0,75) 12.91 14.44 14.22 12.22 13.45 12.01 0.09 Neutral detergent fiber (kg/day) 4.43b 5.09ab 5.30ab 5.55a 5.09 13.20 * Neutral detergent fiber (% BW) 0.98 1.10 1.13 1.15 1.09 12.37 0.18 Neutral detergent fiber (g/BW0,75) 45.21 50.78 52.50 53.80 50.57 12.34 0.13 Acid detergent fiber (kg/day) 2.21b 2.73ab 2.76ab 3.02a 2.68 13.42 * * Acid detergent fiber (% BW) 0.49b 0.59ab 0.59ab 0.62a 0.57 12.54 * Acid detergent fiber (g/BW0,75) 22.52b 27.29ab 27.33ab 29.25a 26.60 12.58 *
Hemicellulose (kg/day) 2.22 2.35 2.53 2.54 2.41 13.05 0.26
Hemicellulose (% BW) 0.49 0.51 0.53 0.54 0.52 11.89 0.57
Hemicellulose (g/BW0,75) 22.69 23.49 24.55 25.16 23.97 12.15 0.49
Cellulose (kg/day) 1.78b 2.15ab 2.33a 2.50a 2.19 13.65 * *
Cellulose (% BW) 0.40b 0.46ab 0.50ab 0.52a 0.47 13.08 *
Cellulose (g/BW0,75) 18.15b 21.47ab 23.11a 24.17a 21.72 12.90 * *
Lignin (kg/day) 0.43b 0.59a 0.43b 0.50ab 0.49 13.35 * *
Lignin (% BW) 0.10b 0.13a 0.09b 0.10b 0.10 11.66 * *
Lignin (g/BW0,75) 4.40b 5.89a 4.23b 4.81b 4.83 11.76 * *
UHNPN = untreated hay supplemented with non-protein nitrogen; UHCM = untreated hay supplemented with cotton meal; HTU = hay treated with 5% urea; HTA = hay treated with 3% anhydrous ammonia.
Means followed by the same small letter do not differ (P>0.05) by Tukey test. *P<0.05, **P<0.01.
1 CV = coefficient of variation (%).
Increase of the fibrous fractions (ADF and cellulose) intake was due to the greater availability of those fractions to the rumen microorganisms, and resulted in increased degradation and passage rates. ADF may have been more efficiently affected by the action of ammonia than by urea on the hay. Addition of true protein may have been more efficient in attending the rumen microorganisms requirement compared to the NPN supply.
The hemicellulose intake did not differ (P>0.05), regardless of how it was determined, kg (HEMI), body weight (BW) or metabolic weight (BW0.75), and presented
mean values of 2.41 kg, 0.52% and 23.93 g/ BW0.75,
respectively.
There was difference (P<0.05) in the lignin intake per animal per day (LIGI), in percentage body weight (LIGBW) and in percentage of metabolic weight (LIGBW0.75) and
these differences did not follow any of the parameters studied, thus highlighting the difficulties of measuring the effects of ammonia on this fraction (Table 4). Studies on the effects of ammonia on lignin contents are not consistent (Sundstol, 1984; Reis et al., 2001a). Another relevant fact was the greater lignin intake in kg (LIGI), in body weight percentage (LIGBW) and in relation to the metabolic weight (LIGBW0.75), that was 0.59 kg, 0.13% and 5.8 g/BW0.75,
respectively, in the UHCM diets, resulting from the lignin concentration in the cottonseed meal (Table 2), on average 5.54% of the DM (Valadares Filho et al., 2006).
It was observed that the hot carcass weight (HCW) of the animals fed with HTA (312.5 kg) was greater (Table 5). However, the animals that received the HTU and UHCM
diets did not differ (P>0.05) from the others, similar to the results observed for the final body weight (FLW) (Table 3). Cold carcass weights (CCW) followed the results of HCW and FLW and confirmed that HTA diet fiber was probably more digestible due to the chemical treatment with ammonia, which turned nutrients more available to the animals. These explanations were in line with those by Reis et al. (2001), who observed increase in vitro DM
digestibility in ammonia-treated Brachiaria brizantha
hay (20.4 percentage units) and in those treated with urea (14.6 percentage units). The authors attributed this variation in digestibility to decrease in the neutral detergent fiber and hemicellulose content, that is, to solubilization that resulted in an increase in the readily digestible carbohydrates and available nitrogen for the rumen microorganisms.
Carcass dressing (Table 5) did not differ (P>0.05) among the diets and its average value was 57.7%, that was good considering the breeds studied, the diets and the feedlot time. The chilling losses values (Table 5) were different (P<0.05); the highest value was 2.10% in the animals fed with UHCM and the lowest, 1.47%, in the animals fed with HTA.
The fat thickness values differed (P<0.05) among the diets; the highest value was 6.3 mm in the animals that received the diets with HTA and probably, because of this the chilling losses were smaller in those animals. The fat thickness offered greater protection to the carcass from the effects of chilling. These results were in line with the performance values, with greater FLW, greater ADG and
UHNPN = untreated hay supplemented with non-protein nitrogen; UHCM = untreated hay supplemented with cotton meal; HTU = hay treated with 5% urea; HTA = hay treated with 3% anhydrous ammonia.
Means followed by the same small letter do not differ (P>0.05) by Tukey test. *P<0.05, **P<0.01.
1 in percentage of body weight; 2 in percentage of the hot carcass weight; 3 in percentage of cold carcass weight. 4 CV = coefficient of variation (%).
Item UHNPN UHCM H T U H T A Means CV4 P>F
Hot carcass weight (kg) 270.8b 289.83ab 296.33ab 312.50a 292.37 6.49 *
Carcass dressing (%)1 55.85 56.68 57.77 58.00 57.07 2 . 8 0.11
Cold carcass weight (kg) 265.68b 283.72ab 291.35ab 307.91a 287.16 6.54 * *
Chilling loss (%)2 1.90ab 2.10a 1.69ab 1.47b 1.79 17.56 *
Forequarter (%)3 41.78 42.02 43.20 41.57 42.14 2.66 0.09
Hindquarter (%)3 45.41 46.18 45.38 45.92 45.73 2.30 0.50
Spareribs (%)3 12.77 11.80 11.43 12.52 12.13 11.48 0.34
Fat thickness (mm) 3.33b 3.80b 4.70b 6.30a 4.54 20.12 * *
Loin eye area (cm2) 90.33 85.17 93.33 95.00 90.96 11.47 0.40
Loin eye area/100 kg hot carcass (cm2) 33.63 29.28 31.57 30.53 31.25 9.91 0.14 Relative weight of liver (%)3 1.98 2.04 2.14 2.20 2.09 7.43 0.10 Renal, pelvic and inguinal fats (kg) 3.86 4.99 4.77 5.38 4.75 24.37 0.18 Renal, pelvic and inguinal fats (%)3 1.45 1.75 1.64 1.73 1.64 20.92 0.40
Length carcass (cm) 132.10 133.25 132.08 132.92 132.59 1.98 0.82
Depth carcass (cm) 38.70 38.17 39.50 39.00 38.84 3.54 0.42
Compactness index (cm2/kg) 0.273a 0.263ab 0.259ab 0.248b 0.261 4.26 * *
lower feed efficiency of the animals fed with HTA, in which greater fat thickness and smaller chilling losses were detected, that may reflect in greater benefits to the carcass of these animals compared to the other experimental diets. Performance was intermediate in all of these traits of the animals that received diet containing HTU and UHCM.
The forequarter, hindquarter and spareribs did not differ and their means were 42.14, 45.73 and 12.13%, respectively. According to Luchiari Filho (2000), the ideal proportion between the carcass quarters would be a forequarter of up to 39%, hindquarter greater than 48% and spareribs up to 13%. Therefore, this smaller hindquarter was compensated by a greater forequarter. This was probably due to the fact that the animals were not castrated. The development of the forequarter continues on the non castrated animals, unlike the castrated animals whose front growth decreases, favoring proportionally the hindquarter, this gives cuts with greater commercial value.
Parameters such as loin eye area, in cm2, compared to
100 kg hot carcass weight and liver compared to percentage of cold carcass weight did not differ and the average values were 31.25 cm2 and 2.09%, respectively, (Table 5). Mean loin eye area values detected in the present study were above the minimum recommended by Luchiari Filho (2000), of 29 cm2/100kg carcass weight, showing that all
the carcasses would probably have a high edible portion. There was no difference (P>0.05) in the renal, pelvic and inguinal fats (RPIF) measurements in kg, and of RPIF compared to cold carcass weight and the average values were 4.75 kg and 1.64%, respectively (Table 5). The mean values obtained for the carcass length and carcass depth measurements of the animals did not differ (132.59 cm and 38.84 cm, respectively).
The lowest compactness index value observed was 0.248 cm2 kg in the animals fed with UHNPN. These results
may be related to the FLW, HCW and CCW, as a result of greater animal weight gain that were fed with HTA, probably because of the greater digestibility of the fiber resulting from the action of ammonia on the hay, data confirmed by Reis et al. (2001).
No difference was observed (P>0.05) in the initial and final pH values, initial and final temperature in the topside, whose means were 6.32; 5.89; 39.69ºC and 12.13ºC, respectively (Table 6). The initial and final pH values did not differ in the striploin measurements, with means of 6.28 and 5.86, respectively.
Temperature values of the striploin differed and were greater in the carcasses of the animals fed with HTA (38.17°C initial and 5.60°C final, P>0.05). The highest final temperature values in the striploin can be explained in part by the greater weight of the chilled carcass that could give rise to a larger striploin. This difference was not ascertained for the topside probably because the location of this muscle is more internal compared to the special hindquarter cut, less subject to temperature oscillations and there is also a smaller distribution of cover fat at this specific point of the carcass. Furthermore, the smaller losses from chilling in the animals that were fed with HTA diets were influenced by higher fat thickness (P<0.05), that confer greater protection to the carcass.
According to Alves et al. (2005), the final carcass temperature should be lower than 10ºC it was not the case in the measurements of the Semimembranosus muscle
(topside) that was 12.13°C.
The temperature of the cold chamber in which the carcasses was stored was measured along with the carcass temperature, to detect possible variations related to carcass entrance at different times that might influence the results of this study. The cold chamber should range from zero to 3°C, but in the period when the experimental carcasses were stored the temperature reached 5°C when the animals
Item1 UHNPN UHCM H T U H T A Means CV2 P>F
Topside initial pH 6.25 6.42 6.32 6.28 6.32 2.22 0.20
Topside final pH 5.88 5.91 5.89 5.89 5.89 0.38 0.23
Topside initial temperature 39.82 39.18 39.88 39.88 39.69 1.80 0.28 Topside final temperature 11.66 12.05 12.05 12.75 12.13 9.92 0.49
Striploin initial pH 6.26 6.33 6.26 6.26 6.28 1.85 0.63
Striploin final pH 5.85 5.87 5.85 5.86 5.86 0.22 0.08
Striploin initial temperature 37.08ab 35.93b 37.82a 38.17a 37.25 2.62 * * Striploin final temperature 4.83b 4.92b 4.90b 5.60a 5.06 7.56 * *
UHNPN = untreated hay supplemented with non-protein nitrogen; UHCM = untreated hay supplemented with cotton meal; HTU = hay treated with 5% urea; HTA = hay treated with 3% anhydrous ammonia.
Means followed by the same small letter do not differ (P>0.05) by Tukey test. * P<0.05, **P<0.01.
1 I = initial values, immediately after slaughter; F = final values (22 hours after slaughter). 2 CV = coefficient of variation (%).
were placed and increased to 4°C 16 hours after slaughter and may have interfered negatively on the carcass temperatures.
Final pH values were generally higher than those recommended by Luchiari Filho (2000) as suitable for carcass processing. This result was explained by the fact that the animals underwent a stress situation before slaughter, this would lead to exhaustion of the muscle glycogen reserves and prevent a fall in pH. The final temperature, in all the treatments, was below 7°C, considered suitable by Faria et al. (2004). The difference should also be considered among the forms and constitutions of the muscles that influenced temperature fall that is greater in the sirloin than in the
topside because of the smaller specific weight of the piece and the muscle location.
There was no difference (P<0.05) in the loss from evaporation (LE), loss from dripping (LD), total loss (TL) and shearing force, whose means were 11.13%, 11.55%, 22.67% and 4.14 kgf, respectively (Table 7).
Meat with acceptable tenderness has a shearing force of less than 4.5 kgf (Alves et al., 2005). Therefore, the meat obtained in this study was defined as tender. According to the same authors, tenderness was outstanding among the quality characteristics of beef meat and can be considered the organoleptic characteristic that most influences consumer acceptance of the meat.
Item UHNPN UHCM H T U H T A Means CV1 P>F
Loss from evaporation 11.22 10.95 12.98 9.35 11.13 38.14 0.54
Loss from dripping 10.99 11.89 11.39 11.92 11.55 26.00 0.94
Total loss 22.22 22.83 24.37 21.27 22.67 16.46 0.55
Shear force (kgf) 3.53 4.53 4.31 4.21 4.14 28.14 0.50
UHNPN = untreated hay supplemented with non-protein nitrogen; UHCM = untreated hay supplemented with cotton meal; HTU = hay treated with 5% urea; HTA = hay treated with 3% anhydrous ammonia.
Means followed by the same small letter do not differ (P>0.05) by Tukey test. * P<0.05, **P<0.01.
1 CV = coefficient of variation (%).
Table 7 - Carcass quality of beef cattle fed with Brachiaria brizantha cv. Marandu seed post harvest residue hay treated
Conclusions
Ammoniation of Brachiaria brizantha cv. Marandu seed post harvest residue is an efficient alternative in beef cattle feedlot system and results in carcass production with desirable characteristics for the meat production process. Supplementation with cotton seed meal was a better alternative compared to urea, on the low nutritive value hay without any chemical treatment diets.
Acknowledgments
The authors thank the company, Nutroeste Nutrição Animal Ltda., for supplying the concentrates used.
Literature Cited
ALVES, D.D.; GOES, R.H.T.B.; MANCIO, A.B. Maciez da carne bovina. Ciência Animal Brasileira, v.6, n.3, p.135-149, 2005. CROSS, H.R.; BERNHOLDT, H.F.; DIKEMAN, N.E. Guidelines for cookery and sensory evaluation of meat. Chicago: American Meat Science Association/National Live Stock & Meat Board, 1978. 24p.
FARIA, M.H.; RESENDE, F.D.; ARRIGONI, M.B. et al. Estudo da variação do pH e temperatura durante o processo de resfriamento da carcaça de animais de diferentes grupos genéticos abatidos em
três pontos de acabamento. In: REUNIÃO ANUAL DA SOCIEDADE BRASILEIRA DE ZOOTECNIA, 41., 2004, Campo Grande. Anais... Campo Grande: Sociedade Brasileira de Zootecnia, 2004. (CD-ROM).
FERNANDES, L.O.; REIS, R.A.; RODRIGUES, L.R.A. et al. Qualidade de feno de Brachiaria decumbens Stapf. submetido ao tratamento com amônia anidra ou uréia. Revista Brasileira de Zootecnia, v.31, n.3, p.1325-1332, 2002 (supl.). HUBER, J.T. Uréia ao nível do rúmen. In: PEIXOTO, A.M.; MOURA,
J.C.; FARIA, V.P. (Eds.) Simpósio sobre nutrição de bovinos: uréia para ruminantes. Piracicaba: FEALQ, 1994. p.1-17. LUCHIARI FILHO, A. Pecuária da carne bovina. 1.ed. São Paulo,
2000. 134p.
NATIONAL RESEARCH COUNCIL - NRC. Nutrient requirements of beef cattle. 7.ed. Washington, DC: National Academy Press, 1996. 242p.
REIS, R.A.; RODRIGUES, L.R.A.; PEREIRA, J.R.A. et al. Composição química e digestibilidade de fenos tratados com amônia anidra ou uréia Revista Brasileira de Zootecnia, v.30, n.3, p.666-673, 2001.
REIS, R.A.; ROSA, B.; MOREIRA, A.L. Tratamento químico de volumosos: amonização. In: OBEID, J.A.; PEREIRA, O.G.; FONSECA, D.M.; NASCIMENTO JR., D. (Eds.) Simpósio s o b re m a n e j o e s t r a t é g i c o d a p a s t a g e m. Viçosa, MG: Universidade Federal de Viçosa, 2002. p.407-436.
ROTH, M.T.P.; REIS, R.A.; RESENDE, F.D. et al. Tratamento químico do resíduo de pós-colheita de sementes da Brachiaria brizantha cv. Marandu com diferentes teores de umidades. Revista Brasileira de Zootecnia, 2009 (no prelo). ROTH, M.T.P.; REIS, R.A.; SIQUEIRA, G.R. et al. Valor nutritivo de
fenos de resíduo de colheita de sementes de Brachiaria brizantha
2005, Lavras. Anais... Lavras: Universidade Federal de Lavras, 2005. (CD-ROM).
RUSSELL, J.B.; O’CONNOR, J.D; FOX, D.G et al. A net carbohydrate and protein system for evaluating cattle diets – I Ruminal fermentation. Journal Animal Science, v.70, n.11, p.3551-3561, 1992.
SIEBERT, B.D.; HUNTER, R.A. Supplementary feeding of grazing animals. In: HACKER, J.B. (Ed.) Nutritional limits to animal production from pasture. Farnham Royal: Commonwealth Agricultural Bureau, 1982. p.409-425.
SILVA, D.J.; QUEIROZ, A.C. Análise de alimentos: métodos químicos e biológicos. 3.ed. Viçosa, MG: Editora UFV, 2002. 235p.
STATISTICAL ANALYSIS SYSTEM - SAS. The SAS system for Windows: version: 8.2. Cary: SAS Institute, 1999. (CD-ROM). SUNDSTOL, F.; COXWORTH, E.M. Ammonia treatment. In: SUNDSTOL, F.; OWEN, E. (Eds.). Straw and others fibrous by-products as feed. Amsterdam: Elsevier Press, 1984. p.196-247. TEDESCHI, L.O; FOX, D.G.; RUSSELL, J.B. Accounting for the effects of a ruminal nitrogen deficiency within the structure of the Cornell net carbohydrate and protein system. Journal Animal Science, v.78, n.6, p.1648-1658, 2000.