www.ccarevista.ufc.br ISSN 1806-6690
Estimation of leaf area index in the sunflower as a function of thermal
time
1Estimativa do índice de área foliar do girassol em função da soma térmica
Dioneia Daiane Pitol Lucas2*, Arno Bernardo Heldwein3, Fernando Dill Hinnah4, Ivan Carlos Maldaner5 e Luis Henrique Loose3
ABSTRACT - The aim of this study was to obtain a mathematical model for estimating the leaf area index (LAI) of a sunflower crop as a function of accumulated thermal time. Generating the models and testing their coefficients was carried out using data obtained from experiments carried out for different sowing dates in the crop years of 2007/08, 2008/09, 2009/10 and 2010/11 with two sunflower hybrids, Aguará 03 and Hélio 358. Linear leaf dimensions were used for the non-destructive measurement of the leaf area, and thermal time was used to quantify the biological time. With the data for accumulated thermal time (TTa) and LAI known for any one day after emergence, mathematical models were generated for estimating the LAI. The following models were obtained, as they presented the best fit (lowest root-mean-square error, RMSE): gaussian peak, cubic polynomial, sigmoidal and an adjusted compound model, the modified sigmoidal. The modified sigmoidal model had the best fit to the generation data and the highest value for the coefficient of determination (R2). In testing the models, the lowest values for root-mean-square error, and the highest R2 between
the observed and estimated values were obtained with the modified sigmoidal model.
Key words:Helianthus annuus. Leaf analysis. Modelling.
RESUMO - O objetivo deste trabalho foi obter um modelo matemático que estime o índice de área foliar (IAF) para a cultura do girassol em função da soma térmica acumulada. A geração dos modelos e o teste de seus coeficientes foram realizadas com dados obtidos de experimentos conduzidos em diferentes datas de semeadura nos anos agrícolas de 2007/08, 2008/09, 2009/10 e 2010/11, com os híbridos de girassol Aguará 03 e Hélio 358. Utilizou-se as dimensões lineares das folhas para determinação não destrutiva da área foliar e a soma térmica para quantificar o tempo biológico. Conhecidos os dados de soma térmica acumulada (STa) e IAF para um mesmo dia após a emergência, gerou-se modelos matemáticos que estimam o IAF. Foram obtidos, por apresentarem os melhores ajustes (menor raiz quadrada do quadrado médio do erro, RQME), os modelos de pico gaussiano, polinomial cúbico, sigmoidal e um modelo ajustado composto, denominado sigmoidal modificado. O modelo sigmoidal modificado obteve melhor ajuste aos dados de geração e o maior valor do coeficiente de determinação (R2). No teste dos modelos obteve-se os menores valores da raiz do quadrado médio do erro e
maior R2 entre valores observados e estimados para o modelo sigmoidal modificado.
Palavras-chave:Helianthus annuus. Análise foliar. Modelagem.
DOI: 10.5935/1806-6690.20150020 *Autor para correspondência
1Recebido para publicação em 14/12/2012; aprovado em 08/01/2015
Parte de um Projeto de Pesquisa que contou com apoio financeiro do CNPq, da CAPES e apoio logístico do Departamento de Fitotecnia da Universidade Federal de Santa Maria, Santa Maria-RS
2Departamento de Defesa Agropecuária, Secretaria da Agricultura, Pecuária e Agronegócio, R. Benjamim Constant, 476, Palmeiras das Missões-RS,
Brasil, [email protected]
3Programa de Pós-Graduação em Agronomia, Departamento de Fitotecnia, Universidade Federal de Santa Maria, Av. Roraima, 1000, Camobi, Santa
Maria-RS, Brasil,[email protected], [email protected]
4Programa de Pós-Graduação em Engenharia de Sistemas Agrícolas, Departamento Engenharia de Biossistemas, Escola Superior de Agronomia “Luiz
de Queiroz”, Av. Pádua Dias, 11, Piracicaba- SP. [email protected]
INTRODUCTION
In Brazil, cultivation of the sunflower shows great potential for expansion, and along with the soybean, canola and castor bean, it is one of the four oilseeds suitable for cultivation in the state of Rio Grande do Sul (SILVA; FREITAS, 2008) with a potential for the production of biofuel. The sunflower stands out for its high level of oil
production, about 40% (THOMAZet al., 2012), which is
considered to be of high quality (IZQUIERDOet al., 2002),
as well as presenting interesting agronomic characteristics and being easy to adapt to systems used with other annual crops (SILVA; FREITAS, 2008).
Of the environmental variables, the main factor that affects growth and development is air temperature (AIKEN, 2005), with the concept of thermal time being used to express the required amount of energy (ARNOLD, 1960; GRAMIG; STOLTENBERG, 2007). The energy used in the accumulated growth and development of the plant during any one day is calculated using daily thermal time (TTd), and by summing that for any given period, the accumulated thermal time (TTa) in ºC day can be obtained (PEREIRA; ANGELOCCI; SENTELHAS, 2002).
The leaf area index (LAI), defined as the ratio of the leaf area of a plant population to the ground area it occupies, is an important variable of the canopy, which determines plant growth and development. It expresses the effect of the emergence and expansion of leaves,
interaction with the input of CO2 and energy flow,
and directly affects the interception of solar radiation, photosynthesis, accumulation of biomass, transpiration and gas exchange in the crop canopies (JONCKHEERE
et al., 2004; KANDIANNANet al., 2009).
The LAI is considered to be important as input data in models which predict growth and production (LIZASO; BATCHELOR; WESTGATE, 2003), to quantify competition between weeds and cultivated
crops (JONCKHEEREet al., 2004), and to model
plant-soil-atmosphere relationships considering mainly crop
evapotranspiration (ZAHOORet al., 2010). Furthermore,
it acts as an indicative parameter of crop productivity, since photosynthesis is dependent on luminous interception by the leaf cover and its conversion into
chemical energy (FAVARINet al., 2002).
The leaf area (LA) of a crop can be obtained using
direct or indirect methods (MALDANER et al., 2009).
While direct methods are generally more accurate, the determination of leaf area by highly-reliable, indirect methods has the advantage of not being destructive and not requiring the removal of leaves (JONCKHEEREet al.,
2004), besides reducing experimental variability (SERDAR; DEMIRSOY, 2006) and allowing the use of a larger number of replications.
Estimating leaf area through modelling using environmental variables allows information on the LAI, and consequently on ground cover, to be obtained without any measurement of the plant canopy being necessary (CHEN; PAN, 2002). This methodology is considered advantageous in various situations, especially where continuously necessary to know its value, such as in operating systems or the numeric analysis of historical data. Biometric indices can therefore be obtained using the air temperature, which is the main weather variable affecting the sunflower (GOYNE; HAMMER, 1982). The aim of this study was to obtain a mathematical model that would estimate leaf area index (LAI) in a sunflower crop as a function of accumulated thermal time.
MATERIAL AND METHODS
The data required to develop the models, as well as for testing the coefficients, were obtained in experiments carried out for different sowing dates in the crop years of 2007/08, 2008/09, 2009/10 and 2010/11. The experiments were carried out in a randomised block design, using the sunflower hybrids Aguará 03 and Hélio 358, at the experimental area of the Department of Plant Science of the Federal University of Santa Maria (29o43’23” S, 53o43’15” W, at an altitude of 95 m).
According to the Köppen classification, the climate is type Cfa, humid subtropical with hot summers. The soil is classified as a sandy, Ultisol, for which crop fertilization was based on the results of chemical analysis, with 3 Kg B ha-1, 18 kg N ha-1, 44 kg
P2O5 ha-1 and 41 kg K
2O ha-1 being used when sowing. A
further 42 kg nitrogen ha-1 was applied in the form of urea 30
days after emergence (DAE) of the plants.
To obtain the desired population (44,444 plants ha-1),
the plants were seeded at high density in rows spaced 0.90 m apart, and thinned when they showed two leaves, so as to obtain a spacing of 0.25 m between the plants in a row. Seeding was carried out on seven different dates to cover the period suggested by agricultural zoning (BRASIL, 2010) and the following period, always at the beginning of each month, starting in August and ending in February. For the sowing carried out in December of the 2008/09 crop year and in August, September and February of 2009/10, a sufficient stand of plants was not achieved, due to problems of water deficit and water surplus respectively at the time of seedling emergence, with only six and four sunflower crops therefore being grown in the respective years.
of eight lots for each sowing date, with four replications for each hybrid. Each lot consisted of five plant rows of 5.0 m in length with a border of 1.0 m at each end, giving a total area of 22.5 m2 and a central working area of 8.1 m2.
In each of these working areas, four plants were marked at random, and measurements taken weekly of the maximum width (W, in cm) of all the leaves of the 32 plants from each period, for later calculation of the leaf area (LA, in cm2),
using the method proposed by Maldaneret al. (2009):
AF = 1,7582L1,7067 (1)
From this data, the total leaf area and leaf area index (LAI) were obtained for each replication, and later the LAI for each hybrid for the different sowing dates.
Daily thermal time (TTd, °C day) was calculated with the method proposed by Arnold (1960):
TTd = (Tave - Tb).1day, when Tb < Tave Topt and (2) , when Topt < Tave Tmax (3)
where: Tb is the base air temperature for the sunflower (ºC), Tave is the average daily air temperature (ºC), Tmax is the maxima ar temperature for the crop (ºC) and Topt is the optimal air temperature for the crop (ºC).
The values used for the lower base temperature were 3.9 and 5.8 °C for the Aguará 03 and Hélio 358
genotypes respectively (MALDANERet al., 2011). The
optimal temperature was taken to be 27 °C with a limit of 34 °C being the maximum, as per Weiss (1983).
The average daily temperature was calculated as the arithmetic mean of the maximum and minimum daily temperature. The data was obtained from the Automatic Weather Station of the National Institute of Meteorology, about 50 m away from the experimental area. Data on rainfall and incident solar radiation were also obtained from the same station.
Accumulated thermal time (TTa, °C day) after plant emergence, was calculated by.
TTa = 1nTTd (4)
Once the data for TT and LAI were known for any one day after emergence (DAE), it was possible to generate mathematical models that would estimate the LAI, using leaf-area data from the years 2007/08 and 2008/09. The following models were obtained, as they presented the best fit: gaussian peak (A), cubic polynomial (B), sigmoidal (C) and an adjusted compound model, the modified sigmoidal (D). To test these mathematical models, values for LAI were used which were obtained from experiments in the 2009/10 crop year, a typical El Niño year with rainfall well above the historical average, and 2010/11, a La Niña year, but with recorded rainfall within the historical norm. This experimental data was derived from crops which had
been sown on similar dates and under the same soil and handling conditions as in the experiments during the crop years of 2007/08 and 2008/09, when data for the models was generated. Choice of the best generated models was made by means of the coefficient of determination (R2),
selecting those having a value greater than 0.70 and significant coefficients by the F-test (p<0.05).
The root mean square error (RMSE) and the mean absolute error (MAE) were used to evaluate the performance of the models in the test:
(5)
(6)
where: S is the estimated value, O is the observed value and N is the number of observations.
The final model was selected based on a combination of the greatest R2 in generating the model and the lowest
values for RMSE and MAE, these being related to both the coefficients of the generated models, and the coefficients of the test equations for the models. After obtaining and testing the models, adjustment for correction of the LAI was also done, this being estimated as a function of agrometeorological variables, with a view to adjusting the LAI for crops under extreme conditions, such as the number of days with solar radiation (SR) less than 8.5 MJ m-2 day-1,
the accumulated solar radiation, the number of days with water surplus and the accumulated soil water deficit.
RESULTS AND DISCUSSION
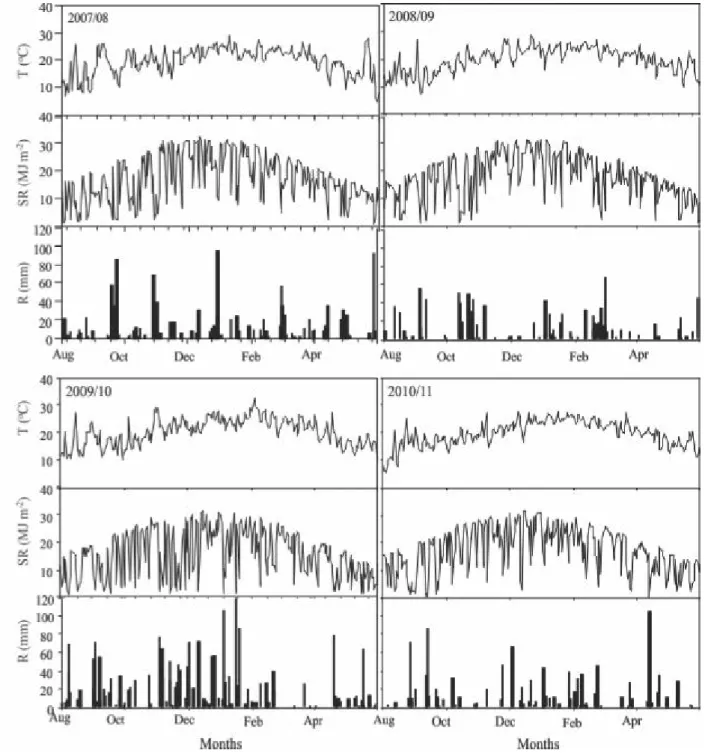
The different sowing dates in the two years of the experiments used to generate the models, made it possible to evaluate the responses of the sunflower plants to different environmental conditions, especially the amount of rainfall
(SILVAet al., 2007), the air temperature (CARGNELUTTI
FILHOet al., 2006) and the solar radiation (LOHMANN
et al., 2006), reproducing much of what happens with
commercial crops in different years (Figure 1). A range of experimental values was thereby obtained, generating coefficients which were more representative of weather conditions in the crop years of subtropical regions.
Five different models with a coefficient of
determination (R2) greater than 0.70 were obtained to
Figure 1 - Air temperature (T), solar radiation (SR) and rainfall (R) in the four years of sunflower experiments
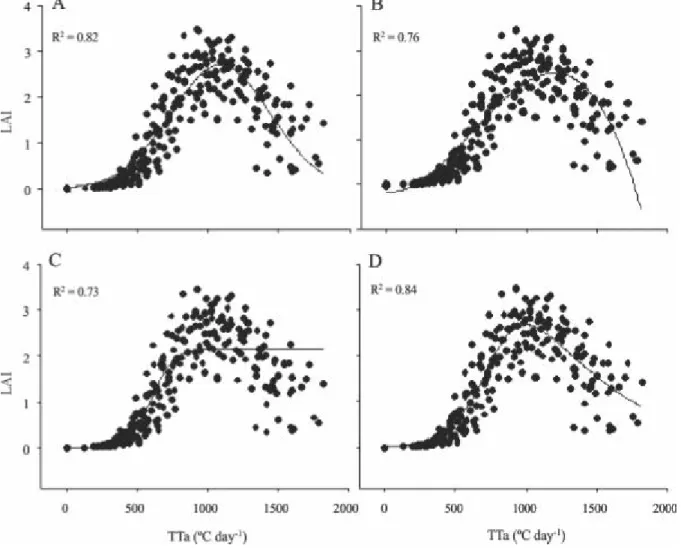
Despite these models presenting an R2 greater than
0.70, in at least one part of the cycle adjustment to the data was unsatisfactory (Figures 2A, 2B and 2C). Because of this, the elaboration and adoption of a compound model resulted in a better fit to the LAI data throughout the sunflower cycle (Figure 2D). The
modified sigmoidal model also gave the highest R2,
being significant by F-test (Table 1).
When testing the models using independent data from the crop years of 2009/10 and 2010/11, the lowest values were also found for root mean square
error and MAE, and the largest for R2, when comparing
Figure 2 - Models for the estimation of leaf area index (LAI) throughout the development cycle of the sunflower as a function of accumulated thermal time (TTa, °C day). A: Gaussian peak; B: cubic polynomial; C: sigmoidal; D: modified sigmoidal
Table 1 - Models for the estimation of leaf area index (LAI) as a function of accumulated thermal time during the crop cycle (TTa)
for the crop years of 2007/08 and 2008/09, and the respective statistics of the tests using values for LAI obtained in the crop years of 2009/10 and 2010/11, for the sunflower hybrids, Aguará 03 and Hélio 358
(1)A: Gaussian peak; C: sigmoidal; D: modified sigmoidal;(2) a(TTa), b and R2: angular coefficient, linear coefficient and coefficient of determination respectively,
of the linear equation in the test between the observed and estimated LAI; RMSE: root mean square error between observed and estimated values; MAE: mean absolute error of estimated to observed values; P-value: value for the probability of error in testing the model. *Significant model (p<0.05)
Model generated with data from 2007/08 and 2008/09(1) Test coefficients
(2)
P-value
a(TTa) B R2 RMSE MAE
Crop year 2009/10
A *LAI= 2.7015exp(-0.5((TTa-1088.2568)/352.3510)2) 0.7779 0.006 0.63 0.64 -0.309 0.0001
C * LAI= 2.1692/(1+exp(-(TTa-604.5043)/76.9723)) 0.6888 0.105 0.48 0.76 -0.352 0.0001
D *LAI= 8.0819/(1+exp(-(TTa -778.4303)/128.6142))*1/(1+exp(-(TTa -778.4303)/-500.7034)) 0.7646 0.008 0.63 0.65 -0.331 0.0001
Crop year 2010/11
A *LAI= 2.7015exp(-0.5((TTa-1088.2568)/352.3510)2) 1.0041 0.354 0.70 0.71 -0.350 0.0001
C *LAI= 2.1692/(1+exp(-(TTa-604.5043)/76.9723)) 1.0698 0.024 0.71 0.62 -0.130 0.0001
carried out by the plants, in such a way that initially they are considered as being the most influential factors, those which promete known interactions with the phenomenon to be modelled, with later improvement of the model being carried out if necessary. Thus, it was assumed that the rate of emergence and the final size of the leaves are essentially a function of temperature (GRAMIG; STOLTENBERG, 2007), due to its influence on cell division and extension, rather than the supply of assimilates (HORIEet al., 1979). To this effect,
incident global solar radiation and rainfall were tested but not included as independent variables in the models because of their low correlation with LAI in this study.
With the cubic polynomial model, consistent estimated values for the LAI were not obtained using the variable thermal time, even with a negative LAI in the initial period of crop development and a tendency in the curve towards overestimation of the LAI measured from 250 to 500 °C day. Moreover, when testing the model, the
R2 was always less than 0.2 and the RMSE of more than
three times the measured LAI were obtained. The model was therefore discarded. The sigmoidal model showed satisfactory results up to values of 750 °C day, but underestimated the maximum LAI, and from that point was not suitable for estimating LAI in the final stage of development, due to not describing, through a lack of any decrease in the characteristic curve, the decrease in LAI which results from gradual senescence.
Adjustment of the peak gaussian model (Figure 2A) resulted in values for R2 close to those obtained with
the modified sigmoidal model, but with a lower RMSE, even when estimating the decrease in LAI in accordance with normal sunflower development after the peak in leaf area which occurs in the sub-period of anthesis. The problem here is that the angle of the curve for the increase and decrease in leaf area is the same, which cannot be considered as true, since the estimated fall in LAI is slower than its formation in the canopy, but mainly because the LAI is overestimated up to 600 °C day.
The modified sigmoidal model was the most suited to the proposed objective, as it displays the best fit, both to the growth curve of the LAI from the early stages to its maximum values, and to its decrease due to senescence. In years which are considered normal, such as 2010/11, the model proved to be suitable according to the statistics being evaluated (Table 1) and observation of the plotting of the data observed and estimated (Figure 2B).
Modification made to the model made it possible to obtain a better estimate of the decrease in leaf area due to leaf senescence (Figure 2D), an estimate which is generally difficult to obtain (CHEN; PAN, 2002; YOSHIDA, 2003), demonstrating the potential of this model for use in other studies with a similar objective. Also, this process had already been simulated independently in a model developed
to estimate the LAI in maize (LIZASO; BATCHELOR;
WESTGATE, 2003). However, Izquierdo et al. (2002)
consider that in the sunflower, biomass partitioning into different organs is not a function of temperature. Still, the model was able to describe leaf dynamics during the crop cycle, characterised by emission and expansion in the early stages, followed by a period in which expansion and leaf senescence occur simultaneously, and ending with a period where leaf senescence predominates; as modelled for rice crops by Yoshida (2003). Description of these dynamics allows verification of the conditions of the interaction between a vegetated surface and the atmosphere, which change the albedo and roughness of the surface and the flow of mass and energy (MOLOD; SALMUN; WAUGH, 2003).
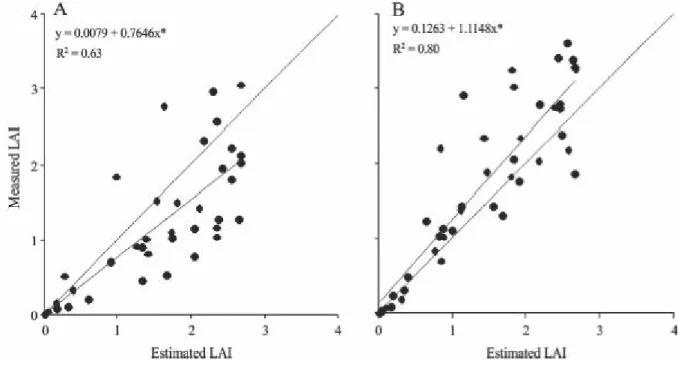
The proposed model is seen as a useful tool, allowing a quick, easy, accurate and successive estimate of the LAI, which is of significant importance to agronomists, producers and physiologists (TSIALTAS; MASLARIS, 2008), with such modelling for the sunflower, better sowing dates can be determined for the crop, affecting the management of pest populations, the need for irrigation, and harvest forecasting (AIKEN, 2005). Values for the coefficient of determination in the test carried out during the rainy crop year of 2009/2010 (El Niño) were lower than 0.5, with values for RMSE greater than 0.8 and MAE greater than -0.3 (Table 1), and the LAI being underestimated in relation to the observed data for that crop year (Figure 3A). Low values for MAE are desirable, although it should be noted that overestimation of one element of individual data will cancel such underestimation for
any one single observation. Association of R2 to the
other test statistics is therefore important in choosing the model with the best performance, as was done when choosing the models to estimate the LAI from the linear
dimensions of the leaves (KANDIANNANet al., 2009).
A comparison of the data measured during the different years showed that in the crop year of 2009/2010 the LAI was lower (Figure 3), probably due to the adverse effect of the water surplus (GRASSINI
et al., 2007) since the SR did not show any significant
correlation with the LAI. This indicates that the use of these coefficients is not suitable for rainy conditions in spring, since there is a lot of variability in the LAI associated with the possible adverse effect resulting from the water surplus to which the plants are subjected
(GRASSINIet al., 2007; YASUMOTOet al., 2011).
As a result, coefficients for correction of the leaf area index were also developed due to the variation in incident solar radiation that year; the intention being to correct the estimated LAI using those coefficients. As the coefficients did not give better results for the coefficient of determination (R2<0.6) or for the root mean square
a number of days of water surplus, was seen to be promising for improving estimation of the LAI by the model from the years of El Niño (Figure 4). The results confirmed the negative interference in leaf area of the conditions of water surplus. This effect, associated with high disease severity (LOOSEet al., 2012) also affects
the end production of achenes (GRASSINIet al., 2007;
YASUMOTOet al., 2011).
Figure 3 - Test of estimated leaf area index throughout the cycle by the modified sigmoidal model for the crop years of 2009/10 (A) and 2010/11 (B) (p<0.05)
Figure 4 - Reduction of the maximum leaf area index (LAI,
m2 m-2) as a function of the number of days with a water
surplus (p<0.05)
Usually the simpler the model, the greater its use; however it is important that these models be generated for conditions which are similar to those they will be applied to, due to the smaller number of variables used (MÜLLER
et al., 2005). In years of water surplus therefore, there
is a need to correct the value for LAI estimated by the modified sigmoidal model to a lower value.
CONCLUSIONS
1. Estimation of leaf area index in the sunflower as a function of thermal time is possible;
2. The modified sigmoidal model is the one that best fits LAI (measured) data as a function of thermal time; 3. With the occurrence of rain in spring, typical of years
with El Niño, it is necessary to correct the LAI estimated by the modified sigmoidal model.
REFERENCES
AIKEN, R. M. Applying thermal time scales to sunflower development. Agronomy Journal, v. 97, n. 3, p. 746-754,
2005.
BRASIL. MINISTÉRIO DA AGRICULTURA, PECUÁRIA E ABASTECIMENTO. Portaria nº 106 de 6 de maio de 2010. Aprova o Zoneamento Agrícola para a cultura de girassol no Estado do Rio Grande do Sul, ano-safra 2010/2011. Diário Oficial [da] República Federativa do Brasil, Brasília, DF, 7
maio 2010. Seção 1, n 86, p. 12-15.
CARGNELUTTI FILHO, A. et al. Altitude e coordenadas
geográficas na estimativa da temperatura mínima média decendial do ar no Estado do Rio Grande do Sul.Pesquisa Agropecuária Brasileira, v. 41, n .6, p. 893-901, 2006.
CHEN, X.; PAN, W. Relationships among phenological growing season, time-integrated normalized difference vegetation index and climate forcing in the temperate region of eastern China.International Journal of Climatology, v. 22,
n. 14, p. 1781-1792, 2002.
FAVARIN, J. L.et al. Equações para a estimativa do índice de
área foliar do cafeeiro.Pesquisa Agropecuária Brasileira, v. 37, n. 6, p. 769-773, 2002.
GOYNE, P. J.; HAMMER, G. L. Phenology of sunflower cultivars. II. Controlled-environment studies of temperature and photoperiod effects.Australian Journal of Research, v. 33, n. 2, p. 251-261, 1982.
GRASSINI, P. et al. Responses to short-term waterlogging
during grain filling in sunflower. Field Crops Research, v. 101, n. 3, p. 352-363, 2007.
GRAMIG, G. G.; STOLTENBERG, D. E. Leaf appearance base temperature and phyllochron for common grass and broad leaf weed species.Weed Technology, v. 21, n. 1, p. 249-254,
2007.
HORIE, T. et al. A formal template for the development
of cucumber in its vegetative stage. Proceedings of the Koninklijke Nederlande Akademie van Wetenschappen, v. 82, n. 4, p. 433-479, 1979.
IZQUIERDO, N. et al. Night temperature affects fatty acid
composition in sunflower oil depending on the hybrid and the phenological stage.Field Crop Research, v. 77, n. 2/3, p. 115-126, 2002.
JONCKHEERE, I.et al. Review of methods for in situ leaf area
index determination. I: Theories, sensors and hemispherical photography.Agricultural and Forest Meteorological, v. 121,
n. 1/2, p. 19-35, 2004.
KANDIANNAN, K. et al. Modeling individual leaf area of
ginger (Zingiber officinaleRoscoe) using leaf length and width. Scientia Horticulturae, v. 120, n. 4, p. 532-537, 2009. LIZASO, J. I.; BATCHELOR, W. D.; WESTGATE, M. E. A leaf area model to simulate cultivar-specific expansion and senescence of maize leaves. Field Crops Research, v. 80, n. 1, p. 1-17, 2003.
LOOSE, et al. Severidade de ocorrência das manchas de Alternária e septoriose em girassol semeado em diferentes épocas no Rio Grande do Sul.Bragantia,v. 71, n. 2, p. 282-289, 2012.
LOHMANN, S.et al. Long-term variability of solar direct and
global radiation derived from ISCCP data and comparison with reanalysis data.Solar Energy, v. 80, n. 11, p. 1390-1401, 2006. MALDANER, I. C. et al. Modelo de determinação
não-destrutiva da área foliar em girassol. Ciência Rural, v. 39, n. 5,
p. 1356-1361, 2009.
MALDANER, I. C. et al. Estimativa da temperatura base da
emergência-início da antese em girassol. In: CONGRESSO
BRASILEIRO DE AGROMETEOROLOGIA, 17., 2011, Guarapari. Anais... Guarapari: Sociedade Brasileira de Agrometeorologia, 2011. 1 CD-ROM.
MOLOD, A.; SALMUN, H.; WAUGH, D. W. A new look at modeling surface heterogeneity: extending its influence in the vertical.Journal of Hydrometeorology, v. 4, n. 5, p. 810-825, 2003.
MÜLLER, A. G. et al. Estimativa do índice de área foliar do
milho a partir da soma de graus-dia. Revista Brasileira de Agrometeorologia, v. 13, n. 1, p. 65-71, 2005.
PEREIRA, A. R.; ANGELOCCI, L. R.; SENTELHAS, P. C.
Agrometeorologia: fundamentos e aplicações práticas.Guaíba: Agropecuária, 2002. 478 p.
SERDAR, U.; DEMIRSOY, H. Non-destructive leaf area estimation in chestnut.Scientia Horticulturae, v. 108, n. 2, p. 227-230, 2006.
SILVA, J. C.et al. Análise de distribuição de chuva para Santa
Maria, RS. Revista Brasileira de Engenharia Agrícola e Ambiental, v. 11, n. 1, p.67-72, 2007.
SILVA, P. R. F.; FREITAS, T. F. S. Biodiesel: o ônus e o bônus de produzir combustível.Ciência Rural, v. 38, n. 3, p.843-851, 2008. THOMAZ, G. L.et al. Produção do girassol e teor de óleo nas sementes em diferentes épocas de semeadura no Centro-Sul do Paraná.Ciência Rural, v. 42, n. 2, p. 203-208, 2012.
TSIALTAS, J. T.; MASLARIS, N. Evaluation of a leaf area prediction model proposed for sunflower.Photosynthetica, v. 46, n. 2, p. 294-297, 2008.
WEISS, E. A. Tropical Oilseed Crops. New York: Longmans, 1983.
YASUMOTO, S.et al. Effects of high water table and short-term
flooding on growth, yield, and seed quality of sunflower.Plant Production Science, v. 14, n. 3, p. 233-248, 2011.
YOSHIDA, S. Molecular regulation of leaf senescence.Current Opinion in Plant Biology, v. 6, n. 1, p. 79-84, 2003.
ZAHOOR, A.et al. Ontogeny growth and radiation use efficiency
of Helianthus annuus L. as affected by hybrids, nitrogenous
regimes and planting geometry under irrigated arid conditions.