Pesq. agropec. bras., Brasília, v.48, n.10, p.1394-1401, out. 2013 DOI: 10.1590/S0100-204X2013001000011
Multispectral remote sensing for site‑specific
nitrogen fertilizer management
Nikrooz Bagheri(1), Hojjat Ahmadi(2), Seyed Kazem Alavipanah(3) and Mahmoud Omid(2)
(1)Agricultural Engineering Research Institute, P.O. Box 31585‑845, Karaj, Iran. E‑mail: [email protected] (2)University of Tehran, Department of Agricultural Machinery Engineering, P.O. Box 4111, Karaj, Iran. E‑mail: [email protected], [email protected] (3)University of Tehran, Faculty of Geography, Department of Remote Sensing, Tehran, Iran. E‑mail: [email protected]
Abstract – The objective of this work was to evaluate the use of multispectral remote sensing for site‑specific nitrogen fertilizer management. Satellite imagery from the advanced spaceborne thermal emission and reflection radiometer (Aster) was acquired in a 23 ha corn‑planted area in Iran. For the collection of field samples, a total of 53 pixels were selected by systematic randomized sampling. The total nitrogen content in corn leaf tissues in these pixels was evaluated. To predict corn canopy nitrogen content, different vegetation indices, such as normalized difference vegetation index (NDVI), soil‑adjusted vegetation index (Savi), optimized soil‑adjusted vegetation index (Osavi), modified chlorophyll absorption ratio index 2 (MCARI2), and modified triangle vegetation index 2 (MTVI2), were investigated. The supervised classification technique using the spectral angle mapper classifier (SAM) was performed to generate a nitrogen fertilization map. The MTVI2 presented the highest correlation (R2=0.87) and is a good predictor of corn canopy nitrogen content in the V13 stage, at 60 days after cultivating. Aster imagery can be used to predict nitrogen status in corn canopy. Classification results indicate three levels of required nitrogen per pixel: low (0–2.5 kg), medium (2.5–3 kg), and high (3–3.3 kg).
Index terms: Aster, nitrogen content, near infrared, multispectral response, precision agriculture, vegetation indices.
Sensoriamento remoto multiespectral no manejo
sítio‑específico da adubação nitrogenada
Resumo – O objetivo deste trabalho foi avaliar o uso de sensoriamento remoto multiespectral no manejo sítio‑específico da adubação nitrogenada. Imagens de satélite do “advanced spaceborne thermal emission e reflection radiometer” (Aster) foram obtidas em uma área de 23 ha cultivados com milho, no Irã. Para a coleta das amostras de campo, foi feita a seleção de 53 pixels, por meio do método de amostragem aleatória sistemática. Avaliou‑se o teor de nitrogênio total nos tecidos foliares do milho, nesses pixels. Para estimar o teor de nitrogênio da parte aérea do milho, foram utilizados diferentes índices de vegetação, como “normalized difference vegetation index” (NDVI), “soil‑adjusted vegetation index” (Savi), “optimized soil‑adjusted vegetation index” (Osavi), “modified chlorophyll absorption ratio index 2” (MCARI2) e “modified triangle vegetation index 2” (MTVI2). Utilizou‑se a técnica de classificação supervisionada com classificador “spectral angle mapper” (SAM) para a geração do mapa de adubação nitrogenada. O MTVI2 apresentou maior correlação (R2=0,87) e é um bom previsor do conteúdo de nitrogênio no estágio V13, 60 dias após o cultivo. Imagens Aster podem ser utilizadas para prever o status de nitrogênio na parte aérea do milho. Os resultados de classificação indicam três níveis de nitrogênio requerido por pixel: baixo (0–2,5 kg), médio (2,5–3 kg) e alto (3–3,3 kg). Termos para indexação: Aster, conteúdo de nitrogênio, infravermelho próximo, resposta multiespectral, agricultura de precisão, índices de vegetação.
Introduction
Excessive nitrogen fertilization negatively influences water and air quality and ecosystem biodiversity. Consequently, scientific and political communities are calling for agroecosystem managers to explore
either soil or plant analysis, which are expensive, slow or labor‑intensive (Min & Lee, 2005).
Remote sensing, as a timely and none destructive tool, could be an alternative to traditional plant testing for diagnosis of crop nitrogen status. Remote sensing of canopy reflectance can be used to sample a plant population or community rather than individual plants and to rapidly assess the spatial variability of a crop field (Feng et al., 2008). Remote sensing also has the potential to address environmental issues and to save cost, time, and labor (Min & Lee, 2005). Therefore, the application of remote sensing systems, which can be used to study large areas, has increased in agricultural management, mainly due to the improvement in the spatial, spectral, and temporal resolutions of remotely sensed observations (Karimi et al., 2005). The positive relationship between leaf greenness and crop canopy status indicates that it should be possible to assess crop nitrogen needs using remotely sensed reflectance measurements of crop canopy and leaves (Shanahan et al., 2008). Xue & Yang (2008) suggested using remote sensing for nitrogen fertilizer application.
Remote sensing has been used for nitrogen diagnosis in several studies. Kostrzewski et al. (2003) developed a ground‑based remote sensing system to separate water and nitrogen stress. The authors observed differences in the coefficient of variation of stress indices between treatments at 3 and 7 m grid resolution, which were finer for water and nitrogen stress, respectively. Borhan et al. (2004) used multispectral and color imaging techniques to determine nitrate and chlorophyll content in potato leaves in a controlled environment. The multiple linear regression between multispectral band features and nitrate showed a linear relationship with a correlation of 0.84 (Borhan et al., 2004). Jongschaap & Booij (2004) estimated canopy nitrogen contents of potato by remote sensing observations. The authors reported an exponential relation between canopy organic nitrogen contents and red edge position derived from reflectance measurements, with a good correlation of 0.82. Koch et al. (2004) compared different nitrogen management strategies, such as uniform, grid‑based, site‑specific management zone‑constant yield goal (SSMZ‑CYG) and site‑specific management zone‑variable yield goal (SSMZ‑VYG), and found that less total nitrogen fertilizer (6–46%) was used with the SSMZ‑VYG strategy than with uniform nitrogen management.
Beeri et al. (2005) used satellite models to estimate sugar beet residue nitrogen credit. Hyperspectral data
were convolved to fit Landsat5, Spot5, Quick‑bird2, and Ikonos2 multispectral satellite band models, created using linear regression. The authors provided separate models for nitrogen credit and for precision sugar beet nitrogen management. Sui & Thomasson (2006) developed a ground‑based sensing system with a multispectral optical sensor to measure plant reflectance, determining nitrogen status in cotton plant. Results showed that the spectral information had significant correlation with cotton leaf nitrogen content (Sui & Thomasson, 2006).
Perry & Davenport (2007) evaluated spectral and spatial differences in the response of vegetation indices to nitrogen treatment on apple. Imagery from the Quick‑bird2 satellite was used to generate the normalized difference vegetation index (NDVI) for individual trees. Results showed that remote sensing could be a useful tool to extrapolate handheld measurements spatially throughout an orchard (Perry & Davenport, 2007). Feng et al. (2008) used hyperspectral bands and estimation indices in wheat and found that the model could be used for reliable estimation of leaf nitrogen status.
Pagola et al. (2009) proposed and evaluated a new low‑cost method to estimate the nitrogen nutrition status of plants using digital color image analysis. They calculated the correlation between the indices and measurements obtained with a soil and plant analysis development (SPAD‑502) chlorophyll meter for fertilizer management decisions. Results showed that the capability of the proposed index to predict nitrogen deficiencies affecting barley yield was equal to or better than that of SPAD measurements under their experimental conditions (Pagola et al., 2009). Bagheri et al. (2012) investigated the capability of soil‑line vegetation indices, such as “soil‑adjusted vegetation index” (Savi), “optimized soil‑adjusted vegetation index” (Osavi) and “modified triangle vegetation index 2” (MSAVI2), to predict corn nitrogen content and observed that the investigated vegetation indices were correlated with corn canopy nitrogen content.
The objective of this work was to evaluate the use of multispectral remote sensing for site‑specific nitrogen fertilizer management.
Materials and Methods
Pesq. agropec. bras., Brasília, v.48, n.10, p.1394‑1401, out. 2013 DOI: 10.1590/S0100‑204X2013001000011
of Tehran Province, Iran (35°30'N, 51°36'E). Corn was cultivated on July 5th and harvested on October 10th,
2009. The field was fertilized according to the usual practice of the region, and nitrogen was applied as urea solution in five times via 5 stage irrigations (150, 125, 100, 75 and 50 kg urea per ha, respectively).
For sampling, the farm was gridded using a 15 m grids, and coordinates were collected by a 3 m accuracy GPS Magellan Explorist‑600 (Magellan, Santa Clara, CA, USA). A total of 53 pixels were selected by the systematic randomized sampling method for corn canopy nitrogen content analysis. For each pixel, five samples (an area of 1 m2 for each sample) were
harvested 60 days after cultivating in the V13 stage on 9/4/2009, and average data were used for analysis.
Leaves were separated, oven‑dried at 70°C for 48 hours, weighed on a digital scale with 0.1 g accuracy, and then ground to pass a 1 mm mesh screen, stored in plastic bags, and sent to the laboratory for
determination of total nitrogen content in leaf tissues by the Kjeldahl method (Xue & Yang, 2008).
Multispectral satellite imagery from the advanced spaceborne thermal emission and reflection radiometer (Aster), for a sunny and cloudless day, was acquired on 9/4/2009. Three spectral bands in the visible (green and red bands) and near infrared (NIR) with 15 m ground resolution were used (Figure 1).
Image processing was carried out with the environment for visualizing images (Envi) remote sensing software (Research Systems Inc., Boulder, CO, USA). Geometric correction was performed with 1:25000 scale maps by root mean square (RMS) of 0.2 pixels.
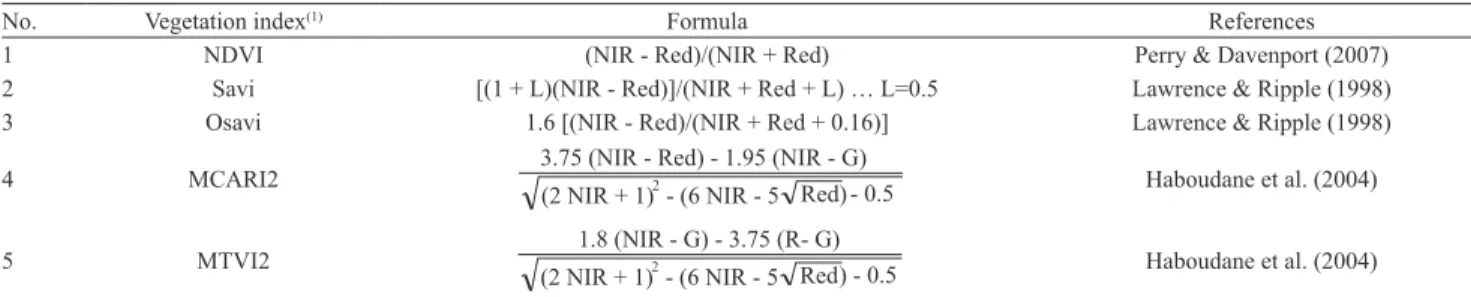
To predict corn canopy nitrogen content, vegetation indices sensitive to crop canopy nitrogen were used, namely, NDVI, Savi, Osavi, MCARI2, and MTVI2. The vegetation indices’ equations used for nitrogen prediction are shown on Table 1.
Figure 1. Advanced spaceborne thermal emission and reflection radiometer (Aster) imagery of the county of
Pakdasht in the south of Tehran Province, Iran.
Table 1. Specification of vegetation indices used for prediction of corn canopy nitrogen.
No. Vegetation index(1) Formula References
1 NDVI (NIR ‑ Red)/(NIR + Red) Perry & Davenport (2007)
2 Savi [(1 + L)(NIR ‑ Red)]/(NIR + Red + L) … L=0.5 Lawrence & Ripple (1998)
3 Osavi 1.6 [(NIR ‑ Red)/(NIR + Red + 0.16)] Lawrence & Ripple (1998)
4 MCARI2 Haboudane et al. (2004)
5 MTVI2 Haboudane et al. (2004)
(1)NDVI, normalized difference vegetation index; Savi, soil‑adjusted vegetation index; Osavi, optimized soil‑adjusted vegetation index; MCARI2, modified
To investigate the accuracy of vegetation indices in the prediction of corn canopy nitrogen content, the measured data obtained in laboratory tests were compared with data predicted by vegetation indices. For each vegetation index, different mathematical equations – linear, logarithmic, second‑order, power, and exponential regression types – were used to determine the highest correlation with nitrogen content.
The supervised classification technique using the spectral angle mapper classifier (SAM) was performed to identify different corn canopy nitrogen levels. To evaluate the accuracy of the supervised classification, the confusion matrix and overall accuracy were determined.
Results and Discussion
For all investigated vegetation indices, a second‑order polynomial equation was used to correlate vegetation indices to corn canopy nitrogen content, because this model had the highest correlation and the lowest root mean square error (RMSE) among the different regression models (Table 2). Among all vegetation indices, MTVI2 had the highest correlation (R2=0.87) (Figure 2) and lowest RMSE (0.088). The
high correlation of MTVI2 with the nitrogen content is attributed to the fact that this index is an improved model of the triangle vegetation index (TVI), which depends on crop color and chlorophyll content (Haboudane et al., 2004). Therefore, MTVI2 is a useful index to estimate nitrogen content. MCARI2, with coefficient of determination of 0.789 and RMSE of 0.115, was the second best index for nitrogen content prediction. This index is an improved model of the chlorophyll absorption ratio index (CARI), which is very sensitive to chlorophyll and nitrogen content (Haboudane et al., 2004).
The results of Savi and Osavi were similar because both are soil‑line vegetation indices that have the same effect on canopy and can minimize soil brightness (Bagheri et al., 2012).
NDVI had the lowest correlation (adjusted R2=0.72
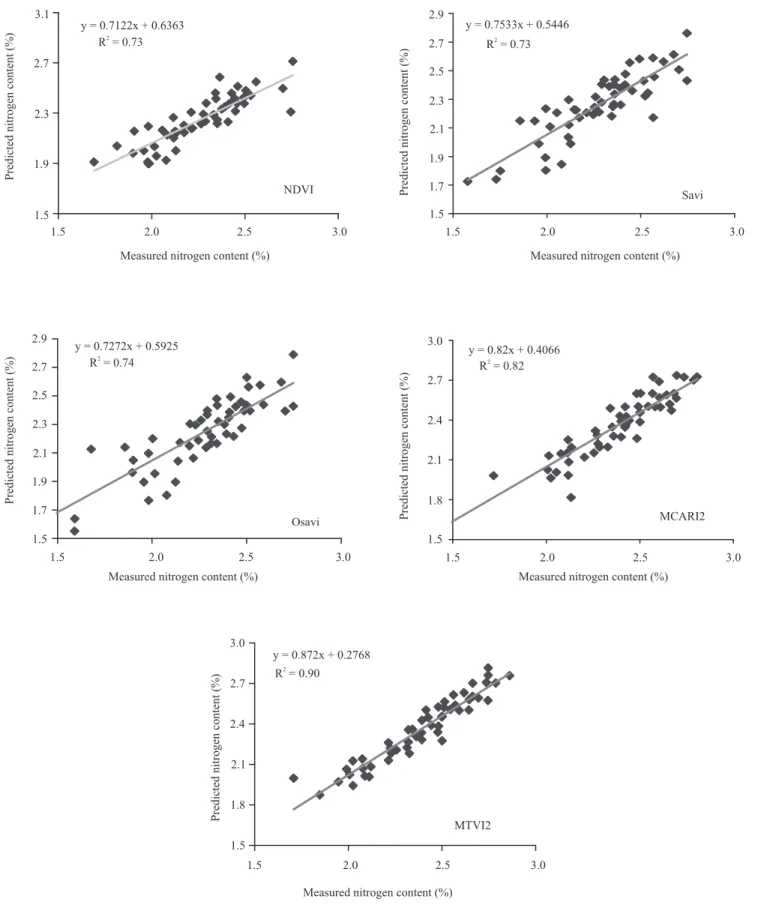
and RMSE=0.121) due to its inability to remove soil effects and reflection (Perry & Davenport, 2007). In general, the results indicated that all evaluated vegetation indices were highly correlated to corn canopy nitrogen content and could successfully estimate corn canopy nitrogen in the V13 stage (Figure 3). Therefore, among the studied indices, MTVI2 had the highest correlation (R2=0.90) between
measured and predicted data. Prediction power analysis of the algorithms proposed by Haboudane et al. (2004), based on MTVI2, resulted in agreements between modeled and ground measurements of non‑destructive leaf area index, with adjusted R2 of
0.89 for corn.
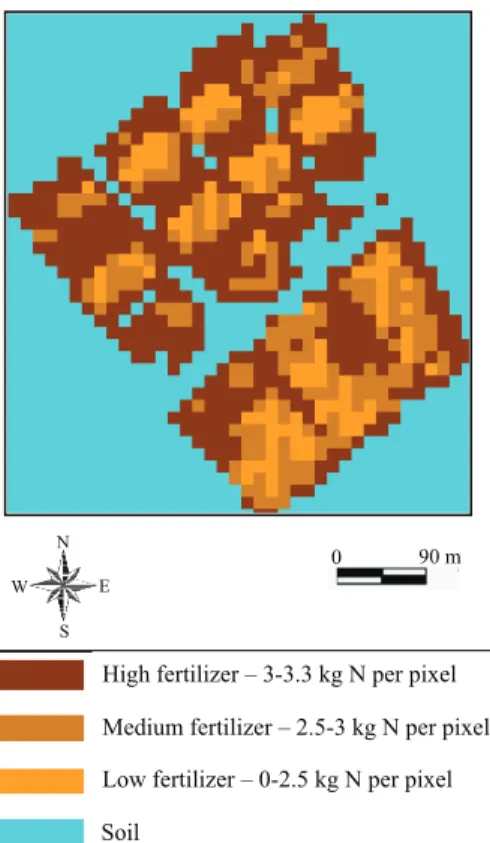
Since MTVI2 had the highest correlation with nitrogen content among the investigated vegetation indices, it was used to generate a corn canopy nitrogen map (Figure 4). The overall accuracy and kappa coefficient were 97.53% and 0.967, respectively, for supervised classification. The results showed that the required nitrogen in the experimental area could be categorized in three levels: low (0–2.5 kg N per pixel), medium (2.5–3 kg N per pixel), and high (3–3.3 kg N per pixel).
Based on these results, the nitrogen fertilizer application rate in the experimental farm varied widely (Figure 4). Therefore, it is important to consider these changes for nitrogen application management during the vegetation period. Results also showed poor distribution of nitrogen fertilizer application in the experimental farm, indicating that it is necessary to use site‑specific nitrogen fertilizer management and variable‑rate nitrogen application.
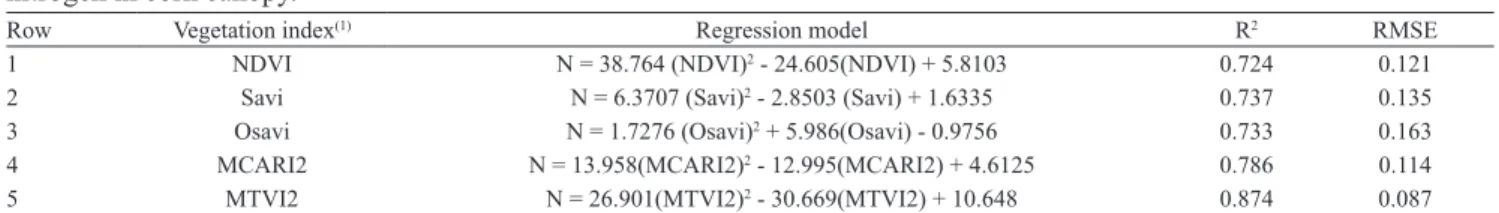
Table 2. Root mean square error (RMSE) and adjusted R2 of regression models for different vegetation indices to predict nitrogen in corn canopy.
Row Vegetation index(1) Regression model R2 RMSE
1 NDVI N = 38.764 (NDVI)2 ‑ 24.605(NDVI) + 5.8103 0.724 0.121
2 Savi N = 6.3707 (Savi)2 ‑ 2.8503 (Savi) + 1.6335 0.737 0.135
3 Osavi N = 1.7276 (Osavi)2 + 5.986(Osavi) ‑ 0.9756 0.733 0.163
4 MCARI2 N = 13.958(MCARI2)2 ‑ 12.995(MCARI2) + 4.6125 0.786 0.114
5 MTVI2 N = 26.901(MTVI2)2 ‑ 30.669(MTVI2) + 10.648 0.874 0.087
(1)NDVI, normalized difference vegetation index; Savi, soil‑adjusted vegetation index; Osavi, optimized soil‑adjusted vegetation index; MCARI2, modified
Pesq. agropec. bras., Brasília, v.48, n.10, p.1394‑1401, out. 2013 DOI: 10.1590/S0100‑204X2013001000011
Figure 2. Regression models between corn canopy nitrogen content and vegetation indices used for nitrogen prediction in the
Figure 3. Linear relationship between predicted and measured nitrogen contents for different vegetation indices. NDVI,
Pesq. agropec. bras., Brasília, v.48, n.10, p.1394‑1401, out. 2013 DOI: 10.1590/S0100‑204X2013001000011
Conclusions
1. The modified triangle vegetation index 2 (MTVI2) is a good predictor of corn canopy nitrogen content in the V13 stage, at 60 days after sowing.
2. Advanced spaceborne thermal emission and reflection radiometer (Aster) imagery can be used to predict nitrogen status in corn canopy.
Acknowledgements
To Agriculture‑Jihad Think Tank of Iran and University of Tehran, for financial support; and to Dr. S. A. A. Moazzen, for his advice and critical review of the manuscript.
References
BAGHERI, N.; AHMADI, H.; ALAVIPANAH, S.K.; OMID, M.
Soil‑line vegetation indices for corn nitrogen content prediction.
International Agrophysics, v.26, p.103‑108, 2012. DOI: 10.2478/
v10247‑012‑0016‑8.
BEERI, O.; PHILLIPS, R.; CARSON, P.; LIEBIG, M. Alternate
satellite models for estimation of sugar beet residue nitrogen credit.
Agriculture, Ecosystems and Environment, v.107, p.21‑35,
2005. DOI: 10.1016/j.agee.2004.10.030.
BORHAN, M.S.; PANIGRAHI, S.L.; ORENZEN, J.H.; GU, H. Multispectral and color imaging techniques for nitrate and
chlorophyll determination of potato leaves in a controlled environment. Transactions of the ASAE, v.47, p.599‑608, 2004.
DOI: 10.13031/2013.16023.
FENG, W.; YAO, X.; ZHU, Y.; TIAN, Y.C.; CAO, W.X. Monitoring leaf nitrogen status with hyperspectral reflectance in wheat.
European Journal of Agronomy, v.28, p.394‑404, 2008. DOI:
10.1016/j.eja.2007.11.005.
HABOUDANE, D.; MILLER, J.R.; PATTEY, E.; ZARCO‑TEJADA, P.J.; STRACHAN, I.B. Hyperspectral vegetation indices and novel algorithms for predicting green LAI of crop canopies: modeling
and validation in the context of precision agriculture. Remote
Sensing of Environment, v.90, p.337‑352, 2004. DOI: 10.1016/j.
rse.2003.12.013.
JONGSCHAAP, R.E.E.; BOOIJ, R. Spectral measurements at different spatial scales in potato: relating leaf, plant and canopy
status. International Journal of Applied Earth Observation
and Geoinformation, v.5, p.205‑218, 2004. DOI: 10.1016/j.
jag.2004.03.002.
KARIMI, Y.; PRASHER, S.O.; MCNAIRN, H.; BONNELL, R.B.; DUTILLEUL, P.; GOEL, P.K. Discriminant analysis of
hyperspectral data for assessing water and nitrogen stresses in corn. Transactions of the ASAE, v.48, p.805‑813, 2005. DOI:
10.13031/2013.18303.
KOCH, B.; KHOSLA, R.; FRASIER, W.M.; WESTFALL, D.G.; INMAN, D. Economic feasibility of variable‑rate nitrogen application utilizing site‑specific management zones.
Journal of Agronomy, v.96, p.1572‑1580, 2004. DOI: 10.2134/
agronj2004.1572.
KOSTRZEWSKI, M.; WALLER, P.; GUERTIN, P.; HABERLAND, J.; COLAIZZI, P.; BARNES, E.; THOMPSON, T.; CLARKE, T.; RILEY, E.; CHOI, C. Ground‑based remote sensing of water and
nitrogen stress. Transactions of the ASAE, v.46, p.29‑38, 2003.
DOI: 10.13031/2013.12546.
LAWRENCE, R.L.; RIPPLE, W.J. Comparisons among vegetation indices and bandwise regression in a highly disturbed,
heterogeneous landscape. Remote Sensing of Environment, v.64,
p.91‑102, 1998. DOI: 10.1016/S0034‑4257(97)00171‑5.
MIN, M.; LEE, W.S. Determination of significant wavelengths
and prediction of nitrogen content for citrus. Transactions of the
ASAE, v.48, p.455‑461, 2005. DOI: 10.13031/2013.18308.
PAGOLA, M.; ORTIZ, R.; IRIGOYEN, I.; BUSTINCE, H.; BARRENECHEA, E.; APARICIO‑TEJO, P.; LAMSFUS, C.; LASA, B. New method to assess barley nitrogen nutrition status based on image colour analysis comparison with SPAD‑502.
Computers and Electronics in Agriculture, v.65, p.213‑218,
2009. DOI: 10.1016/j.compag.2008.10.003.
Figure 4. Required nitrogen application map for an
Received on February 12, 2013 and accepted on September 20, 2013 PERRY, E.M.; DAVENPORT, J.R. Spectral and spatial differences
in response of vegetation indices to nitrogen treatments on apple.
Computers and Electronics in Agriculture, v.59, p.56‑65, 2007.
DOI: 10.1016/j.compag.2007.05.002.
SHANAHAN, J.F.; KITCHEN, N.R.; RAUN, W.R.; SCHEPERS, J.S. Responsive in‑season nitrogen management for cereals.
Computers and Electronics in Agriculture, v.61, p.51‑62, 2008.
DOI: 10.1016/j.compag.2007.06.006.
SUI, R.; THOMASSON, J.A. Ground‑based sensing system for
cotton nitrogen status determination. Transactions of the ASAE,
v.49, p.1983‑1991, 2006. DOI: 10.13031/2013.22279.
XUE, L.; YANG, L. Recommendations for nitrogen fertilizer topdressing rates in rice using canopy reflectance spectra.
Biosystems Engineering, v.100, p.524‑534, 2008. DOI: 10.1016/j.