A ROBUST FALSE MATCHING POINTS DETECTION METHOD FOR
REMOTE SENSING IMAGE REGISTRATION
X. J. Shan, P. Tang *
Institute of Remote Sensing and Digital Earth, Chinese Academy of Sciences, Chao Yang, Beijing 100101, China –(shanxj, tangping)@radi.ac.cn
Commission VI, WG VI/4
KEY WORDS: Image registration, False matching points detection, RANSAC, GTM, K-NN graph, SIFT
ABSTRACT:
Given the influences of illumination, imaging angle, and geometric distortion, among others, false matching points still occur in all image registration algorithms. Therefore, false matching points detection is an important step in remote sensing image registration. Random Sample Consensus (RANSAC) is typically used to detect false matching points. However, RANSAC method cannot detect all false matching points in some remote sensing images. Therefore, a robust false matching points detection method based on K-nearest-neighbour (K-NN) graph (KGD) is proposed in this method to obtain robust and high accuracy result. The KGD method starts with the construction of the K-NN graph in one image. K-NN graph can be first generated for each matching points and its K nearest matching points. Local transformation model for each matching point is then obtained by using its K nearest matching points. The error of each matching point is computed by using its transformation model. Last, L matching points with largest error are identified false matching points and removed. This process is iterative until all errors are smaller than the given threshold. In addition, KGD method can be used in combination with other methods, such as RANSAC. Several remote sensing images with different resolutions and terrains are used in the experiment. We evaluate the performance of KGD method, RANSAC + KGD method, RANSAC, and Graph Transformation Matching (GTM). The experimental results demonstrate the superior performance of the KGD and RANSAC + KGD methods.
1. INTRODUCTION
Image registration is a key step in remote sensing image processing and is widely used in image stitching, change detection, image fusion, and other applications. However, given the influences of illumination, imaging angle, geometric distortions, and others, false matching points are still observed in all image registration algorithms. Scale-invariant feature transform (SIFT) (Lowe, 2004) and its improvements (Bay et al., 2006; Ke and Sukthankar, 2004; Li et al., 2011; Mikolajczyk and Schmid, 2005) also demonstrate false matching points. Therefore, false matching points detection is an important step in remote sensing image registration.
Random Sample Consensus (RANSAC) (Fischler and Bolles, 1981) and least-squares fitting method are commonly used to detect false matching points. The least-squares fitting method can be easily influenced by false matching points with significant errors. RANSAC is an iterative method to estimate parameters of a mathematical model from a set of observed data. Therefore, RANSAC has been widely used in remote sensing registration (Huo et al., 2012; Palenichka and Zaremba, 2010; Cao et al., 2013). For remote sensing image registration, a fundamental matrix is typically used to detect outliers, which are false matching points. However, given the influence of complex geometric distortions, complex terrains, a large proportion of false matching points and others, partial false matching points in some remote sensing images cannot be detected by RANSAC.
Aguilar et al. (2009) proposed a graph transformation matching method which is used for non-rigid medical images with local distortions. GTM has the advantage of not requiring any model.
and can be used for images with various geometric distortions. However, GTM has two drawbacks: (1) the two graphs of some false matching points are isomorphic, which lead that these false matching points cannot be detected; (2) the two graphs of some correct matching points are non-isomorphism, which lead that these correct matching points can be removed.
To achieve a highly accurate detection of false matching points, a robust false matching points detection method based on the K-nearest-neighbour (K-NN) graph (KGD) is proposed in this paper. The experiment results demonstrate that KGD can obtain greater detection accuracy than RANSAC and GTM methods.
2. KGD METHOD 2.1 The workflow of KGD
GTD method starts with the initial matching points obtained from any image matching methods. A K-NN graph is first constructed by using matching points in the original image or reference image. Then the error of each pair of matching point is computed by using its local transformation model obtained by using its K nearest matching points. Some matching points with largest error are identified false matching points and removed. This process is iterative until all errors are smaller than the given threshold.
The workflow of KGD method is shown in Figure 1:
The International Archives of the Photogrammetry, Remote Sensing and Spatial Information Sciences, Volume XL-7/W3, 2015 36th International Symposium on Remote Sensing of Environment, 11–15 May 2015, Berlin, Germany
This contribution has been peer-reviewed.
K-NN graph constructing
Computing all error weights
Correct matching points outputing Inputting all matching points
Eliminating L pairs of matching points
error weights are larger Threshold?
No Yes
Figure 1. The workflow of KGD
The detailed detection steps of KGD are as follows:
(1) The K-NN graph is constructed by using proposed method in section 2.2.
(2) The error weight for each pair of matching points Mi is computed. The S pairs of matching points are obtained from neighbourhoods of Mi in K-NN graph. A local transformation mode is then established by using S pairs of matching points. Last, the error weight is computed by using this local transformation mode as follows:
2
2i i i i
error x x y y (1)
where, (xi,yi) is coordinate of matching points in the original
image, and (xi, yi) is the coordinate in the original image
obtained according to the same geographic coordinate of the corresponding matching point in the reference image.
If the value of S is less than the minimum matching points that are required to estimate model parameters, the error weight of this matching point is set 0.
(3) Eliminating L pairs of matching points with largest error weights. Because false matching points are also used to compute error weights of some matching points, these error weights are not correct. Therefore, false matching points are iteratively eliminated. At every iteration, L pairs of matching points is identified and eliminated. The minimum value of L is 1.
(4) Iteration termination determination. If all error weights of remaining matching points are less than a given threshold, the iteration stops. Otherwise, the algorithm returns to step (1) and continues to eliminating.
In addition, another advantage of KGD method is that it can be used in conjunction with other detection methods, for example RANSAC. RANSAC or Other methods can be first used to eliminate false matching points. KGD method is then adopted to eliminate remaining false matching points. This combination is also a useful method to obtain high accuracy result.
2.2 The construction of K-NN graph
All pairs of matching points is denoted as a set of corresponding points P{(p q1, ),(1 p q2, 2), ,(p qn, n)} , where, pi is the
matching point in the original image, qi is the matching point
in the reference image.
The K-NN graph Gp(V Ep, p) is constructed as follows:
eachpiis defined as a vertex vi, such that Vpv1,...vn. A
non-directed edge (i, j) exists when piand pj satisfy the following
conditions: ||pipj||Td.
Compared with GTM, the construction process of KGD has two different aspects: (1) One graph is constructed in the KGD, while two graphs are constructed in the GTM. (2) For a constructed graph of GTM, each vertex has same number of neighbourhoods. However, for KGD, different vertexes may have different number of neighbourhoods.
3. EXPERIMENT AND RESULTS 3.1 Test images preparation
Three groups of remote sensing images with different resolutions and terrains were used in the experiment. The more information about test images is list in Table1.
Table 1. The information about test images No. Image type resolution Size
No.1 ZY-3 panchromatic 2.1 m 6244×6244 GF-1 panchromatic 2 m 6428×6455
No.2 ZY-3 panchromatic 2.1 m 4961×4272 GF-1 panchromatic 2 m 5321×4607
No.3 ZY-3 multispectral 5.8 m 2580×2432 GF-1 panchromatic 2 m 7820×7053
The terrains of NO.1 and No.3 are mountainous area, and the terrain of NO.2 is farmland and buildings. ZY-3 and GF-1 are launched from china in recent years.
3.2 Experimental Results
In this experiment, the first-order polynomial transformation mode was used, the least squares fitting method is used to solve the transformation parameters, and the value of K is 5.
For the three groups, the matching point distributions of the image matching and different detection methods and the values of root mean square error (RMSE) were compared.
3.2.1 The results of matching point distribution
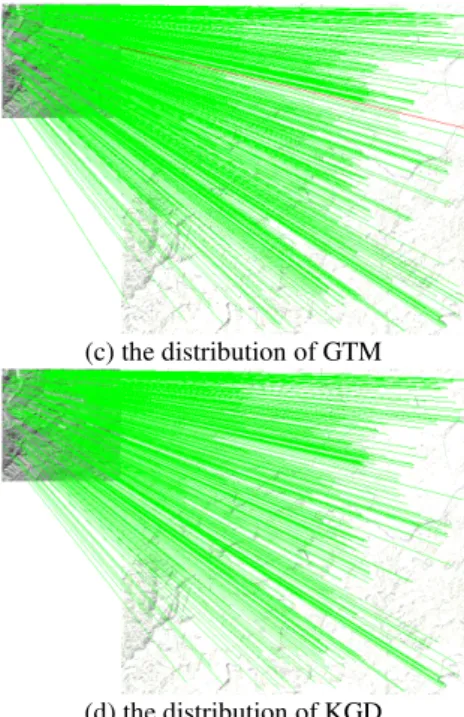
The matching point distributions of the image matching, RANSAC, GTM and KGD for three groups of test images are shown in the Figure 2, Figure 3 and Figure 4. The green lines represent correct matching points, and the red lines represent false matching points.
The International Archives of the Photogrammetry, Remote Sensing and Spatial Information Sciences, Volume XL-7/W3, 2015 36th International Symposium on Remote Sensing of Environment, 11–15 May 2015, Berlin, Germany
This contribution has been peer-reviewed.
(a) the distribution of image matching
(b) the distribution of RANSAC
(c) the distribution of GTM
(d) the distribution of KGD Figure 2. The results of the first group
For the first group, the result of RANSAC contains two false matching points, and GTM and KGD can detect all false matching points.
(a) the distribution of image matching
(b) the distribution of RANSAC
(c) the distribution of GTM
(d) the distribution of KGD Figure 3. The results of the second group
For the second group, the result of GTM contains three false matching points, and RANSAC and KGD can detect all false matching points.
(a) the distribution of image matching
(b) the distribution of RANSAC
The International Archives of the Photogrammetry, Remote Sensing and Spatial Information Sciences, Volume XL-7/W3, 2015 36th International Symposium on Remote Sensing of Environment, 11–15 May 2015, Berlin, Germany
This contribution has been peer-reviewed.
(c) the distribution of GTM
(d) the distribution of KGD Figure 4. The results of the third group
For the third group, the result of GTM contains one false matching point, and RANSAC and KGD can detect all false matching points.
The experimental results show that KGD can detect all false matching points for three groups of test images and RANSAC and KGD cannot detect some false matching points.
3.2.2 The results of RMSE
For three groups of test images, the RANSAC, GTM, KGD and RANSAC + KGD were first used to detect false matching points, respectively. Then, the values of RMSE for different detect methods were computed. The values of RMSE are shown in Figure 5. RANSAC + KGD represents the combination of RANSAC and KGD methods.
Figure 5. The values of RMSE for different detect methods.
For GTM, the detection precisions of all groups are low. For RANSAC, the detection precision for first group is lowest, and the detection precisions for second and third groups are close to KGD and RANSAC+KGD methods. For KGD, the detection precisions of all groups are high. For RANSAC+KGD, the detection precisions of all groups are best. The results show that whether by using KGD or the combination with RANSAC, highly accurate results can be obtained.
4. CONCLUTION
In order to improve the detection precision of the false matching points, a robust false matching points detection method based on K-NN graph is proposed in this paper. KGD method starts with a K-NN graph. The local transformational model is then used to detect false matching points. This process is iterative until all false matching points are detected. Several remote sensing images with different resolutions and terrains are used in the experiment. The experimental results show that the detection precisions of KGD and KGD+RANSAC methods are better than GTM and RANSAC methods.
ACKNOWLEDGEMENTS
This work was supported by the National High Technology Research and Development Program of China under Grant 2012AA12A304.
REFERENCES
Aguilar W., Frauel Y., Escolano F. et al., 2009. A robust graph transformation matching for non-rigid registration. Image and Vision Computing, 27(7): 897–910.
Bay H., Tuytelaars T., Van Gool L., 2006. SURF: speeded up robust features. In: The Proceedings of 9th European Conference on Computer Vision, Graz, Austria, Vol. 3951, Part I, pp. 404-417.
Cao S.X., Jiang J., Zhang G.J., et al., 2013. An edge-based scale- and affine-invariant algorithm for remote sensing image registration. International Journal of Remote Sensing, 34(7), pp. 2301-2326.
Fischler M. A., Bolles R. C., 1981. Random sample consensus: a paradigm for model fitting with applications to image analysis and automated cartography. Communications of the Association for Computing Machinery, 24(6), pp. 381-395.
Huo C. L., Pan C. Huo H., et al., 2012. Multilevel SIFT matching for large-size VHR image registration. IEEE Geoscience and Remote Sensing Letter, 9(2), pp.171-175.
Ke Y., Sukthankar R., 2004. PCA-SIFT: A more distinctive representation for local image descriptors. In: Proceedings of IEEE Computer Society Conference on Computer Vision and Pattern Recognition, Washington, USA, Vol. 2, pp. 506-513.
Li B., Xiao R., Li Z.W., et al., 2011. Rank-SIFT: Learning to Rank Repeatable Local Interest Points. In: Proceedings of IEEE Conference on Computer Vision and Pattern Recognition, Providence, RI, pp.1737-1744.
Lowe D. G., 2004. Distinctive image features from scale-invariant keypoints. International Journal of Computer Vision, 60(2), pp. 91-110.
Mikolajczyk K. and Schmid C., 2005. A performance evaluation of local descriptors. In: Proceedings of IEEE Transactions on Pattern Analysis and Machine Intelligence, 27(10), pp.1615-1630.
Palenichka R. M. and Zaremba M. B., 2010. Automatic extraction of control points for the registration of optical satellite and LiDAR images. IEEE Transactions on Geoscience and Remote Sensing, 48(7), pp. 2864-2879.
The International Archives of the Photogrammetry, Remote Sensing and Spatial Information Sciences, Volume XL-7/W3, 2015 36th International Symposium on Remote Sensing of Environment, 11–15 May 2015, Berlin, Germany
This contribution has been peer-reviewed.