INTRODUCTION
Starvation is a serious deficiency of energy intake for a long period (Cahill 2006). During the food restriction, the glu
-cose level declines between 24 and 72 hours, resulting in
release of glucagon (Allison 1980). In these conditions, the body switches from carbohydrate to fat and protein usage to produce glucose and energy (McCray et al. 2004, Fuen
-tebella & Kerner 2009). Therefore, glucose is replaced with fatty acids and ketone bodies as the main energy source (Crook et al. 2001).
Refeeding syndrome is a group of metabolic and biochemi
-cal changes that can occur in various conditions, especially malnourished patients undergoing artificial refeeding (Per
-rault et al. 1997; Boateng et al. 2010). After refeeding, the body immediately shifts back to carbohydrate metabolism and the elevated blood glucose leads to increased insulin and decreased secretion of glucagon. Insulin stimulates
Starvation and refeeding in rats: effect on some parameters
of energy metabolism and electrolytes and changes of
hepatic tissue
1Fatemeh Namazi2*, Arash Omidi3
, Sajjad Abbasi4, Mina Afsar5
, Masumeh Honarmand5 and Saeed Nazifi5
ABSTRACT.- Namazi F., Omidi A., Abbasi S., Afsar M., Honarmand M. & Nazifi S. 2016. Starvation and refeeding in rats: effect on some parameters of energy metabo-lism and electrolytes and changes of hepatic tissue. Pesquisa Veterinária Brasileira 36(Supl.1):101-105. Department of Pathobiology, School of Veterinary Medicine, Shiraz
University, Shiraz, Iran. E-mail: [email protected]
Regarding the importance of starvation and refeeding and the occurrence of refeeding syndrome in various conditions, the present study was conducted to investigate the effects of refeeding on some parameters of energy metabolism and electrolytes and changes of hepatic tissue in male Wistar rats. Fifty-seven rats were divided into six groups, having 6 to 11 rats. Food was provided ad-libitum until three months and then the first group was considered without starvation (day 0). Other rats were fasted for two weeks. Group 2 was applied to a group immediately after starvation (day 14). Groups 3 to 6 were refed in days 16 till 22, respectively. At the end of each period, blood and tissue samples were taken and histopathological and serum analysis, including serum electrolytes (calcium, phosphorus, sodium, potassium), the energy parameters (glucose, insulin, cortisol) and the liver enzy
-mes (ALT, AST, ALP) were determined. Insulin decreased by starvation and then showed an increasing trend compared to starvation period, which the highest amount of this parame
-ter was observed eight days post-refeeding. Serum glucose level showed the opposite pat
-tern of insulin. Histopathological examination of the tissue sections revealed clear vacuoles after starvation and refeeding, in which the severity of lesions gradually decreased during refeeding. The cortisol level decreased by starvation and then increased during refeeding. Also, potassium and phosphorus concentrations declined by refeeding and the serum so
-dium and potassium levels were changed in the relatively opposite manner. The calcium level decreased by starvation and then increased during refeeding. These results could help recognize and remedy the refeeding syndrome.
INDEX TERMS: Refeeding, fasting, serum biochemical, histopathology, rat.
1
Received on January 25, 2016.
Accepted for publication on April 13, 2016.
2 Department of Pathobiology, School of Veterinary Medicine, Shiraz
University, Shiraz, Iran. *Corresponding author: [email protected] 3
Department of Animal Health Management, School of Veterinary Medi
-cine, Shiraz University, Shiraz, Iran.
4 School of Veterinary Medicine, Shiraz University, Shiraz, Iran.
5
the synthesis of protein, lipid and glycogen which requires some minerals and cofactors. Therefore, the concurrent in
-crease of insulin secretion causes an in-crease in the cellular uptake of glucose and some minerals, particularly magne
-sium, phosphorus and potas-sium, resulting in electrolytes imbalance (hypomagnesaemia, hypophosphatemia and hypokalemia) (Hearing 2004, Fuentebella & Kerner 2009). The clinical features of the refeeding syndrome take place as a consequence of the deficiency of these electrolytes and the rapid change in metabolic rate, which can put the vul
-nerable cases at risk of death.
In addition, carbohydrate metabolism changes greatly affect sodium and water balance and the carbohydrates of diet cause sudden decrease in renal excretion of sodium and water (Mehanna et al. 2008).
Hence, the present study was conducted to investiga
-te the effects of refeeding on some parame-ters associa-ted with energy metabolism and electrolytes and changes of hepatic tissue in male Wistar rats.
MATERIALS AND METHODS
Animal ethics. This experiment was accomplished under the appro
-val of the state committee on animal ethics, Shiraz University, Shi
-raz, Iran. Also, the recommendations of European Council Directive (86/609/EC) of November 24, 1986, regarding the standards in the protection of animals were used for experimental purposes.
Experimental Protocol. Fifty-seven male Wistar rats were
housed in stainless steel cages and allowed to adapt to the con
-ditions of the animal house for 14 days before the experiments. Animals were divided into six groups, having 6 to 11 rats. Food
was provided ad-libitum containing 19% protein, 4.3% fat, 5% fi
-ber, 4% ash and the metabolizable energy was 2.265 kcl/kg. The mean body weight of purchasing rats was 221.77±2.93 and they were weighed every 2 weeks.
After three months, the first group (G-1) was considered with
-out starvation (day 0). Other rats were fasted for two weeks with
access only to water. Group 2 (G-2) was applied to a group imme
-diately after starvation (day 14). Groups 3 to 6 (G-3 till G-6) were refed for two, four, six and eight days (Fig.1). At the end of each period, blood and tissue samples were taken.
Histopathological evaluation. Liver tissues were collected
from animals and fixed in 10% neutral buffered formalin, embed
-ded in paraffin, sectioned at 5 μm and stained with haematoxylin and eosin (H&E) for light microscopic examination.
Serum Biochemical Analyses. Blood samples were collected from the heart of the rats into vacutainers without anticoagulant, and serum was separated by centrifugation at 750 g for 15 min and stored in a freezer at -20°C until used.
Glucose was assayed by an enzymatic (glucose oxidase) colo
-rimetric method (ZistChem®, Tehran, Iran). Insulin was measured
by rat insulin ELISA kit (Cusabio®, China, specificity 100%, and
precision: intra-assay and inter-assay CV < 8% and 10%, respec
-tively). Cortisol was assayed using EIA method (Monobind. Corti
-sol EIA Assay Kit, Monobind Inc., USA).
Serum sodium and potassium were measured by flame pho
-tometric method (Buck Scientific - Model PFP-7 - Industrial Flame Photometer, Iran). Serum phosphorus and calcium were measured by ammonium molybdate and bromocresolphthalein
methods, respectively (Pars Azmoon kit, Pars Azmoon Co., Teh
-ran, Iran). All biochemical parameters including AST, ALT, ALP were measured by enzymatic methods and commercial kits (Pars
Azmoon Co., Tehran, Iran). All the enzyme activities were mea
-sured at 37°C and the results have been presented in units per
liter (Burtis & Ashwood 1994). Biochemical analyses were mea
-sured using a standard autoanalyser with veterinary software (Cobas-Mira, ABX-Diagnostics, Japan).
Statistical analysis. The results were expressed as mean ± standard deviation (SD). The data were analyzed statistically by one-way ANOVA with Tukey’s post-hoc test, using SPSS software, version 20. P<0.05 was considered as significant. The correlation between different parameters was analyzed by correlation test.
RESULTS Changes in body weight
Before starvation, the mean body weight of rats was 365.04±4.14g (approximately 40% increase in three mon
-ths). The minimum and maximum weight was 268 and 439g, respectively. After 2 weeks fasting, the mean body weight of rats decreased to 263.52±1.03 (about 28% de
-cline in 2 weeks). A significant difference was observed among the rats of groups 2 to 6 except G-5 and G-6 groups. The information related to body weight of rats and its in
-creasing trend after refeeding is shown in Figure 2.
Histopathological evaluation
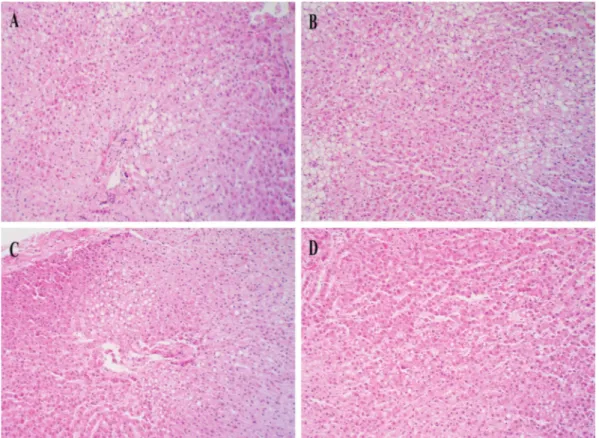
No lesions were observed in the tissue sections from the rats of G-1 group (without starvation), while the rats of G-2 group (after starvation) showed mild to moderate, clear va
-cuoles (Fig.3A).
The tissue sections of the G-3 group (2 days post-refee
-ding) revealed many clear vacuoles with different sizes in hepatocytes, representing stored lipid droplets (Fig.3B). In the rats of other refeeding groups (4, 6 and 8 days post-re
-feeding), tissue changes were accompanied by formation of mild, clear vacuoles in hepatocytes (Fig.3C,D), in which the severity of the lesion decreased by increasing the refeeding days.
Fig.1. The experimental protocol.
Serum biochemical analyses
The mean ± SD of parameters values, including gluco
-se, insulin, cortisol, Na+, K+, P, Ca2+, AST, ALT and ALP are presented in Table 1. Also, the correlation between glucose, insulin and electrolytes is presented in Table 2.
The glucose concentration in the G-6 group had signifi
-cant difference with the rats of G-2, G-4 and G-5 groups. In addition, a significant difference was observed between the rats of G-5 and G-1 groups. In all groups except G-3 group, insulin level had significant difference with the rats of G-1 group. The highest and lowest amounts of insulin were seen in the rats of G-6 and G-5 groups, respectively, which showed a significant difference with each other and also with others. Evaluation of cortisol level among different groups presented significant difference between the rats of G-2 and G-6 groups. There was no significant difference among other groups.
The amount of Na+ in the rats of G-3 group showed a
significant difference with G-1 and G-6 groups. This para
-meter increased during refeeding, but no significant diffe
-rence was seen among the various refed groups. The Ca2+
Fig.3. Rat livers of various groups. Clear vacuoles were observed in tissue sections, in which the severity of the lesion gradually decreased during refeeding. (A) At starvation; (B) 2 days post-refeeding; (C) 4 days post-refeeding; (D) 8 days post-refeeding.
Hematoxilin-eosin, 180x.
Table 1. The mean ± SD of parameters value of rats by starvation and refeeding
Groups Glucose Insulin Cortisol Na+ Ca2+ P K+ AST ALT ALP
(mg/dl) (µunits/ml) (µg/dl) (mmol/l) (mmol/l) (mg/dl) (mmol/l) (u/l) (u/l) (u/l)
G-1 159.48±5.72bc 42.30±0.81b 0.48±0.04ab 139.90±1.40a
1.45±0.22b 3.98±0.21a
4.87±0.08a
211.18±27.44a
82.82±12.69b 179.00±27.67b
G-2 184.47±8.82ac 32.25±1.65c 0.34±0.05b 135.75±4.51ab 1.08±0.16b 4.08±0.08a 5.10±0.12a 152.85±15.75a 70.69±11.07b 292.50±52.29ab
G-3 167.27±6.74ab 39.70±0.89b 0.48±0.03ab 103.70±7.52b 1.93±0.18ab 3.24±0.28ab 4.80±0.13a 206.60±15.02a 116.18±10.94ab 483.30±26.94a G-4 188.77±10.68ac 33.00±0.81c 0.42±0.03ab 126.50±9.38ab 2.02±0.20ab 3.36±0.30a
4.60±0.19ab 166.14±8.85a
116.67±11.71ab 523.22±80.68a G-5 203.99±15.02a
27.00±0.91d
0.47±0.04ab 128.55±9.66ab 1.09±0.16b 3.55±0.23a
5.01±0.12a
179.25±25.72a
119.69±5.95ab 425.11±53.36a G-6 124.41±8.55b 50.00±0.81a 0.57±0.05a 138.50±6.47a 3.38±0.68a 2.01±0.33b 4.13±0.12b 246.56±24.19a 142.15±15.98a 428.91±53.33a AST= Aspartate transaminase; ALT= Alanine transaminase; AlP= Alkaline phosphatase. Different letters indicate statistically significant differences (P<0.05).
Table 2. The correlation between glucose, insulin and electrolytes
Glucose Insulin K+ P Ca2+
(mg/dl) (µunits/ml) (mmol/l) (mg/dl) (mmol/l) Glucose (mg/dl) r= 1 r= -0.638 r= 0.517 r= 0.241NS r= -0.340
p= 0 p= 0.001 p=0.001 p= 0.08 p= 0.13
Insulin (µunits/ml) r= 1 r= - 0.465 r= - 0.414 r= 0.443
p= 0 p= 0.001 p= 0.002 p= 0.001
K+ (mmol/l) r= 1 r= 0.345 r= 0.249NS
p= 0 p= 0.012 p= 0.07
P (mg/dl) r= 1 r= -0.425
p= 0 p= 0.002
Ca2+ (mmol/l) r= 1
p= 0
level in the rats of G-6 group had significant difference with the rats of G-1, G- 2 and G-5 groups. There was no signi
-ficant difference among other groups. By refeeding, the phosphorus concentration decreased, which in the rats of G-6 group had statistically significant difference with all groups except G-3 group. Also, the K+ concentration decre
-ased by refeeding, which in the rats of G-6 group presented significant difference with all groups except G-4 group.
There was no significant difference in AST level in the sera of the rats. The ALT concentration in the G-6 group had statistically significant difference with the rats of G-1 and G-2 groups. Although this parameter increased during refeeding, no significant difference was seen among these groups. ALP concentration presented significant difference between the rats of G-1 group and refed rats (groups G-3 to G-6). The ALP level increased during refeeding; however, there was no significant difference among these groups.
DISCUSSION
Approximately 40% increase of mean body weight in three months and 28% decrease in 2 weeks fasting followed by a 23% increase in 8 days refeeding led to severe changes in different parameters.
In early starvation, blood glucose levels decline, resul
-ting in a decrease in insulin and an increase in glucagon le
-vels. Accordingly, the body switches the main energy course from carbohydrate to protein and fat (McCray et al. 2005). After refeeding, the absorbed glucose leads to increased blood glucose levels, which increase insulin secretion and this induces lowered serum glucose concentration. After a period of starvation, when the source of glucose is availa
-ble during refeeding, insulin as an anabolic hormone can suppress gluconeogenesis and activate lipogenesis. Also, it has been reported that insulin promoted the storage and synthesis of lipids, protein, and carbohydrate through the body (Saltiel & Kahn 2001).
In the present study, insulin level decreased after two weeks starvation and subsequently presented an incre
-asing trend in comparison with starvation period; the hi
-ghest amount of this parameter was observed eight days post-refeeding. Due to insulin action, serum glucose level showed the opposite pattern of insulin, the increased in
-sulin level of which during refeeding can explain the slight decrease of glucose in the rats.
Previous studies have reported that fasting and im
-paired glucose regulation can increase hepatic content of triacylglycerol and eventually result in the accumulation of lipid in the liver parenchyma (Lonardo et al. 2015, Marks et al. 2015). In the present experiment, tissue sections of rats revealed clear vacuoles, representing stored lipid droplets by starvation and also during refeeding. The severity of lesion gradually decreased by refeeding, which can result from removal of the exact cause (starvation) and the rege
-neration ability of the liver.
The cortisol level decreased after two weeks starvation and then increased during refeeding. In addition, it has been reported that fasting caused decreased cortisol level which increased significantly after refeeding (Jiménez & Morales 2007, Wassif et al. 2011).
As fasting continues the body attempts to conserve muscle and protein and various tissues such as muscles reduce the use of ketone bodies and their level increases. Therefore, this event stimulates the brain to use ketone bo
-dies as its energy source instead of glucose and the liver decreases the rate of gluconeogenesis. Furthermore, severe depletion of several intracellular minerals occurs, but their serum concentrations may remain normal (Mehanna et al. 2009). It has been established that insulin stimulates the absorption of some minerals such as potassium, magne
-sium and phosphate and also releases the sodium in potas
-sium exchange (Mehanna et al. 2009). The extent of these changes can be related to the time of fasting and period of refeeding and ranged from no serum mineral changes to slight increase or decline in their serum levels.
Potassium is involved in glucose metabolism and potas
-sium depletion caused by low potas-sium diet impairs in
-sulin secretion, which in turn leads to glucose intolerance (Obeid et al. 2014). Higher intake of potassium via diet is related to decreased risk of insulin resistance and meta
-bolic syndrome (Lee et al. 2013). During starvation, intra
-cellular potassium is depleted, while its serum concentra
-tion may remain normal. Upon refeeding, potassium enters into cells because of insulin secretion and consequently the serum concentration of this mineral reduces (Mehanna 2008, Obeid et al. 2014). In the present study, the potas
-sium level also decreased during refeeding and the serum sodium and potassium levels changed in a relatively op
-posite manner, which can be associated with Na-K ATPase symporter action.
Phosphorus is a vital mineral that is involved in various metabolic processes, especially that of glucose and ener
-gy (Haap et al. 2006, Lippi et al. 2009). Following feeding, low serum phosphate concentration is related to increased blood glucose level and decreased insulin sensitivity (Frie
-dman 2007). Decline in the serum phosphate concentra
-tion can take place as a result of insulin secre-tion (Obeid et al. 2014). In refeeding syndrome, total body phospha
-te depletion occurs. In addition, the insulin surge results in a markedly increased uptake and use of phosphate in the cells, inducing a deficiency in intracellular and extra
-cellular phosphorus. In this situation, even slight decline in serum phosphorus may cause wide dysfunction of the cellular processes (Mehanna et al. 2008). In this study, the phosphorus concentration also decreased in the rats of re
-feeding groups. In addition, the calcium level reduced by starvation and then elevated in the refed rats.
CONCLUSIONS
The present study showed that the refeeding causes effects on hepatic tissue, in some parameters associated with energy metabolism and in serum electrolytes.
Disorders caused by refeeding syndrome, especially electrolytes and fluid changes, can disrupt many body ac
-tivities.
It is likely that the more significant differences are obser
-ved by increased refeeding period.
Acknowledgments.- The authors would like to thank the Research Coun
-cil of Shiraz University and School of Veterinary Medicine, Shiraz Universi
-ty for financial and technical support of this study (Grant No. 71-GR-VT-5).
Conflict of interest statement.- The authors have no competing interests.
REFERENCES
Allison S.P. 1980. Effect of insulin on metabolic response to injury. JPEN 4(2):175-179.
Boateng A.A., Sriram K., Meguid M.M. & Crook M. 2010. Refeeding syn
-drome: treatment considerations based on collective analysis of litera
-ture case reports. Nutrition 26:156-167.
Burtis C.A. & Ashwood E.R. 1994. Textbook of Clinical Chemistry. 2nd ed. W.B. Saunders, Philadelphia, p.735-888.
Cahill G.F. Jr 2006. Fuel metabolism in starvation. Annu. Rev. Nutr. 26:1-22. Crook M.A., Hally V. & Panteli J.V. 2001. The importance of the refeeding
syndrome. Nutrition 17(7/8):632-637.
Friedman M.I. 2007. Obesity and the hepatic control of feeding behavior. Drug News. Perspect. 20:9.
Fuentebella J. & Kerner J.A. 2009. Refeeding syndrome. Pediatr. Clin. N. Am. 56:1201-1210.
Haap M., Heller E., Thamer C., Tschritter O., Stefan N. & Fritsche A. 2006. Association of serum phosphate levels with glucose tolerance, insulin sensitivity and insulin secretion in non-diabetic subjects. Eur. J. Clin. Nutr. 60:734-739.
Hearing S.D. 2004. Refeeding syndrome Is underdiagnosed and under
-treated, but treatable. Brit. Med. J. 328(17):908-909.
Jiménez A.P. & Morales A.E. 2007. Metabolic responses to short starvation and refeeding in Dicentrarchuslabrax Effect of dietary composition. Aquaculture 265:325-335.
Lee H., Lee J., Hwang S., Kim S., Chin H.J. & Han J.S. 2013. Potassium intake and the prevalence of metabolic syndrome: the Korea National Health and Nutrition Examintaion Survey 2008-2010. PloS One 8:1-9. Lippi G., Montagnana M., Salvagno G.L., Targher G. & Guidi G.C. 2009. Rela
-tionship between serum phosphate and cardiovascular risk factors in a large cohort of adult outpatients. Diabetes. Res. Clin. Pract. 84:3-5. Lonardo A., Ballestri S. & Marchesini G. 2015. Nonalcoholic fatty liver dis
-ease: A precursor of the metabolic syndrome. Digest. Liver Dis. 47(3): 181-190.
Marks K.A., Marvyn P.M. & Aristizabal Henao J.J. 2015. Fasting enriches liver triacylglycerol with n-3 polyunsaturated fatty acids: implications for understanding the adipose-liver axis in serum docosahexaenoic acid regulation. Genes Nutr. 10(6):1-14.
McCray S., Walker S. & Parrish C.R. 2004. Much ado about refeeding. Prac
-tical. Gastroenterology 28(12):26-44.
McCray S., Walker S. & Parrish C.R. 2005. Much ado about refeeding. Prac
-tical. Gastroenterology. 29(1):26-44.
Mehanna H.M., Nankivell P.C., Moledina J. & Travis J. 2009. Refeeding syn
-drome-awareness, prevention and management. Head Neck 1:4. Mehanna H.M., Moledina J. & Travis J. 2008. Refeeding syndrome: what it
is, and how to prevent and treat it. Brit. Med. J. 7659(336):1495. Obeid O.A., Hachem D.H. & Ayoub J.J. 2014. Refeeding and metabolic syn
-dromes: two sides of the same coin. Nutr. Diabetes 120:1-8.
Perrault M.M., Ostrop N.J. & Tierney M.G. 1997. Efficacy and safety ofintra
-venous phosphate replacement in critically ill patients. Ann. Pharmaco
-ther. 31:8-683.
Saltiel A.R. & Kahn C.R. 2001. Insulin signalling and the regulation of glu
-cose and lipid metabolism. Nature 414:799-806.