Received March 7, 2008 and accepted June 16, 2009. Corresponding author: reniusmello@hotmail.com
*Current address: Universidade Federal de Santa Maria, Santa Maria, RS.
Bionutritional efficiency of crossbred beef cattle finished on feedlot and
slaughtered at different body weights
Renius Mello1*, Augusto César de Queiroz2, Flávio Dutra de Resende3, Marcelo Henrique de Faria3, Douglas Sampaio Henrique2, Fabiana Maldonado3
1Programa de Pós-graduação em Zootecnia - UFV, Viçosa, MG. 2Universidade Federal de Viçosa, Viçosa, MG.
3APTA - Pólo Regional do Desenvolvimento Tecnológico dos Agronegócios da Alta Mogiana, Colina, SP.
ABSTRACT - The objective of this study was to assess the bionutritional efficiency of crossbred F1 Red Angus × Nellore (½ RA ½ N) and F1 Blonde D’Aquitaine × Nellore (½ BA ½ N) young bulls finished on feedlot and slaughtered at 480, 520 and 560 kg body weight. A completely randomized experimental design in a 2 × 3 (genetic group × slaughter weight) factorial arrangement with six replicates was used. The ½ BA ½ N young bulls showed higher kidney, pelvic and inguinal fat (KPIF, kg and % BW) and lower multivariate biological nutritional index (MBNI) and residual feed intake than ½ RA ½ N young bulls. The young bulls slaughtered at heavier weight had larger ribeye area (cm2), fat thickness over the 12-13th rib, fat thickness over the rump, KPIF (kg and % BW), dry matter intake (DMI, kg/d), net energy intake (MJ/d) and metabolizable protein intake (g/d), and MBNI compared to young bulls slaughtered at lighter weight. Furthermore, the ½ BA ½ N young bulls slaughtered at 480 kg had lower feed conversion than the others. On the other hand, the average daily weight gain (kg/d), DMI (% BW and g/BW0.75), feed efficiency and Kleiber ratio did not differ between genetic group, slaughter weight and genetic group versus slaughter weight interaction. Therefore, crossbred F1 Blonde D’Aquitaine × Nellore young bulls and animals slaughtered at lighter weights are more bionutritionally efficient in the finishing phase on feedlot.
Key Words: animal performance, feed efficiency, feed conversion, Kleiber ratio, multivariate biological nutritional index, residual feed intake
Eficiência bionutricional de bovinos mestiços terminados em confinamento
e abatidos com pesos distintos
RESUMO - Objetivou-se avaliar a eficiência bionutricional de tourinhos mestiços F1 Red Angus × Nelore (½ RA ½ N) e F1 Blonde D´Aquitane × Nelore (½ BA ½ N) terminados em confinamento e abatidos com 480, 520 e 560 kg de peso corporal. O delineamento experimental foi inteiramente casualizado em arranjo fatorial 2 × 3 (grupo genético × peso de abate) com seis repetições. Os tourinhos ½ BA ½ N tiveram maior gordura renal, pélvica e inguinal (GRPI, kg e % PV); e menor índice nutricional multivariado biológico (INMB) e consumo alimentar residual em comparação aos tourinhos ½ RA ½ N. Os tourinhos abatidos com maior peso apresentaram maior área de olho-de-lombo (cm2), espessura de gordura subcutânea, gordura de cobertura na garupa, GRPI (kg e % PV), consumo de matéria seca (CMS, kg/d), consumo de energia líquida (MJ/d) e proteína metabolizável (g/dia), e INMB em relação aos abatidos mais leves. Além disso, os tourinhos ½ BA ½ N abatidos com 480 kg tiveram a menor conversão alimentar. Por outro lado, o ganho médio diário de peso (kg/dia), o consumo de matéria seca (% PV e g/UTM), a eficiência alimentar e a relação de Kleiber não diferiram entre os grupos genéticos, os pesos de abate e a interação grupo genético versus peso de abate. Tourinhos F1 Blonde D’Aquitaine × Nelore e os animais abatidos mais leves são bionutricionalmente mais eficientes na fase de terminação em confinamento.
Palavras-chave: consumo alimentar residual, conversão alimentar, desempenho animal, eficiência alimentar, índice nutricional multivariado biológico, relação de Kleiber
ISSN 1806-9290 www.sbz.org.br
Introduction
Feedlot has been used worldwide as a technological alternative and a strategy to increase productivity and break seasonal production. However, the performance
and the nutritional efficiency of feedlot cattle are influenced, among several factors, by the genetic potential of the animals and management. Optimization of the slaughter end point, as for age, finishing grade, body weight or carcass weight, also exert direct effects
on the biological response of the animals (Berg & Butterfield, 1976).
Differences among breeds in production characteristics are important to enhance nutritional efficiency, carcass composition and meat quality (Wheeler et al., 2001). The Brazilian cattle herd is mainly composed by zebu cattle, either purebred or crossbred, with eminence of the Nellore breed, which deposits subcutaneous fat precociously in relation to weight, not to age, and does not present high marbling grade when compared to F1 Angus × Nelore (Berndt et al., 2001).
Breeding of Bos taurus taurus bulls with Bos taurus indicus cows has been used to obtain F1 crossbreds for heterozygote advantage and use of the generated benefits and breed complementation (Barbosa, 2000; Wheeler et al., 2001), so the animals can be slaughtered younger and heavier. However, literature data reports that genotype evaluation is harmed when the slaughter end point is defined by a fixed weight, because the expression of the differences between breeds is limited (Euclides Filho et al., 1997).
The slaughter weight of the animals represents a crucial point of the commercial efficiency of rural establishments and slaughterhouses, because cattle commercialization is based on payment for hot carcass weight. Slaughter weight also has great influence on cattle performance, intake and feed efficiency (Costa et al., 2002; Arboitte et al., 2004), as the growth rate of different tissues has different thrusts in different phases of the life of the animal. Therefore, it becomes interesting to study the slaughter weight of different genetic groups to ally the best biological responses and enhance animal science parameters.
Therefore, the objective of this study was to evaluate bionutritional efficiency of half bred cattle F1 Bos taurus taurus × Bos taurus indicus finished in feedlot and slaughtered at different weights.
Material and Methods
The feedlot was conducted at the Agência Paulista de Tecnologia dos Agronegócios (APTA), Colina, São Paulo, Brazil; the animals were slaughtered at the Minerva®
slaughterhouse, Barretos, São Paulo, Brazil; and the chemical analysis of the diet was performed at the Instituto de Zootecnia, Nova Odessa, São Paulo, Brazil.
The region where the animals were confined is located physiographically in the Northern region of São Paulo State, at 602 m altitude, parallel of 20° 42' 57" South latitude and meridian of 48° 34' 23" West longitude from
Greenwich. According to the Köppen classification, the climate is Aw (wet tropical), with a dry season from April to September and a rainy season from October to March, being the monthly mean of the maximum daily temperature at the hottest month higher than 22°C and at the coldest month higher than 18°C.
Thirty six half bred young bulls were used, eighteen F1 Red Angus × Nelore (½ RA ½ N) and eighteen F1 Blonde D’Aquitaine × Nelore (½ BA ½ N), average initial age of 20 months and 447.7 ± 5.8 kg initial live weight for the F1 Red Angus and 444.3 ± 6.5 kg for the F1 Blonde D´Aquitane. Sources of variation consisted by two genetic groups (GG): ½ RA ½ N and ½ BA ½ N; and by three slaughter weights (SW): 480, 520 and 560 kg of body weight. A completely randomized experimental design in a 2 × 3 (two genetic groups × three slaughter weights) factorial arrangement with six replicates was used, according to the statistical model:
where Yijk = observed value of i-th genetic group,
j-th slaughter weight and k-th replicate; µ = overall mean of response variable; αi = effect of i-th genetic group;
βj = effect of j-th slaughter weight; αβij = effect of interaction between the i-th genetic group and the j-th slaughter weight; b1 = angular coefficient of the line Yijk
as a function of the initial live weight (ILW) at fasting;
Xijk = initial live weight of the k-th animal under the i-th genetic group and j-th slaughter weight; X = overall mean of initial live weight of the animals; εijk = random effect associated to observation Yijk, presuming
( )
20σ
ε
~
N ,iid
ijk .
The animals used in this study were weaned at seven to eight months of age and kept on Panicum maximum CV Tanzânia pasture, fertilized with 250 kg N/ha, under a rotational grazing system. Before the beginning of the experiment, the animals remained for two months on Braquiária pasture under a continuous grazing system. After that, they were housed in individual 12 m2 stalls with
a cement floor, covered feed trough, automatic drinking trough and submitted to a period of 21 days for adaptation to the diet, stalls and management.
The duration of the experimental period was defined by the time needed for the animals to gain established slaughter weights. In order to control the evolution of weight gain, the experimental period was subdivided into periods of 21 to 28 days when the animals were weighed after 18 hours fasting.
the voluntary intake. The experimental diet was formulated according to NRC (1996) for the maintenance requirements and gain of 1.3 kg/day of a steer with 420 kg body weight (Table 1).
Twice a week, representative samples of the leftovers from the offered feed were collected and mixed, creating compound samples for each treatment; and for the offered feed, samples were collected at each evaluation period. Samples of feed and roughage leftovers were dried in a laboratory oven with forced air circulation at 55 ± 5ºC until constant weight. Pre-dried samples and concentrate components were ground in a 1 mm sieve, using a stationary Wiley mill and then submitted to laboratorial analysis in triplicates.
Laboratorial analyses were executed according to analytical proceedings described by Silva & Queiroz (2002).
The ingredient composition of the offered diet (Table 2), observed voluntary intake, average weight and average daily weight gain of the animals were used as entries (inputs) in the mathematical model developed by Henrique (2007) to evaluate and diagnose the offered diet.
The animals were slaughtered accordingly to the Brazilian Sanitary Surveillance Guidelines (RIISPOA: Regulamento de Inspeção Industrial e Sanitária de Produtos de Origem Animal) and followed the normal flux of the slaughterhouse. Kidney, pelvic and inguinal fats (KPIF) were removed and weighted at the slaughter line during carcass cleaning (toilette). After slaughter, half-carcasses were washed and taken to cold chamber (Tinitial = 5 ± 2°C; Tultimate = 0 ± 2°C) for cooling through 24 hours. After cooling, the left side half-carcasses were cut in the dorsal-lumbar region between 12th and 13th ribs to evaluate the transversal area (REA) and the subcutaneous fat thickness (SFT) of the Longissimus dorsi muscle (LM). REA (cm2) was determined using plastic blade with checkered grid specially designed for this procedure, while the SFT (mm) was calculated by the arithmetic mean of three measurements taken with a pachymeter. During deboning, the fat cover of the hind region (RUMP, mm), between ileum and ischium and upon Biceps femoris
muscle (BF) were measured with a pachymeter.
The biological efficiency was evaluated by feed conversion (FC), feed efficiency (FE), multivariate biological nutritional index (MBNI), Kleiber ratio (KR) and
Ingredient P r o p o r t i o n
(% DM)
Roughage (43.26)
Sugar cane (Saccharum officinarum L.) 43.26
Concentrate (56.74)
Citrus pulp 33.29
Cottonseed meal 22.10
Urea 0 . 7 5
Mineral mixture1 0 . 6 0
1 Composition per kg: Ca - 130 g; P - 80 g (90% minimum solubility in 2%
citric acid ); S - 10 g; Na - 140 g; Cu - 1600 mg; Mn - 1500 mg; Zn - 5000 mg; I - 150 mg; Co - 100 mg; Se - 30 mg; F - 800 mg (maximum).
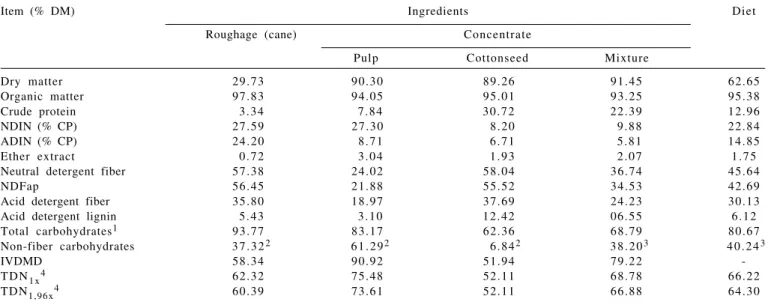
Table 1 - Composition of ingredients of the experimental diet (%DM)
NDIN = neutral detergent insoluble nitrogen; ADIN = acid detergent insoluble nitrogen; NDFap = neutral detergent fiber corrected to ash and protein; IVDMD = in vitro dry matter digestibility; TDN = total digestible nutrients estimated at maintenance level (1x) and gain (1.96x).
1TC = OM – (CP + EE). 2NFC = TC – NDFap. 3Hall (2000). 4NRC (2001).
Item (% DM) Ingredients Diet
Roughage (cane) Concentrate
Pulp Cottonseed Mixture
Dry matter 29.73 90.30 89.26 91.45 62.65
Organic matter 97.83 94.05 95.01 93.25 95.38
Crude protein 3 . 3 4 7 . 8 4 3 0 . 7 2 2 2 . 3 9 1 2 . 9 6
NDIN (% CP) 2 7 . 5 9 2 7 . 3 0 8 . 2 0 9 . 8 8 2 2 . 8 4
ADIN (% CP) 2 4 . 2 0 8 . 7 1 6 . 7 1 5 . 8 1 1 4 . 8 5
Ether extract 0 . 7 2 3 . 0 4 1 . 9 3 2 . 0 7 1 . 7 5
Neutral detergent fiber 57.38 24.02 58.04 36.74 45.64
NDFap 56.45 21.88 55.52 34.53 42.69
Acid detergent fiber 35.80 18.97 37.69 24.23 30.13
Acid detergent lignin 5 . 4 3 3 . 1 0 1 2 . 4 2 06 . 5 5 6 . 1 2
Total carbohydrates1 93.77 83.17 62.36 68.79 80.67
Non-fiber carbohydrates 3 7 . 3 22 6 1 . 2 92 6 . 8 42 3 8 . 2 03 4 0 . 2 43
IVDMD 58.34 90.92 51.94 79.22
-T D N1 x4 62.32 75.48 52.11 68.78 66.22
TDN1,96x4 60.39 73.61 52.11 66.88 64.30
residual feed intake (RFI). Feed conversion and feed efficiency were calculated by the nonlinear combination between random normal continuous variables and correlated, as follows:
1 ; > = FC y x FC ijk ijk 1 0
; < <
= FE x y FE ijk ijk , , 1 , , 1 ; , ,
1 ∀ = ∀ =
=
∀ i !GG j ! SW and k ! ri
(
replicates)
;soxijk >yijk >0where, xijk and yijk are, respectively, voluntary dry matter intake (DMI, kg/day) and average daily weight gain (ADG, kg/day) of k-th replicate, in i-th genetic group and
j-th slaughter weight.
Multivariate analysis of variance (MANOVA) procedure was used to calculate the multivariate biological nutritional index (Johnson & Wichern, 1998; Khattree & Naik, 1999; Khattree & Naik, 2000) and complemented with the Fisher linear discriminant function (FLDF) or first canonical variable (Mardia et al., 1997). Hence, the variables: weight gain (kg/d) and dry matter intake (kg/d) were submitted to MANOVA in a completely randomized design, disregarding the factorial arrangement, according to the statistical model:
ijk ik k ijk
Y =µ +α +ε
where Yijk = observed value of k-th variable, under i-th treatment of the j-threplicate; µk = overall mean of the
k-th variable; αik = effect of the
i
-th treatment at thek-th variable; and εijk = random effects associated to o b s e r v a t i o n Yi j k a s s u m i n g n o r m a l d i s t r i b u t i o n , independent and identically distributed - NIID, (0,α2);
i = 1,2,…, 6; j = 1,2,…, 6 and k = 1,2.
Eigenvalues were calculated using MANOVA and the characteristic roots of the equation (Harris, 1975) were obtained by:
where, E-1 = common inverse of matrix of the residual sum of squares and products; H = matrix of the sum of squares and of the products related to treatments; λ1 and λ2 = eigenvalues of matrix E-1H; and I = identity matrix of order
p = 2.
The non-normalized eigenvector associated to the higher eigenvalue was then estimated by solving the system of equations:
where λ1 = highest eigenvalue; v = non-normalized eigenvector associated to the highest eigenvalue; a
and b = canonical coefficients; and E-1, H and I = as defined previously.
The eigenvector was normalized by solving the linear system, according to the restriction:
[
]
1' ' ' ' 1 ~ ' ~ = ⇒ = b a n E b a n E e e " " where, ~
" = normalized eigenvector associated to the highest
eigenvalue; '
~
" = transposed of the normalized eigenvector;
E = matrix of the sum of squares and the residual products;
ne = number of degrees of freedom of the residue; a´ and
b´ = canonical coefficients.
The Fischer linear discriminating function (FLDF) or first canonical variable (CV1), was calculated and defined by:
Z = a´Y + b´X
where, Z = the Fischer linear discriminating function or first canonical variable; Y = animal transformation (ADG, kg/d);
X = feed intake (DMI, kg/d); a´ and b´ as previously defined. The values of this function were called multivariate biological nutritional index – MBNI (Guidoni, 1994) or bionutritional efficiency– BNE (Euclides Filho et al., 2001; Detmann et al., 2005).
The Kleiber ratio - KR (Kleiber, 1936) was calculated by the following formula:
ijk ijk AMLW
y KR=
(replicates) r k and SW j GG
i=1,!, ; ∀ =1,!, ∀ =1,!, i
∀
where, AMLWijk = average metabolic live weight (ALW0.75) of k-th repetition; in i-th genetic group and j-th slaughter weight; and yijk = as defined previously.
Residual feed intake – RFI (Koch et al., 1963) was obtained though multiple linear regression according to the following statistical model:
Yijk = β0 + β1Xlij + β2X2ij + εijk
where, Yijk = voluntary dry matter intake (DMI, kg/d) of
k-th replication, in i-thgenetic group and j-th slaughter weight; β0 = intercept or regression constant; β1 and β2 = regression coefficients; Xlij = average daily weight gain (ADG, kg/d) in
i
-th genetic group and j-th slaughter weight; X2ij = average metabolic live weight (AMLW, kg0,75) in i-th genetic group and j-thslaughter weight; εijk = error, representing the residual feed intake (RFI) ofijk observation, presuming . Parameters of
the considered model were estimated by the REG procedure from SAS®.
analysis of variance using the GLM procedure from SAS®, the means were adjusted by the ordinary least squares method by the LSMEANS (Least Squares Means) statement and compared by Tukey test at 5% significance level.
The probability value of the genetic groups was enough to detect differences between their means. Furthermore, regardless to the significance of the fixed effects, a polynomial regression analysis was performed for each genetic group to investigate alterations in the dependent variables as a function of SW. The coefficient of determination (r2) was expressed in relation to the treatments source (regression + lack of fit). In addition, a simple correlation analysis amongst studied variables was performed.
Because the subcutaneous fat thickness variable did not present normal distribution and the kidney, pelvic and
inguinal fat, feed conversion, feed efficiency and the Kleiber ratio variables presented heteroscedasticity; they were analyzed by the Generalized Linear Models method using GENMOD procedure from SAS®, presuming gamma distribution and logarithmic link function.
Statistical analyses were performed with SAS® System for Windows™ (SAS, 2002) software.
Results and Discussion
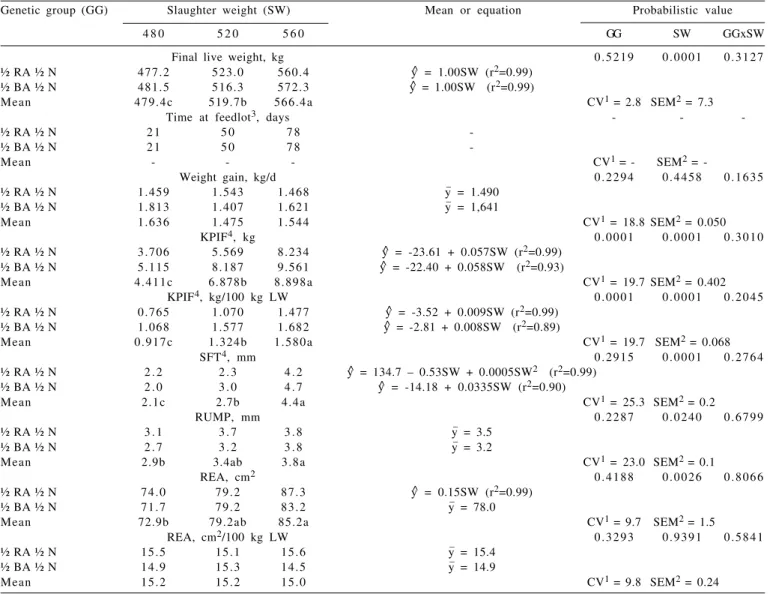
Final live weight (FLW) did not differ (P>0.05) between genetic groups, but it did (P<0.05) between slaughter weights (Table 3) that were previously established. Angular coefficients of regression of final live weight as a function of slaughter weight did not differ (P>0.05) from
Genetic group (GG) Slaughter weight (SW) Mean or equation Probabilistic value
4 8 0 5 2 0 5 6 0 GG SW GGxSW
Final live weight, kg 0 . 5 2 1 9 0 . 0 0 0 1 0 . 3 1 2 7
½ RA ½ N 477.2 523.0 560.4 y^ = 1.00SW (r2=0.99)
½ BA ½ N 481.5 516.3 572.3 y^ = 1.00SW (r2=0.99)
Mean 4 7 9 . 4 c 519.7b 5 6 6 . 4 a CV1 = 2.8 SEM2 = 7.3
Time at feedlot3, days - -
-½ RA -½ N 2 1 5 0 7 8
-½ BA -½ N 2 1 5 0 7 8
-Mean - - - CV1 = - SEM2 =
-Weight gain, kg/d 0 . 2 2 9 4 0 . 4 4 5 8 0 . 1 6 3 5
½ RA ½ N 1.459 1.543 1.468 y_ = 1.490
½ BA ½ N 1.813 1.407 1.621 y_ = 1,641
Mean 1.636 1.475 1.544 CV1 = 18.8 SEM2 = 0.050
KPIF4, kg 0 . 0 0 0 1 0 . 0 0 0 1 0 . 3 0 1 0
½ RA ½ N 3.706 5.569 8.234 y^ = -23.61 + 0.057SW (r2=0.99)
½ BA ½ N 5.115 8.187 9.561 y^ = -22.40 + 0.058SW (r2=0.93)
Mean 4 . 4 1 1 c 6.878b 8 . 8 9 8 a CV1 = 19.7 SEM2 = 0.402
KPIF4, kg/100 kg LW 0 . 0 0 0 1 0 . 0 0 0 1 0 . 2 0 4 5
½ RA ½ N 0.765 1.070 1.477 y^ = -3.52 + 0.009SW (r2=0.99)
½ BA ½ N 1.068 1.577 1.682 y^ = -2.81 + 0.008SW (r2=0.89)
Mean 0 . 9 1 7 c 1.324b 1 . 5 8 0 a CV1 = 19.7 SEM2 = 0.068
SFT4, mm 0 . 2 9 1 5 0 . 0 0 0 1 0 . 2 7 6 4
½ RA ½ N 2 . 2 2 . 3 4 . 2 y^ = 134.7 – 0.53SW + 0.0005SW2 (r2=0.99)
½ BA ½ N 2 . 0 3 . 0 4 . 7 y^ = -14.18 + 0.0335SW (r2=0.90)
Mean 2.1c 2.7b 4.4a CV1 = 25.3 SEM2 = 0.2
RUMP, mm 0 . 2 2 8 7 0 . 0 2 4 0 0 . 6 7 9 9
½ RA ½ N 3 . 1 3 . 7 3 . 8 y_ = 3.5
½ BA ½ N 2 . 7 3 . 2 3 . 8 y_ = 3.2
Mean 2.9b 3.4ab 3.8a CV1 = 23.0 SEM2 = 0.1
REA, cm2 0 . 4 1 8 8 0 . 0 0 2 6 0 . 8 0 6 6
½ RA ½ N 7 4 . 0 7 9 . 2 8 7 . 3 y^ = 0.15SW (r2=0.99)
½ BA ½ N 7 1 . 7 7 9 . 2 8 3 . 2 y_ = 78.0
Mean 72.9b 79.2ab 85.2a CV1 = 9.7 SEM2 = 1.5
REA, cm2/100 kg LW 0 . 3 2 9 3 0 . 9 3 9 1 0 . 5 8 4 1
½ RA ½ N 1 5 . 5 1 5 . 1 1 5 . 6 y_ = 15.4
½ BA ½ N 1 4 . 9 1 5 . 3 1 4 . 5 y_ = 14.9
Mean 1 5 . 2 1 5 . 2 1 5 . 0 CV1 = 9.8 SEM2 = 0.24
KPIF = kidney, pelvic and inguinal fat; SFT = subcutaneous fat thickness; RUMP = rump fat cover; REA = rib-eye area. Means with different letters differ (P<0.05) between slaughter weights by Tukey test.
1CV (%) = coefficient of variation; 2SEM = standard error of the mean; 3Not statistically analyzed; 4Pr > χ2 = probabilistic value by the likelihood ratio test with rapprochement
by chi-square statistical
one (1.0), proving that the control of slaughter weights was effective. The permanence period in feedlot (PF) was not predetermined (Table 3) but it was a consequence of the established slaughter weights. The feedlot period for the animals to reach 480 kg was short, as a consequence of the high initial weight, since at the beginning of the confinement the animals were at approximately 80% of the final established weight. Similar behavior was observed by Arboitte et al. (2004) in a finishing feedlot with 5/8 Nelore 3/8 Charolais young bulls slaughtered at 425, 467 and 510 kg body weight. Nevertheless, short periods of feeding in feedlot are economically important (Mello et al., 2009), because they represent less waste with energy intake for maintenance, higher rotation of the animals and more working capital once carcasses meet the minimal requirements recommended by the slaughterhouses.
There was no effect (P>0.05) of genetic group, slaughter weight and their interaction on the average daily weight gain (ADG) of the animals (Table 3). A possible explanation for the absence of differences in weight gain in the genetic groups may be a probable similarity of the inheritable cytoplasmic mitochondrial deoxyribonucleic acid (DNA) from the same maternal lineage of both genetic groups (Nellore), which is intimately associated to the productive characteristics of beef cattle. Nevertheless, F1 Blonde D´Aquitane obtained an average gain rate 8.3% higher than F1 Red Angus. Still, the animals slaughtered at 560 kg had a gain rate on average 5.6% lower than those slaughtered at 480 kg and 4.7% higher than those slaughtered at 520 kg, suggesting that the animals were still at the growth stage.
The F1 Blonde D´Aquitane young bulls had higher (P<0.05) amounts of kidney, pelvic and inguinal fat (KPIF), as absolute (kg) or relative to body weight (kg/100 kg LW), and the amount deposited increased (P<0.05) as the slaughter weight rised (Table 3). The absolute rate of deposition of kidney, pelvic and inguinal fat (angular coefficient of the equation) was slightly higher for the F1 Blonde D´Aquitane (Table 3), probably due to the higher impetus of growth of the continental European breeds (large size breeds) compared to British European breeds (small size breeds). On the other hand, the relative rate of KPIF deposition (angular coefficient of the equation) was slightly higher for F1 Red Angus (Table 3), justified by the early maturity genetic groups (British breeds) that present higher fat content in gain compared to late maturity genetic groups (continental breeds) at equal weights (Garret et al., 1959). Because of this, small size
breeds generally present lower growth impetus and higher energy requirements for gain than large size breeds.
The fat cover in the dorsal-lumbar region between 12th and 13th ribs (SFT) and the fat cover in the hind region over the rump (RUMP) presented similar behavior. In both places, fat thickness increased (P<0.05) as slaughter weight rised (Table 3), due to the period of feedlot. Nevertheless, the animals slaughtered at 480 and 520 kg did not achieve the minimum finishing level recommended by the slaughterhouses. The subcutaneous fat thickness regression as a function of the fat cover in the rump considering that the intercept did not differ (P>0.05) from zero, generated the following equation: SFT = 0.90 × RUMP (r2 = 0.90). Therefore, more fat deposition was observed over the rump than over the rib-eye. These results corroborated with Tait et al. (2001), who observed that the fat deposited in the dorsal-lumbar region was less than at the hind region until it reaches 4 to 5 mm in thickness, then a greater fat thickness is expected in the dorsal-lumbar region than in the hind region. This happens because fat deposition occurs, at first, in the hind and front quarters, growing toward the spine and down to the lower region of the ribs (Berg & Butterfield, 1976).
The subcutaneous fat thickness and fat cover over rump accumulation did not differ (P>0.05) between genetic groups (Table 3). Although early maturity genetic groups deposit more fat at gain, late maturity genetic groups compensate such differences with higher growth impetus. Therefore, the external fat deposited in animals in the different genetic groups was equal. Additionally, little external fat was deposited (SFT and RUMP) even at higher weights, because the animals were not castrated, so muscle growth prevailed upon fat deposition.
The rib-eye area (REA) did not differ (P>0.05) between genetic groups, but it increased (P<0.05) approximately 0.15 cm2/kg weight gain (Table 3), suggesting that the animals slaughtered at heavy weights had more muscular proportion than the ones slaughtered at light weights. But the relative rib-eye area (cm2/100 kg BW) did not differ (P>0.05) between sources of variation, inferring that the muscular gain rate was not affected by genetic group, slaughter weight, or their interaction.
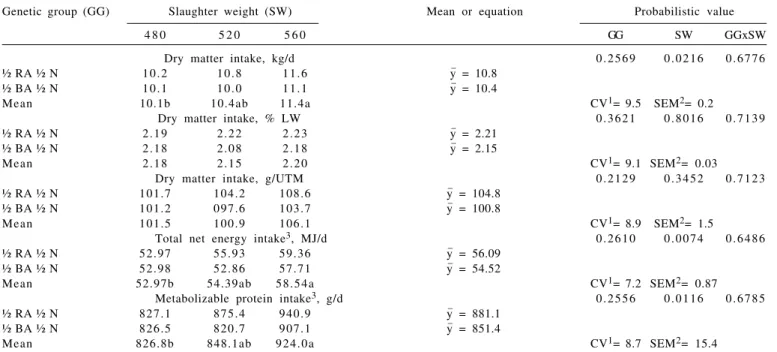
metabolizable protein intake (MPI, g/day) increased (P>0.05) as slaughter weight increased (Table 4), probably due to a higher energy and protein requirement for maintenance of heavier animals (NRC,1996).
Observed data of dry matter intake (DMI), nutritional composition of diet and body weight gain were used as entries (inputs) in the mathematical model developed by Henrique (2007) for nutritional evaluation of the offered diet. From the analyses of the obtained answers (outputs) it was verified that voluntary intake was maximum and defined by energy satiety, because the ruminal fiber mass (on average 3.431 g/kg body weight) was below the maximum capacity of fiber retention in the rumen (on average 9.889 g/kg body weight), suggesting that there was no effect of fiber mass fulfillment of rumen. But Table 6 shows the correlation between dry matter intake (DMI) and average weight gain (ADG) that was of low magnitude (Pearson coefficient) or not significant (Spearman coefficient). Hence, it can be inferred that the animals may not have fully expressed their potential for gain and some nutrient of the diet, probably the protein, may have limited their weight gain, because most of the animals had positive energy balance and negative protein balance, as shown in Figure 1. Furthermore, the intercepts of the regression equations of energy and protein balance, adjusted as a function of their weight gains (ADG), showed that the
offered diet had enough energy for 1.743 kg/d gain and enough protein for 1.324 kg/d gain.
Analysis of the output generated by the mathematical model described by Henrique (2007) shows that the average peptide balance (PEPBAL) was 11.9 g/d, while the average ruminal nitrogen balance (RNB) was -5.1 g/d. Therefore, as bacteria that degrade non-fiber carbohydrates (NFC) use preferably aminoacids and peptides as N source and bacteria that degrade fiber carbohydrates (FC) use only ammonia as N source (Russel et al., 1992; Fox et al., 2004), it can be inferred that there was an inhibition of celulolitic microbian growth, that may have reduced the digestion of the dietary fiber and consequently have limited the animal performance.
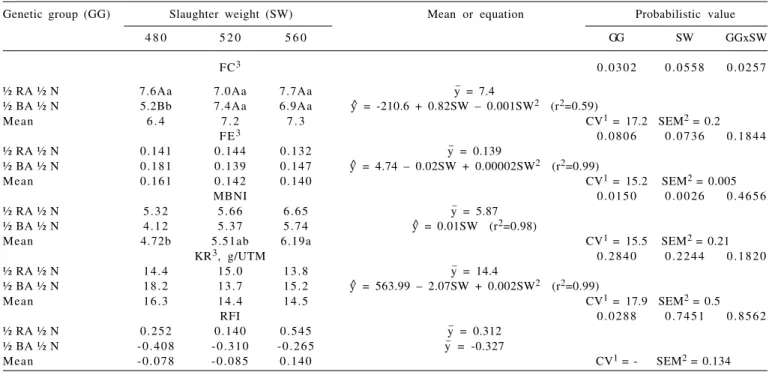
Regarded to biological efficiency indexes (Table 5), F1 Blonde D’Aquitane young bulls slaughtered at 480 kg had better (P<0.05) feed conversion (FC) and then, consumed less per kg weight gain. Similarly, F1 Blonde D’Aquitane bulls had lower (P<0.05) feed conversion (better) and feed conversion tended (P<0.06) to worsen (higher value) in animals slaughtered at heavier weights. Feed efficiency (FE) did not differ (P>0.05) between treatments (Table 5), but the F1 Blonde D’Aquitane young bulls tended (P<0.09) to be more efficient because they gained more weight per kg of dry matter consumed and the animals slaughtered heavier tended (P<0.08) to be less efficient, gaining less
Genetic group (GG) Slaughter weight (SW) Mean or equation Probabilistic value
4 8 0 5 2 0 5 6 0 GG SW GGxSW
Dry matter intake, kg/d 0 . 2 5 6 9 0 . 0 2 1 6 0 . 6 7 7 6
½ RA ½ N 1 0 . 2 1 0 . 8 1 1 . 6 y_ = 10.8
½ BA ½ N 1 0 . 1 1 0 . 0 1 1 . 1 y_ = 10.4
Mean 10.1b 10.4ab 11.4a CV1= 9.5 SEM2= 0.2
Dry matter intake, % LW 0 . 3 6 2 1 0 . 8 0 1 6 0 . 7 1 3 9
½ RA ½ N 2 . 1 9 2 . 2 2 2 . 2 3 y_ = 2.21
½ BA ½ N 2 . 1 8 2 . 0 8 2 . 1 8 y_ = 2.15
Mean 2 . 1 8 2 . 1 5 2 . 2 0 CV1= 9.1 SEM2= 0.03
Dry matter intake, g/UTM 0 . 2 1 2 9 0 . 3 4 5 2 0 . 7 1 2 3
½ RA ½ N 101.7 104.2 108.6 y_ = 104.8
½ BA ½ N 101.2 0 97.6 103.7 y_ = 100.8
Mean 101.5 100.9 106.1 CV1= 8.9 SEM2= 1.5
Total net energy intake3, MJ/d 0 . 2 6 1 0 0 . 0 0 7 4 0 . 6 4 8 6
½ RA ½ N 52.97 55.93 59.36 y_ = 56.09
½ BA ½ N 52.98 52.86 57.71 y_ = 54.52
Mean 52.97b 54.39ab 5 8 . 5 4 a CV1= 7.2 SEM2= 0.87
Metabolizable protein intake3, g/d 0 . 2 5 5 6 0 . 0 1 1 6 0 . 6 7 8 5
½ RA ½ N 827.1 875.4 940.9 y_ = 881.1
½ BA ½ N 826.5 820.7 907.1 y_ = 851.4
Mean 826.8b 848.1ab 9 2 4 . 0 a CV1= 8.7 SEM2= 15.4
Means with different letters differ (P<0.05) between slaughter weights by Tukey test.
1 CV (%) = coefficient of variation. 2 SEM = standard error of the mean. 3 Estimated according to Henrique (2007).
weight per kg of dry matter consumed. These results can be explained by the higher impetus of muscular growth and the lower energy requirements per kg weight gain of late maturing genetic groups (large size breed).
The fact that the null hypothesis was not rejected in the univariate analysis does not mean that it must be accepted, because in multivariate analysis this same hypothesis may be rejected. The multivariate biological
nutritional index (MBNI) is relevant because it meets presumptions of the Gauss-Markov ordinary linear normal model, uses the gathered information of involved variables and has a discriminatory feature (Guidoni, 1994). Hence, MBNI was defined from the following equation: MBNI = (-3.25 × AWG) + (0.99 × DMI). In this study, therefore, the animal would be worst (less efficient) when its multivariate biological nutritional index was higher
FC (kg DM consumed/kg of weight gain) = feed conversion; FE (kg weight gain/kg DM consumed) = feed efficiency; MBNI (dimensionless)= multivariate biological nutritional index; KR (g weight gain/kg0.75 of average live weight) = Kleiber ratio; RFI (dimensionless) = residual feed intake.
Means with different letters differ (P<0.05) between slaughter weights by Tukey test.
1CV (%) = coefficient of variation. 2SEM = standard error of the mean.
3Pr > χ2 = probabilistic value through the likelihood ratio test with rapprochement by chi-square statistical.
Genetic group (GG) Slaughter weight (SW) Mean or equation Probabilistic value
4 8 0 5 2 0 5 6 0 GG SW GGxSW
FC3 0 . 0 3 0 2 0 . 0 5 5 8 0 . 0 2 5 7
½ RA ½ N 7.6Aa 7.0Aa 7.7Aa y_ = 7.4
½ BA ½ N 5.2Bb 7.4Aa 6.9Aa y^ = -210.6 + 0.82SW – 0.001SW2 (r2=0.59)
Mean 6 . 4 7 . 2 7 . 3 CV1 = 17.2 SEM2 = 0.2
F E3 0 . 0 8 0 6 0 . 0 7 3 6 0 . 1 8 4 4
½ RA ½ N 0.141 0.144 0.132 y_ = 0.139
½ BA ½ N 0.181 0.139 0.147 y^ = 4.74 – 0.02SW + 0.00002SW2 (r2=0.99)
Mean 0.161 0.142 0.140 CV1 = 15.2 SEM2 = 0.005
MBNI 0 . 0 1 5 0 0 . 0 0 2 6 0 . 4 6 5 6
½ RA ½ N 5 . 3 2 5 . 6 6 6 . 6 5 y_ = 5.87
½ BA ½ N 4 . 1 2 5 . 3 7 5 . 7 4 y^ = 0.01SW (r2=0.98)
Mean 4.72b 5.51ab 6.19a CV1 = 15.5 SEM2 = 0.21
KR3, g/UTM 0 . 2 8 4 0 0 . 2 2 4 4 0 . 1 8 2 0
½ RA ½ N 1 4 . 4 1 5 . 0 1 3 . 8 y_ = 14.4
½ BA ½ N 1 8 . 2 1 3 . 7 1 5 . 2 y^ = 563.99 – 2.07SW + 0.002SW2 (r2=0.99)
Mean 1 6 . 3 1 4 . 4 1 4 . 5 CV1 = 17.9 SEM2 = 0.5
RFI 0 . 0 2 8 8 0 . 7 4 5 1 0 . 8 5 6 2
½ RA ½ N 0.252 0.140 0.545 y_ = 0.312
½ BA ½ N - 0 . 4 0 8 - 0 . 3 1 0 - 0 . 2 6 5 y_ = -0.327
Mean - 0 . 0 7 8 - 0 . 0 8 5 0 . 1 4 0 CV1 = - SEM2 = 0.134
Table 5 - Biological efficiency indexes of F1 Red Angus (RA) or Blonde D’Aquitaine (BA) versus Nelore (N) young bulls finished on feedlot and slaughtered at different body weights
because the canonical coefficient associated to gain was negative and the canonical coefficient associated to intake was positive. It is important to notice that the solution admits opposite signal.
The multivariate biological nutritional index (MBNI) confirmed the observed tendencies discussed for feed conversion (FC) and feed efficiency (FE). Thus, the F1 Blonde D´Aquitane young bulls and the animals slaughtered at light weight were significantly more efficient compared to the F1 Red Angus young bulls and the animals slaughtered at heavy weight (Table 5). Hence, when animals of different body sizes are slaughtered at equivalent weights, large size breed animals will be more efficient (Murdoch et al., 2005), because they deposit less fat in gain. However, when slaughter aims for the production of carcasses of similar finishing rate, it may be inferred that the animals of small size breeds will be more efficient, because effectively they are more precocious diluting maintenance requirements (Lanna & Packer, 1998).
On the contrary, the selection of more efficient animals through feed conversion (FC), feed efficiency (FE) or multivariate biological nutritional index (MBNI) would imply alteration in size at maturity, because these variables correlate with the average metabolic live weight (Table 6). It would also result in changes in the maintenance requirements (Murdoch et al., 2005), because those variables presume that every feed is destined for gain, disregarding the requirements for animal maintenance and they are also affected by the composition of gain (Arthur et al., 2001a). Therefore, Kleiber ratio (KR; Kleiber, 1936) and residual feed intake (RFI; Koch et al., 1963) must be used to investigate the efficiency of the animals, which would not imply alteration in size at maturity, because these variables did not correlate with the average metabolic live weight (Table 6), once the co-variance between them with metabolic weight are low or near zero and because these variables consider the differences in maintenance requirements of the animals. In addition, residual feed intake (RFI) is independent of growth (Koch et al., 1963; Murdoch et al., 2005), which can be verified through the absence of significant correlation with weight gain (ADG, Table 6).
The highest values of the Kleiber ratio (KR) indicate increases in weight gain with the same metabolic weight (BW0.75), that means that higher growth is obtained without the increase in the cost of energy for maintenance, indicating higher dilution of energy requirements for maintenance (Tedeschi et al., 2006). However, the Kleiber ratio (KR) did not differ (P>0.05) between treatments (Table 5).
Lower residual feed intake values (negative = more efficient) indicate that the animals consumed less to produce
a similar weight gain at the same metabolic size (BW0.75). That means that animals demand less energy for maintenance and growth. On the other hand, the highest residual feed intake values (positive = inefficient) suggested that the animals exceeded their predicted requirements for maintenance and growth (Murdoch et al., 2005). In this study, the equation obtained to estimate the voluntary dry matter intake (DMI) was: yˆ= -8.3645 + 1.4579 × ADG + 0.1620 x ALW0.75 (R2 = 0.58; EPE= 0.80), where the difference between observed intake and estimated intake is equal to residual intake (Basarab et al., 2003). Residual feed intake did not influence slaughter weight (P>0.05), despite the observation that the residual feed intake values increased as the slaughter weight rised (Table 5). Nevertheless, F1 Blonde D’Aquitane young bulls obtained lower (P<0.05) residual feed intake values, meaning that they were more efficient than the F1 Red Angus young bulls, confirming the previous affirmation that the animals with larger size at maturity are more efficient than the ones with smaller size at maturity when slaughtered at equal weights.
Residual feed intake values ranged from -1.305 kg/d in the most efficient young bull to 1.851 kg/d in the least efficient young bull, therefore, there was a difference of 3.156 kg/d in the residual feed intake. Considering the cost of the diet of R$0.21/kg dry matter (Mello et al., 2009), it means a difference of R$0.66/day between the most efficient and the least efficient young bull, representing profit or loss for the producer.
Residual feed intake is independent of weight gain, whereas the Kleiber ratio is dependent of it. Additionally, residual feed intake was more sensitive in detecting differences in treatments than the Kleiber ratio. Nevertheless, the Kleiber ratio has the advantage of being determined when animals are in groups during finishing, because there is no need to know the individual intake of the animals; while the individual intake of the animals has to be known to determine residual feed intake.
R. Bras. Zootec., v
.39, n.3, p.582-593, 2010
Mello et al.
1AW (kg) = metabolic average live weight; FLW (kg) = final live weight; PF (days) = period of feeding on feedlot; ADG (kg/day) = average daily weight gain; REA (cm2) = rib-eye area of longissimus dorsi muscle between
12th and 13th ribs; SFT (mm) = subcutaneous fat thickness of Longissimus dorsi muscle between 12th and 13th ribs; RUMP (mm) = fat cover in the hind region upon biceps femoris muscle (rump steak); KPIF (kg) = kidney,
pelvic and inguinal fat; DMI (kg/day) = voluntary dry matter intake; PDMI (% BW) = percentage dry matter intake; MDMI (g/UTM) = metabolic dry matter intake; KR (g/UTM) = Kleiber ratio; FC = feed conversion; FE = feed efficiency; MBNI = multivariate biological nutritional index; RFI= residual feed intake.
ns Not-significant (P>0.05); * Significant (P<0.05); ** Significant (P<0.01); *** Significant (P<0.001).
A W F L W P F ADG REA SFT RUMP KPFI D M I P D M I MDMI KR FC FE MBNI RFI
A W 0 . 9 3* * * 0 . 5 5* * * 0.04ns 0 . 5 3* * * 0.44* * 0 . 3 8* 0.45* * 0 . 6 9* * * 0.22ns 0 . 3 6* - 0 . 2 1n s 0 . 3 6* - 0 . 3 9* 0 . 6 3* * * 0.00ns
F L W 0 . 8 8* * * 0 . 7 9* * * 0.14ns 0 . 6 0* * * 0 . 6 5* * * 0.46* * 0 . 6 4* * * 0 . 6 9* * * 0.24ns 0 . 3 9* - 0 . 1 0n s 0.24ns - 0 . 2 9n s 0 . 5 8* * * 0.04ns
P F 0 . 5 3* * * 0 . 8 2* * * - 0 . 0 7n s 0 . 5 4* * * 0 . 7 6* * * 0.45* * 0 . 7 7* * * 0 . 4 0* 0.04ns 0.20ns - 0 . 2 1n s 0.23ns - 0 . 2 9n s 0.46* * 0.05ns
ADG - 0 . 0 7n s 0.06ns - 0 . 1 0n s - 0 . 0 4n s 0.21ns 0.01ns 0.15ns 0 . 3 8* 0.49* * 0.47* * 0 . 9 7* * * - 0 . 8 3* * * 0 . 8 1* * * - 0 . 4 2* 0.00ns
REA 0.52* * 0 . 5 9* * * 0.52* * - 0 . 0 6n s 0.49* * 0.53* * 0.48* * 0 . 4 0* 0.06ns 0.20ns - 0 . 1 7n s 0.23ns - 0 . 2 2n s 0 . 4 4* 0.05ns
SFT 0 . 3 7* 0 . 6 2* * * 0 . 7 7* * * 0.13ns 0.47* * 0.51* * 0 . 7 6* * * 0.31ns 0.08ns 0.17ns 0.10ns - 0 . 0 1n s 0.04ns 0.13ns - 0 . 0 9n s
RUMP 0 . 4 1* 0.51* * 0.44* * - 0 . 0 8n s 0 . 5 4* * * 0.45* * 0.43* * 0.29ns 0.14ns 0.18ns - 0 . 0 8n s 0.23ns - 0 . 1 7n s 0.30ns 0.08ns
KPFI 0.42* 0 . 6 9* * * 0 . 7 9* * * 0.11ns 0.48* * 0 . 7 5* * * 0.44* * 0.29ns 0.04ns 0.13ns 0.03ns - 0 . 0 0n s - 0 . 0 1n s 0.18ns - 0 . 0 9n s
D M I 0 . 6 8* * * 0 . 6 8* * * 0.43* * 0.34ns 0 . 4 0* 0.31ns 0.28ns 0.32ns 0 . 8 4* * * 0 . 9 2* * * 0.21ns 0.20ns 0.19ns 0 . 6 8* * * 0 . 6 5* * *
P D M I 0 . 2 6ns 0.27ns 0.07ns 0.46* * 0.04ns 0.07ns 0.15ns 0.05ns 0 . 8 3* * * 0 . 9 8* * * 0 . 4 3* 0.03ns 0.00ns 0 . 4 3* 0 . 8 6* * *
MDMI 0 . 3 5* 0 . 3 9* 0.21ns 0 . 4 4* 0.16ns 0.13ns 0.17ns 0.13ns 0 . 9 1* * * 0 . 9 8* * * 0 . 3 8* 0.07ns - 0 . 0 3n s 0.53* * 0 . 8 2* * *
KR - 0 . 2 9n s - 0 . 1 6n s - 0 . 2 4n s 0 . 9 6* * * - 0 . 2 0n s 0.02ns - 0 . 1 4n s - 0 . 0 3n s 0.16ns 0 . 4 0* 0.34ns - 0 . 8 9* * * 0 . 9 0* * * - 0 . 5 7* * * 0.00ns
FC 0.47* * 0.33ns 0.30ns - 0 . 8 3* * * 0.22ns 0.02ns 0.28ns 0.06ns 0.20ns 0.01ns 0.05ns - 0 . 9 0* * * - 0 . 9 7* * * 0 . 7 9* * * 0 . 3 5*
FE - 0 . 4 3* - 0 . 2 8n s - 0 . 2 5n s 0 . 8 3* * * - 0 . 1 6n s 0.07ns - 0 . 2 2n s - 0 . 0 2n s - 0 . 1 4n s 0.03ns - 0 . 0 0n s 0 . 9 0* * * - 1 . 0 0* * * - 0 . 8 4* * * - 0 . 3 6*
MBNI 0 . 6 8* * * 0 . 5 8* * * 0 . 4 0* - 0 . 3 6* 0 . 3 9* 0.06ns 0.31ns 0.13ns 0 . 7 0* * * 0.45* * 0 . 5 5* * * - 0 . 5 1* * 0 . 7 6* * * - 0 . 7 6* * * 0 . 6 3* * *
and inguinal fat (KPIF), dry matter intake (DMI), and metabolic dry matter intake (MDMI) were moderately associated (P<0.05) to metabolic weight, final weight and period on feedlot (Table 6).
However, the rib-eye area (REA), subcutaneous fat thickness (SFT), rump fat cover (RUMP), kidney, pelvic and inguinal fat (RPIF), dry matter intake (DMI), and metabolic dry matter intake (MDMI) were moderately associated (P>0.05) to metabolic weight, final weight and period in feedlot (Table 6).
Animal performance indicators (ADG, KPIF, SFT, RUMP and REA), with exception to weight gain (ADG) had medium correlation (P<0.05) among them (Table 6), but did not correlate (P>0.05) with the feed intake indicators (DMI, PDMI, MDMI) and biological efficiency indexes (FC, FE, MBNI, KR, RFI). Only weight gain (ADG) had medium correlation (P<0.05) with the feed intake indicators, high positive correlation (P<0.05) with Kleiber ratio (KR) and feed efficiency (FE), high negative correlation (P<0.05) with the feed conversion (FC), medium negative correlation with the multivariate biological nutritional index (MBNI) and no correlation (P>0.05) with the residual feed intake (RFI, Table 6). It is important to emphasize that the correlation coefficients of the multivariate biological nutritional index (MBNI) with the other variables may assume opposite direction but with the same magnitude, once the canonical coefficients associated to predictive variables (ADG and DMI) accept solution with opposite signal.
Feed intake indicators had high correlation (P<0.05) among them, but did not present significant correlation with feed conversion (FC) and feed efficiency (FE, Table 6). Similarly, biological efficiency indexes, except for the residual feed intake (RFI), had medium to high correlation (P<0.05) among them (Table 6). Among production indicators, only the multivariate biological nutritional index (MBNI) had significant Pearson or Spearman correlation with the residual feed intake (RFI).
There were no phenotype correlation coefficients (P>0.05) of residual feed intake (RFI) with metabolic weight (MW), final weight (FLW), weight gain (ADG), rib-eye area (REA), subcutaneous fat thickness (SFT), rump fat cover (RUMP) and cavitary fat (KPIF) during finishing phase of the studied feedlot, confirming that residual feed intake (RFI) is independent of body size and growth. These results corroborate with Basarab et al. (2003). However, literature data report uncertainty about direction and magnitude of genetic correlations between residual feed intake (RFI) and growth features (Murdoch et al., 2005).
Phenotype correlations between residual feed intake (RFI) and dry matter intake (DMI) were medium and
positive, similar to the ones reported by literature: rp = 0.64 (Herd & Bishop, 2000), rp = 0.64 (Arthur et al., 2001a), rp = 0.72 (Arthur et al., 2001b) and rp = 0.42 (Basarab et al., 2003); while phenotype correlations of residual feed intake (RFI) with percentage of dry matter intake (PDMI) and metabolic dry matter intake (MDMI) were high and positive (Table 6). Besides, cited studies reported phenotype correlations between residual feed intake (RFI) and feed conversion (FC) ranged from 0.53 to 0.70, higher than the 0.35 Pearson’s correlation found between the same variables in the present study.
Therefore, the selection for negative or low residual feed intake (RFI) would result in decrease in dry matter intake (DMI) and enhancement of feed conversion (FC), without any potential adverse effect upon body size and growth rate.
The Pearson and Spearman coefficients of correlation were slightly different, but such differences may be considered too low and without practical meaning. Thus, the Spearman correlation supplies as much information as the Pearson correlation, and still it has larger value because it does not require any assumption about variable frequency distribution. Therefore, the Spearman correlation should not be neglected.
Conclusions
The use of crossbred Continental and Zebu animals in the finishing phase on feedlot results in greater bionutritional efficiency compared to the use of British and Zebu crossbreds. Animals slaughtered at lighter weight are more bionutritional efficient in the finishing phase on feedlot compared to animals slaughtered at heavier weight. Animals with large size at maturity are more efficient than the ones with small size when slaughtered in similar weights. Residual feed intake is independent of growth and size at maturity.
Acknowledgements
The first author is thankful to Conselho Nacional de Desenvolvimento Científico e Tecnológico (CNPq) for partial fellowship.
References
intake, feed efficiency and other postweaning traits in Angus cattle. J o u r n a l o f A n i m a l S c i e n c e, v.79, p.2805-2811, 2001b.
ARTHUR, P.F.; RENAND, G.; KRAUSS, D. Genetic and phenotypic relationships among different measures of growth and feed efficiency in young Charolais bulls. Livestock Production Science, v.68, p.131-139, 2001a.
BARBOSA, P.F. Bovinos – raças puras, novas raças, cruzamentos e compostos de gado de corte. In: SIMPÓSIO NACIONAL DE MELHORAMENTO ANIMAL, 3., 2000, Belo Horizonte, MG.
Anais... Belo Horizonte: SBMA, 2000. p.124-129.
BASARAB, J.A.; PRICE, M.A.; AALHUS, J.L. et al. Residual feed intake and body composition in young growing cattle. Canadian Journal Animal Science, v.83, p.189-204, 2003.
BERG, R.T.; BUTTERFIELD, R.M. New concepts of cattle growth. Sydney: Sydney University Press, 1976. 240p. BERNDT, A.; CRUZ, G.M.; LANNA, D.P.D. et al. Composição
física da 9-11a costelas de tourinhos de diferentes grupos
genéticos em confinamento em relação ao status nutricional na fase de pastejo. In: REUNIÃO ANUAL DA SOCIEDADE BRASILEIRA DE ZOOTECNIA, 38., 2001, Piracicaba, SP.
Anais... Piracicaba: FEALQ, ESALQ, 2001. (CD-ROM). COSTA, E.C.; RESTLE, J.; PASCOAL, L.L. et al. Desempenho de
novilhos Red Angus superprecoces, confinados e abatidos com diferentes pesos. Revista Brasileira de Zootecnia, v.31, n.1, p.129-138, 2002.
DETMANN, E.; CECON, P.R.; ANDREOTTI, M.O. et al. Application of the first canonical variable in the evaluation of animal production trials. Revista Brasileira de Zootecnia, v.34, n.6, p.2417-2426, 2005 (supl.).
EUCLIDES FILHO, K.; EUCLIDES, V.P.B.; FIGUEIREDO, G.R. et al. Eficiência bionutricional de animais Nelore e seus mestiços com Simental e Aberdeen Angus, em duas dietas. Revista Brasileira de Zootecnia, v.30, n.1, p.77-82, 2001.
EUCLIDES FILHO, K.; EUCLIDES, V.P.B.; FIGUEIREDO, G.R. et al. Avaliação de animais Nelore e de seus mestiços com Charolês, Fleckvieh e Chianina, em três dietas. 2. Características de carcaça.
Revista Brasileira de Zootecnia, v.26, n.1, p.73-79, 1997. FOX, D.G.; TEDESCHI, L.O.; TYLUTKI, T.P. et al. The Cornell
Net Carbohydrate and Protein System model for evaluating herd nutrition and nutrient excretion. Animal Feed Science and Technology, v.112, p.29-78, 2004.
GARRET, W.N.; MEYER, J.H.; LOFGREEN, G.P. The comparative energy requirements of sheep and cattle for maintenance and gain. Journal of Animal Science, v.18, n.2, p.528-547, 1959. GUIDONI, A.L. A l t e r n a t i v a s p a r a c o m p a r a r t r a t a m e n t o s e n v o l v e n d o o d e s e m p e n h o n u t r i c i o n a l a n i m a l. 1994. 105f. Tese (Doutorado em Agronomia) - Escola Superior de Agricultura “Luiz de Queiroz”, Piracicaba.
HALL, M.B. Calculation of non-structural carbohydrate content of feeds that contain non-protein nitrogen. Gainesville: University of Florida, 2000. p.A25-A32 (Bulletin, 339). HARRIS, R.J. A primer of multivariate statistics. New York:
Academic Press, 1975. 332p.
HENRIQUE, D.S. Desenvolvimento e avaliação de um modelo matemático para predição do valor nutricional de rações para bovinos sujeito às restrições da massa de fibra no rúmen. 2007. 89f. Tese (Doutorado em Zootecnia) – Universidade Federal de Viçosa, Viçosa, MG.
HERD, R.M.; BISHOP, S.C. Genetic variation in residual feed intake and its association with other production traits in British Hereford cattle. Livestock Production Science, v.63, p.111-119, 2000. JOHNSON, R.A.; WICHERN, D.W. Applied multivariate statistical analysis. New Jersey: Prentice Hall, 1998. 816p. KHATTREE, R.; NAIK, D.N. Applied multivariate statistical with SAS software. 2.ed. New York: John Wiley & Sons, 1999. 338p.
KHATTREE, R.; NAIK, D.N. Multivariate data reduction and discrimination with SAS software. Cary: SAS Institute, 2000. 558p.
KLEIBER, M. Problems involved in breeding for efficiency of food utilization. In: AMERICAN SOCIETY ANIMAL PRODUCTION, 29., 1936, Madison. P r o c e e d i n g s …
Madison: Wisconsin University, 1936. p.247-258.
KOCH, R.M.; SWIGER, L.A.; CHAMBERS, D. et al. Efficiency of feed use in beef cattle. J o u r n a l o f A n i m a l S c i e n c e, v.22, p.486-494, 1963.
LANNA, D.P.D.; PACKER, I.U. Eficiência biológica e econômica de bovinos de corte In: WORKSHOP QUALIDADE DA CARNE E MELHORAMENTO GENÉTICO DE BOVINOS DE CORTE, 1., 1998, São Carlos. Anais... São Carlos: Embrapa São Carlos; Campo Grande: Fundepec, 1998. p.83-104.
M A R D I A , K . V. ; K E N T, J . T. ; B I B B Y, J . M . M u l t i v a r i a t e analysis. 6.ed. London: Academic Press, 1997. 518p. MELLO, R.; RESENDE, F.D.; QUEIROZ, A.C. et al.
Bio-economicity of the finishing phase on feedlot of crossbred young bulls slaughtered at different body weights. Revista Brasileira de Zootecnia, v.38, n.1, p.109-121, 2009. MURDOCH, G.K.; OKINE, E.K.; DIXON, W.T. et al. Growth.
I n : D I J K S T R A , J . ; F O R B E S , J . M . ; F R A N C E , J . ( E d s . )
Q u a n t i t a t i v e a s p e c t s o f r u m i n a n t d i g e s t i o n a n d metabolism. 2.ed. Wallingford: CABI, 2005. p.489-521. NATIONAL RESEARCH COUNCIL - NRC. Nutrient requirements
of beef cattle. 7.ed. Washington, D.C.: National Academy Press, 1996. 242p.
N AT I O N A L R E S E A R C H C O U N C I L - N R C . N u t r i e n t r e q u i re m e n t s o f d a i r y c a t t l e. 7.ed. Washington, D.C.: National Academy Press, 2001. 381p.
RUSSELL, J.B.; O’CONNOR, J.D.; FOX, D.G. et al. A net carbohydrate and protein system for evaluating cattle diets: I. ruminal fermentation. Journal of Animal Science, v.70, p.3551-3561, 1992.
SILVA, D.J.; QUEIROZ, A.C. Análise de alimentos: métodos químicos e biológicos. 3.ed. Viçosa, MG: Universidade Federal de Viçosa, 2002. 235p.
STAT I S T I C A L A N A LY S I S SYSTEM - SAS. U s e r ’s g u i d e. Version 9.1 Cary: SAS Institute, 2002. (CD-ROM).
TAIT, J.R.; ROUSE, G.H.; WILSON, D.E. et al. Comparison of ultrasound and carcass measures to predict the percentage of lean beef from four primal cuts. Ames: Iowa State University, 2001. p.95-97 (Beef Research Report, A. S. Leaflet R1755). TEDESCHI, L.O.; FOX, D.G.; BAKER, M.J. et al. Identifying
differences in feed efficiency among group-fed cattle. Journal of Animal Science, v.84, p.767-776, 2006.