ISSN 0101-2061 Food Science and Technology
OI:
D http://dx.doi.org/10.1590/1678-457X.28316
1 Introduction
Mango (Mangifera indica L.) fruit has species in the Anacardiaceae family (Barreto et al., 2008). It is rich in carbohydrates, vitamin B1, B2 and C and also an abundant supply of provitamin A, and it embodies high volumes of beta-carotene, which is an antioxidant that is very beneficial for humans. Worldwide, it is a crucial tropical fruit which is consumed as fresh as processed form (Corzo & Álvarez, 2012). Globally total mango production is around 43 million tons in 2013 (Food and Agriculture Organization of the United Nations, 2015). The primary mango producer countries in the world are Indonesia, Mexico, Thailand, China, and India. Processed forms of mango can be used as concentrate, juice, puree and ingredients at several products such as cereals, baked foods, nutrition bars, ice cream, yogurt, confections, marinades, sauces, baby food and healthy drinks (Rajkumar et al., 2007). Mango is a fruit that contains high moisture. Therefore, in the course of its short shelf period, loss in quality and deterioration in physical appearance is possible. For this reason, in order to consume this healthy fruit all the yearlong, different strategies should be applied (Caparino et al., 2012).
For removing moisture and preserving the food, drying technique is one of the earliest techniques. By means of this way, the shelf-life of a product can be prolonged significantly. Drying technique also influences other characteristics, such as palatability of food, flavor, aroma, viscosity, hardness, microbial spoilage and enzymatic activity. For mango, numerous suitable drying technologies available such as hot air drying, microwave drying, and freeze drying. Each technique has advantages and constraints specific to itself. As a result of these techniques, the obtained
final product differentiates according to its physicochemical or nutritional properties and microstructures (Caparino et al., 2012). The hot air drying technique is the most frequently used technique to produce dehydrated vegetables and fruits. In this technique, the need for elevated temperatures or lengthy drying durations may provoke severe harm to flavor, color, and nutrients of the product and it may also reduce rehydration capacity and bulk density of the dried fruit (Qing-guo et al., 2006). Microwave dryers are focused on water molecules and they transform electromagnetic energy into kinetic energy. Accordingly, heat is yielded inside the product and so energy transfer cannot be changed due to the obstacles to the transfer. By using this technique, it is possible to penetrate into the material and heat is produced in the total volume of the material. Thus, energy saving and increased drying rate are achieved (Motevali et al., 2011). Besides, there are some disadvantages of this technique, such as the overheating of the surface and textural damage to the product (Botha et al., 2012). Drying by freezing technique enables an output product of high quality. The chemical, biological and physical properties of a product bear only minor changes. On the other hand, it is time-consuming and expensive. In this technique, the raw material which is in the drying chamber should go through the phase of long-lasting storage and pre-freezing, nevertheless, the high temperature of the heating plate hastens the sublimation period (Nawirska et al., 2009).
The primary purposes of this study are: (i) comparing the moisture removal features of three distinct drying techniques with relation to the kinetics, (ii) selecting the most favourable thin-layer drying model and lastly (iii) identifying the variations
Influence of different drying techniques on drying parameters of mango
Nazmi IZLI1*, Gökcen IZLI2, Onur TASKIN1
Received 07 Oct., 2016 Accepted 06 Mar., 2017
1 Biosystems Engineering Department, Agriculture Faculty, Uludag University, Nilüfer, Bursa, Turkey
2 Food Engineering Department, Natural Sciences, Architecture and Engineering Faculty, Bursa Technical University, Yildirim, Bursa, Turkey *Corresponding author: [email protected]
Abstract
This research inspected the effects of freeze, microwave (120 and 350 W) and hot air (60, 70 and 80 °C) drying techniques on the color, drying characteristics, antioxidant capacity and total phenolic content of mango slices. Midilli et al., Two-term and Page models which exemplify drying characteristics are superior than alternative models. All of the color values (a, b, L, C, α and ΔE) were altered notably based on the used drying technique and colors nearest to the fresh sample were attained with freeze drying. In comparison to the fresh sample, the dried samples showed a decrease of 18.4-54.6% in antioxidant capacity. The total phenolic content value was notably highest one for the microwave dried sample at 350 W and the lowest one for a hot air dried sample at 80 °C (P<0.05). This research showed that microwave drying at 350 W is able to yield high-quality mango slices with the extra advantage of shortened drying time in relation to hot air and freeze drying.
Keywords: hot air drying; freeze drying; microwave drying; modeling; quality.
Izli; Izli; Taskin
Food Sci. Technol, Campinas, 37(4): 604-612, Oct.-Dec. 2017 605
between the dried and fresh fruit samples with regard to color, antioxidant capacity and total phenolic content (TPC) features.
2 Materials and methods 2.1 Drying experiments
First of all, from a local market in Bursa, Turkey, fresh mango fruits were purchased as samples. Then, these fruits were kept at 4 ± 0.5 °C. Throughout the research, tally matured and healthy mango fruits were used in the experiments. These sample fruits were sliced to pieces with a thick of 3 ± 0.07 mm by using a food slicer (Nicer Dicer, China). Original moisture content of these fruit samples was figured out as 6.58 (g water/g dry matter) on a dry basis (d.b.) by using forced-air convection oven drying (Doymaz et al., 2016).
The three distinctive drying techniques which were used at the drying experiments are: hot air technique, microwave technique and freeze drying technique. Hot air drying (60, 70 and 80 °C) process was realized by using a modified laboratory hot air oven (Whirlpool AMW 545, Italy). Mango samples were put on a thin-layer with a 400 mm diameter rotating round glass plate. Under the hot air oven, a digital weighing scale (Shimadzu UX-6200H, Japan) that has 0.01 g precision was placed to gauge the mass difference (Szadzińska et al., 2016). A microwave oven (Arçelik MD574, Turkey) with an output power level of 120 W and 350 W was used during the use of microwave drying technique. Here also placed on a thin-layer with a 245 mm diameter rotating round glass plate. Loss of the moisture was calculated by using a digital weighing scale (Radwag, Poland) with a precision of 0.01 g. Thirdly, freeze drying process was performed by using a freeze dryer of laboratory type (Alpha 1-2 LD Plus, Germany) at −50 °C processing temperature and 52 Pa constant pressure in the drying chamber. Loss of the moisture in the course of the drying process was calculated by means of a digital scale (Radwag, Poland) that has ± 0.01 g accuracy. These experiments were performed in triplicate.
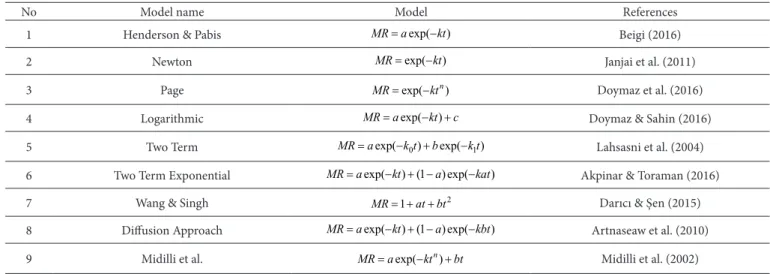
2.2 Mathematical modeling
The moisture ratio data was compatible with nine thin-layer models that were generally utilized in order to model drying characteristics (See Table 1). The following equation was used in the course of the drying experiments in order to calculate the moisture ratio (MR) of the mango samples:
t e
o e
M M MR
M M
− =
− (1)
In this formula Mt is the moisture content at a specific
moment (g water/g dry matter), Mo is the initial moisture content
(g water/g dry matter), Me is the equilibrium moisture content
(g water/g dry matter). When analysed, the Me values are rather
less with relation to Mt or Mo. Consequently, moisture ratio of
the equation was simplified as defined by some researches as follows (Doymaz & Sahin, 2016):
t
o
M MR
M
= (2)
2.3 Color
The precise colors of dried and fresh mango samples were gauged by employing a colorimeter (MSEZ-4500L, HunterLab, USA). This color was defined as a-values (greenness/redness), b-values (blueness/yellowness) and L-values (lightness) all together. a0, b0 and L0 are the parameters of color for the fresh mango samples. In the course of the experiments, calibration of the colorimeter was performed on a standard black and white plate prior to each of these color measurements. Firstly above the light source, a0, b0, L0, a, b and L values were recorded. The color
reading was realized for rind of the fruit sample then finally, the mean value of ten color readings which were taken from random points of the each sample was noted as color value. In addition, the Chroma C, hue angle a and total color variations ΔE were
calculated by using the formulas below (Vega-Gálvez et al., 2012):
2 2
( )
C= a +b (3)
Table 1. Chosen thin-layer drying models so as to model drying kinetics of mango samples mathematically.
No Model name Model References
1 Henderson & Pabis MR=aexp(−kt) Beigi (2016)
2 Newton MR=exp(−kt) Janjai et al. (2011)
3 Page MR=exp(−ktn) Doymaz et al. (2016)
4 Logarithmic MR=aexp(−kt)+c Doymaz & Sahin (2016)
5 Two Term MR=aexp(−k t0)+bexp(−k t1) Lahsasni et al. (2004)
6 Two Term Exponential MR=aexp(−kt) (1+ −a) exp(−kat) Akpinar & Toraman (2016)
7 Wang & Singh MR= + +1 at bt2 Darıcı & Şen (2015)
8 Diffusion Approach MR=aexp(−kt) (1+ −a) exp(−kbt) Artnaseaw et al. (2010)
1
tan b
a a= −
(4)
2 2 2
0 0 0
( ) ( ) ( )
E L L a a b b
∆ = − + − + − (5)
2.4 Mango extraction procedure
The arrangement of fresh and dried mango extracts was handled on the basis of the technique which was expressed by Turkmen et al. (2005). A sample of 1 g was extracted from each of the mango samples with 4.5 mL of 80% aqueous methanol using a mechanical shaker at 140 rpm at room temperature for two hours. That mix was then centrifuged at 10,000 g for 15 minutes, and then the supernatant was put into polypropylene tubes. Under the same setting, the residue was re-extracted again. Supernatants were mixed and passed along a membrane filter of 0.45 µm. The collected clear extracts were used to define antioxidant capacity and TPC.
2.5 Antioxidant capacity determination
The free radical 2,2-diphenyl-1-picrylhydrazyl (DPPH) scavenging of the mango extracts were defined spectrophotometrically pursuant to the technique defined by Alothman et al. (2009). A properly diluted extract of 0.1 mL was poured into methanolic solution of DPPH radical (3.9 mL of 25 mM) and whisked (WiseMix VM-10, Korea) approximately 15 to 30 seconds. This combination was let to continue in the dark for 30 minutes at room temperature then the absorbance was gauged at 515 nm. By using different concentrations of Trolox, a standard curve was sketched. For each of these samples their three replicates were analysed as well.
2.6 Total phenolic content (TPC) determination
TPC values of the extracts were defined in consonance with the technique defined by Igual et al. (2012), with slight changes. According to the analysis, first of all, 0.25 mL methanolic extracts was attenuated by using distilled water of 15 mL, Folin-Ciocalteu reagent of 1.25mL was poured into the mix and whisked for 15 seconds. Later, the mix was leaved in dark to wait for 8 minutes. At the end of this process, 3.75 mL of 7.5% Na2CO3 was put into the mix and the total volume was fixed to 25 mL by adding distilled water. The resultant blue color was read from the mix at 765 nm absorbance. The TPC value of the dried and fresh samples was figured out by utilizing a gallic acid (GA) standards calibration curve and showed as (GA)/100 g on dry weight (d.w.). For each of these samples their three replicates were analysed.
2.7 Statistical analysis
In the course of the measurement process of the examined components, three replicates were used. So as to analyse these results, JMP (Version 7.0, USA) and MATLAB (MathWorks Inc., MA) applications were utilized. In order to gauge significance, mean differences were calculated and LSD (Least Significant Difference) test gave a result of 5% significance level. The model which has the lowest root mean square error (RMSE) and reduced
chi-squared 2
(χ ) values along with the highest coefficient of
determination (R2) was approved as the most applicable model that explains the drying characteristics of mango samples in thin-layer (Chayjan et al., 2015). The expression of these statistical values is:
2 exp, , 2 1
( )
N
i pre i
Ý MR MR N n χ = − = −
∑
(6), exp, 1
( )
n
pre i i
Ý MR MR RMSE N = −
=
∑
(7)where MRexp,i and MRpre i, , are experimental and predicted dimensionless moisture ratio, respectively; N is number of
observations and n is number of constants (Akpinar & Toraman,
2016).
3 Results and discussion
3.1 Drying kinetics
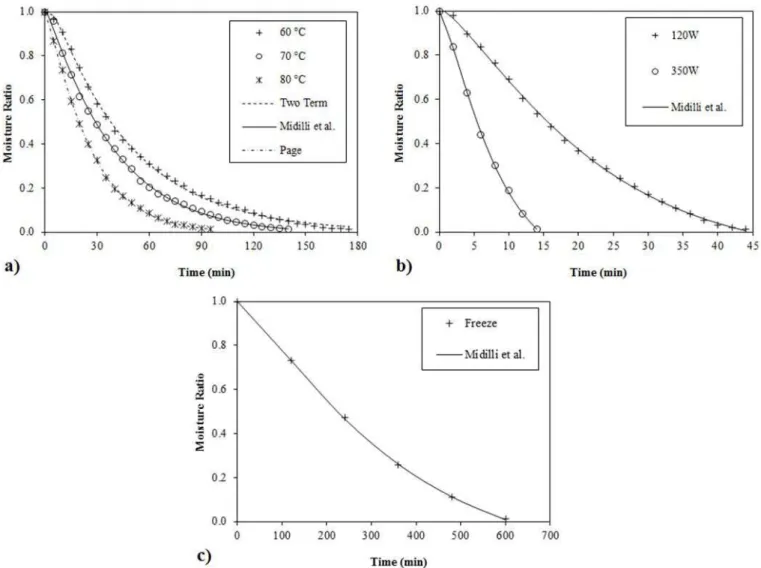
In Figure 1, drying curves of the mango samples which were dried by using distinct techniques are demonstrated. As it can be seen, the drying technique significantly affects total drying duration in order to attain the final moisture content. In this research as distinct drying techniques were used, freeze drying (600 min) had the longest drying duration one and microwave technique of 350 W (14 min) was the shortest one. These data showed that the average total drying duration decreased at the rate of 97.67% for mango samples which were dried at 350W microwave power in proportion to freeze drying technique. The drying durations of mango samples which were dried under hot air technique were respectively 175, 140 and 95 minutes at drying air temperatures of 60, 70 and 80 °C in turn, at a constant drying air velocity of 1.5 m/s while drying durations at microwave power levels of 120 and 350 W were respectively 44 minutes and 14 minutes. These results exhibits that the drying duration for mango samples at 350W was 68.18% less than the samples which were at 120 W. Moreover, the average total drying duration decreased 45.71% when air temperature raised from 60 °C to 80 °C. For this reason, incrementing the level of the microwave power and temperature led to a considerable decline in the drying duration. Identical outcomes were also obtained by Vega-Gálvez et al. (2012) and Doymaz & Ismail (2012) at the hot air drying technique applied on apple and pear by Chayjan et al. (2015) and Duan et al. (2015) for the microwave drying technique applied on hawthorn and lychee fruits, respectively.
3.2 Modeling of drying curves
Table 2 exhibits the statistical analysis data, containing the model constants and R2, RMSE and χ2 values, for all thin-layer
drying models suitable with the moisture ratio data. At all circumstances, the statistical parameter predictions exhibited that R2, RMSE and χ2 values varies from 0.9503 to 0.9999, 0.0036 to
0.0802, 0.1343 x 10⁻⁴ to 62.8524 x 10⁻⁴, respectively. These results
Izli; Izli; Taskin
Food Sci. Technol, Campinas, 37(4): 604-612, Oct.-Dec. 2017 607
utilized in this research sufficiently performed the thin-layer drying behavior of mango. When a comparison was made between the 9 models and the statistical values, the Midilli et al. model showed the greater R2 and the lesser RMSE and χ 2 values
with respect to other drying models at 70 °C air temperature, and 120 and 350 W microwave levels and freeze condition. In addition, the Two Term and Page models resulted in preferable statistical values than other thin layer models at air temperatures of 60 and 80 °C. For dried mango samples, the differentiation of experimental moisture ratio and estimated moisture ratio by utilizing the most suitable models with drying duration at freeze condition, chosen microwave powers and temperatures are demonstrated in Figure 2. It is obvious that the predicted values gathered from the Midilli et al., Two-term and Page models and the values gathered from the experiment were considerably similar to each other. Therefore, the Midilli et al., Two-term and Page models were chosen as the most appropriate models to show the thin-layer drying characteristics of the mango samples. Additionally, these outcomes are in consonance with previous researches noted for the Midilli et al. model (Darıcı & Şen, 2015), the Two-term model (Lahsasni et al., 2004) and lastly Page model (Janjai et al., 2011).
3.3 Color values
Inf
luen
ce o
f dif
fer
en
t dr
yin
g t
ec
hniq
ues o
n m
an
go
Fo
o
d S
ci
. T
ec
hn
ol, C
am
pin
as, 37(4): 604-612, O
ct.-D
ec. 2017
No 60 °C 70 °C 80 °C
Model coefficients R2 RMSE χ2(10-4) Model coefficients R2 RMSE χ2(10-4) Model coefficients R2 RMSE χ2(10-4)
1 a=1.077; k=0.02071 0.9956 0.0198 3.7054 a=1.052; k=0.02659 0.9968 0.0168 2.5620 a=1.044; k=0.03984 0.9963 0.0186 3.5235
2 k=0.01927 0.9899 0.0300 8.3401 k=0.0253 0.9941 0.0227 4.8626 k=0.03825 0.9944 0.0228 5.2259
3 k=0.009579; n=1.17 0.9972 0.0158 2.2987 k=0.01551; n=1.127 0.9982 0.0125 1.3297 k=0.02253; n=1.153 0.9998 0.0048 0.2262
4 a=1.322; k=0.0191c=-0.02908 0.9967 0.0171 2.7645 a=1.065; k=0.02469c=-0.02587 0.9978 0.0139 1.7046 a=1.063; k=0.03631c=-0.03315 0.9980 0.0135 1.9194
5 a=1.091; ko=0.02198
b=-0.1488; k1=0.2202 0.9990 0.0095 0.8737
a=0.5255; ko=0.02681
b=0.5255; k1=0.0263 0.9965 0.0174 2.7693
a=0.3828; ko=0.03938
b=0.659; k1= 0.03997 0.9958 0.0198 3.9700
6 a=0.0001282; k=150.2 0.9896 0.0304 8.6025 a=0.0002277; k=111.1 0.9939 0.0231 5.0648 a=0.0001619; k=236.2 0.9941 0.0234 5.5312
7 a=-0.01381; b=0.0000487 0.9848 0.0369 13.3276 a=-0.01782; b=0.00008038 0.9830 0.0385 14.6040 a=-0.02665; b=0.0001782 0.9862 0.0359 12.9134
8 a=1.153; k=0.01886
b=0.8744 0.9895 0.0306 8.4553
a=1.073; k=0.02525
b=0.9759 0.9937 0.0235 5.0411
a=-0.4257; k=0.09974
b=0.4786 0.9996 0.0063 0.3287
9 a=1.034; k=0.01217
n=1034; b=-0.00000235 0.9978 0.0141 1.8888
a=1.02; k=0.01824
n=1.088; b=-0.00003735 0.9983 0.0121 1.2296
a=1.002; k=0.02286
n=1.149; b=-0.00000357 0.9997 0.0050 0.2534
No 120 W 350 W Freeze
Model coefficients R2 RMSE χ2(10-4) Model coefficients R2 RMSE χ2(10-4) Model coefficients R2 RMSE χ2(10-4)
1 a= 1.12; k= 0.05811 0.9727 0.0541 29.0613 a= 1.071; k= 0.1613 0.9595 0.0724 51.2225 a= 1.046; k= 0.003829 0.9621 0.0741 54.3616
2 k= 0.05191 0.9567 0.0682 46.1089 k= 0.1509 0.9575 0.0742 53.7865 k= 0.003676 0.9662 0.0700 48.6046
3 k= 0.01265; n= 1.464 0.9973 0.0172 2.4699 k= 0.05616; n= 1.501 0.9959 0.0229 4.9330 k= 0.0002536; n=1.467 0.9955 0.0257 4.8788
4 a= 1.406; k= 0.03267
c= -0.3493 0.9964 0.0196 4.0827
a= 1.615; k= 0.07211
c= -0.593 0.9961 0.0225 4.8768
a= 1.509; k= 0.001855
c= -0.4987 0.9976 0.0188 4.0472
5 a= -8.064; ko= 0.01325
b= 9.07; k1= 0.01605 0.9934 0.0267 7.4415
a= -49.54; ko= 0.2817
b= 50.56; k1= 0.2774 0.9846 0.0447 18.8976
a= -0.3343; ko= 0.5
b= 1.334; k1= 0.00478 0.9724 0.0633 39.1144
6 a= 0.0001187; k= 437.1 0.9546 0.0698 48.3439 a= 0.0003081; k= 489.7 0.9503 0.0802 62.8524 a= 0.0002737; k= 13.42 0.9577 0.0783 60.8237
7 a= -0.03719; b= 0.0003248 0.9951 0.0230 5.4024 a= -0.1053; b= 0.002423 0.9970 0.0198 3.6437 a= -0.002582; b=0.00000154 0.9992 0.0108 1.4618
8 a= -0.3956; k= 0.04685
b= 1.076 0.9527 0.0712 47.9755
a= -316.5; k= 0.2651
b= 0.9978 0.9830 0.0469 17.3442
a= -1.63; k= 0.002162
b= 1.227 0.9615 0.0746 41.5261
9 a= 1.015; k= 0.01882
n= 1.295; b= -0.001718 0.9991 0.0097 0.8197
a= 1.003; k= 0.06788
n= 1.305; b= -0.007662 0.9993 0.0092 0.6388
a= 0.9995; k= 0.0006975
Izli; Izli; Taskin
Food Sci. Technol, Campinas, 37(4): 604-612, Oct.-Dec. 2017 609
followed the b values. For mango samples, this results in less saturation and dull yellow appearance. Furthermore, with the rise of drying temperature and/or microwave power in hot air and microwave drying techniques, lower α values were obtained, and it is primarily due to the greater a values. ∆E is a function of a, b and L values, and it was reliant on drying techniques. The decline in L value of mango samples culminated in greater ∆E
of mango samples. Microwave drying technique at 350 W (42.30) resulted in the highest ∆E while lowest ∆E value was attained from the freeze drying technique (6.25). Color changes in mango fruit samples caused by drying technique may be closely related to pigment degradation, principally degradation of carotenoids and formation of brown pigments by non-enzymatic (Maillard reaction) and enzymatic reaction (Albanese et al., 2013). Table 3. The color parameters of dried and fresh mango fruit samples at distinct drying techniques.
Drying technique Color parameters
L a b C α° ∆E
Fresh 77.63 ± 0.95a 6.79 ± 0.37e 66.41 ± 0.86a 66.76 ± 0.83a 84.20 ± 0.36b
-Hot air drying
60 °C 69.01 ± 1.54c 9.82 ± 0.80d 47.67 ± 1.00e 48.68 ± 0.97e 78.39 ± 0.99c 20.92 ± 0.97e
70 °C 63.32 ± 0.85d 12.71 ± 0.86b 50.61 ± 0.76d 52.19 ± 0.79d 75.94 ± 0.92d 22.15 ± 0.89d
80 °C 54.24 ± 0.28f 15.39 ± 0.39a 58.57 ± 0.73c 60.55 ± 0.77c 75.32 ± 0.31de 26.13 ± 0.33c
Microwave drying
120 W 57.19 ± 0.64e 10.51 ± 0.44c 38.92 ± 1.64g 40.31 ± 1.54g 74.90 ± 1.02e 34.48 ± 1.24b
350 W 45.49 ± 1.65g 15.13 ± 0.24a 40.21 ± 0.83f 42.97 ± 0.73f 69.41 ± 0.61f 42.30 ± 1.78a
Freeze drying 75.32 ± 1.02b 2.01 ± 0.75f 63.37 ± 0.54b 63.40 ± 0.53b 88.23 ± 0.69a 6.25 ± 0.37f
a-gMeans superscript with different alphabets in the same column differ significantly (P<0.05).
3.4 Antioxidant capacity
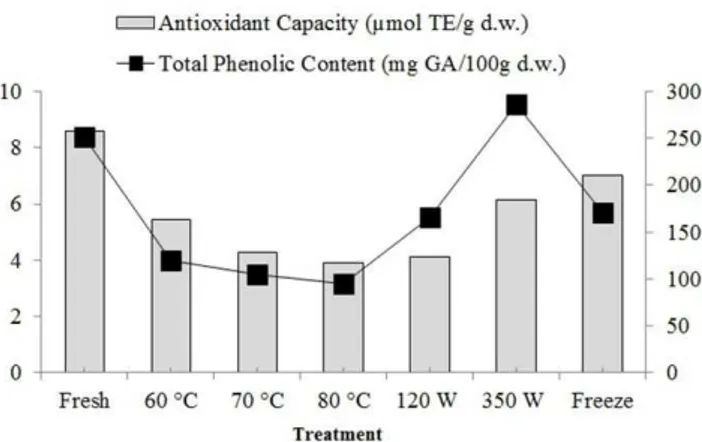
Figure 3 exhibits the variation in the antioxidant capacity of mango samples which were affected by drying treatment. Fresh mango sample’s antioxidant capacity was identified to be 8.61 µmol TE/g d.w. Drying treatment caused a remarkable decline in DPPH radical scavenging activity with regard to fresh mango sample (P<0.05), in line with the reported result for in pineapple (Di Scala et al., 2011) and strawberry (Wojdylo et al., 2009). The decline mentioned above is linked with the degradation of antioxidant compounds in the course of drying treatment. The mango samples which were dried by freeze technique (7.03 µmol TE/g d.w.) had considerably greater antioxidant capacity than other mango samples (P<0.05), except the mango samples that were dried by microwave technique at 350 W power (6.17 µmol TE/g d.w.) (P >0.05). In addition, there was no notable distinction between the antioxidant capacity of the hot air technique (70 and 80 °C) and microwave technique (120 W) dried mango samples (4.30, 3.91 and 4.13µmol TE/g d.w., in turn) (P >0.05). It was seen that antioxidant capacity of mango samples do not show same behavior with the TPC of mango samples. Correlation analysis which was applied between TPC and antioxidant capacity for mango samples exhibited a low correlation (R2=0.4886). That behavior pattern could be in
connection with drying process; there may be synergistic or antagonistic influences between antioxidant compounds or with other components (Di Scala et al., 2011). Meanwhile, this difference may root in the interference of other reducing substance in the colorimetric Folin-Ciocalteu method (Prior et al., 2005).
3.5 Total phenolic content
Figure 3 exhibits the outcomes of drying on TPC of mango fruit samples. Since it can be inspected, TPC considerably ranged according to the applied drying techniques. TPC value of fresh mango sample was 251.09 mg GA/100 g d.w. The highest TPC (286.83 mg GA/100g d.w.) was attained by microwave drying technique at 350 W, besides the minimum phenolic content was attained by hot air drying technique at 80 °C (94.96 mg GA/100g) (P<0.05). Rising drying temperature from 60 °C to 80 °C reduced the phenolic content significantly (P<0.05). In virtue of the rise at drying temperature, the decrease in total phenolic has also
been reported by some studies in pear samples (Santos et al., 2014) and apple samples (Vega-Gálvez et al., 2012). In sum, amid the three distinct drying techniques, microwave drying technique attained greater TPC values, and then freeze and hot air drying techniques respectively. The highest TPC value was obtained at microwave dried mango fruit sample at 350 W may be due to high temperatures reached in fruit especially with microwaves lead to greater cell disruption and rupture, hence those may cause more phenolic compounds to be released. In addition, this result was possibly because of short drying period and so the phenolics were exposed to thermal effect less. The decline in phenolic content in the course of drying period can be associated with the association of polyphenols with other compositions (proteins) or the changes in the chemical formation of polyphenols that cannot be defined or extracted via existing techniques. The influences of drying techniques on the phenolic compounds of foods were inspected before. Some of these studies had shown that heat treatment is very practical for raising the TPC in various food samples such as dry raisins (Carranza-Concha et al., 2012), apricots (Sultana et al., 2012) and orange peels (Chen et al., 2011). Additionally, some results pointed that microwave technique raised the TPC considerably in pepper, broccoli, green beans (Turkmen et al., 2005) and barley (Gallegos-Infante et al., 2010). Besides, while some researchers (Zanoelo et al., 2006; Sultana et al., 2012; Mrad et al., 2012) pointed out that total phenolics content declined during thermal processing of foods, some of them (Dewanto et al., 2002) were reported to exhibit no considerable change. Therefore, the effect of drying techniques on phenolic compounds from various materials may not result in the same consequence.
4 Conclusions
It was determined that the drying techniques had a considerable impact on the mango samples’ drying kinetics, color, antioxidant capacity and TPC. Microwave drying technique remarkably minimized the drying duration in proportion to hot air and freeze techniques. So as to clarify the drying kinetics of mango, nine thin-layer drying models were practiced in the research. With reference to the statistical outcomes, the Midilli et al., Two-term and Page models had exhibited better conformance to the experimental mango data in comparison with the other models. Freeze drying technique gave the most suitable color values for the product that were nearest to a, b, L, C and α values of the fresh mango sample. Microwave drying technique yielded the maximum ∆E, and freeze drying technique yielded the minimum ∆E value. The antioxidant capacity and TPC value of the dried mango samples were declined by the drying techniques, except microwave drying technique at 350 W for TPC content. Obtained results about the correlation analysis between antioxidant capacity and TPC showed that there was a very low correlation between those. Also, there may be antagonistic or synergistic influences between antioxidant compounds or with other components in the course of the drying process. In reference to these results above, it would be clear that the most suitable drying technique would be non-thermal freeze-drying so as to protect mango fruits’ color values, bioactive TPC, and antioxidant capacities. Figure 3. The influences of distinct drying techniques on mango fruit
Izli; Izli; Taskin
Food Sci. Technol, Campinas, 37(4): 604-612, Oct.-Dec. 2017 611
Transfer, 51(8), 1167-1176. http://dx.doi.org/10.1007/s00231-014-1487-x.
Dewanto, V., Wu, X., Adom, K. K., & Liu, R. H. (2002). Thermal processing enhances the nutritional value of tomatoes by increasing total antioxidant activity. Journal of Agricultural and Food Chemistry, 50(10), 3010-3014. http://dx.doi.org/10.1021/jf0115589.
Di Scala, K., Vega-Gálvez, A., Uribe, E., Oyanadel, R., Miranda, M., Vergara, J., & Quispe, I. (2011). Changes of quality characteristics of pepino fruit (Solanum muricatum Ait) during convective drying. International Journal of Food Science & Technology, 46(4), 746-753. http://dx.doi.org/10.1111/j.1365-2621.2011.02555.x.
Doymaz, I., & Ismail, O. (2012). Experimental characterization and modelling of drying of pear slices. Food Science and Biotechnology, 21(5), 1377-1381. http://dx.doi.org/10.1007/s10068-012-0181-3. Doymaz, I., & Sahin, M. (2016). Effect of temperature and pre-treatment
on drying and rehydration characteristics of broccoli slices. Journal of Food Measurement and Characterization, 10(2), 364-373. http:// dx.doi.org/10.1007/s11694-016-9315-2.
Doymaz, İ., Karasu, S., & Baslar, M. (2016). Effects of infrared heating on drying kinetics, antioxidant activity, phenolic content, and color of jujube fruit. Journal of Food Measurement and Characterization, 10(2), 283-291. http://dx.doi.org/10.1007/s11694-016-9305-4. Duan, X., Huang, L., Wang, M., Qiao, F., & Fang, C. (2015). Studies
on the effects of microwave power and temperature control on the quality of whole lychee (Litchi chinensis Sonn.) fruit during microwave vacuum drying. Journal of Food Processing and Preservation, 39(4), 423-431. http://dx.doi.org/10.1111/jfpp.12247.
Food and Agriculture Organization of the United Nations. (2015). The state of food insecurity in the world. Rome: FAO. Retrieved from http://faostat3.fao.org/browse/T/TP/E.
Gallegos-Infante, J. A., Rocha-Guzman, N. E., Gonzalez-Laredo, R. F., & Pulido-Alonso, J. (2010). Effect of processing on the antioxidant properties of extracts from Mexican barley (Hordeum vulgare) cultivar. Food Chemistry, 119(3), 903-906. http://dx.doi.org/10.1016/j. foodchem.2009.07.044.
Igual, M., García-Martínez, E., Martín-Esparza, M. E., & Martínez-Navarrete, N. (2012). Effect of processing on the drying kinetics and functional value of dried apricot. Food Research International, 47(2), 284-290. http://dx.doi.org/10.1016/j.foodres.2011.07.019. Janjai, S., Precoppe, M., Lamlert, N., Mahayothee, B., Bala, B. K., Nagle,
M., & Müller, J. (2011). Thin-layer drying of litchi (Litchi chinensis Sonn.). Food and Bioproducts Processing, 89(3), 194-201. http:// dx.doi.org/10.1016/j.fbp.2010.05.002.
Lahsasni, S., Kouhila, M., Mahrouz, M., & Jaouhari, J. T. (2004). Drying kinetics of prickly pear fruit (Opuntia ficus indica). Journal of Food Engineering, 61(2), 173-179. http://dx.doi.org/10.1016/ S0260-8774(03)00084-0.
Midilli, A., Kucuk, H., & Yapar, Z. (2002). A new model for single-layer drying. Drying Technology, 20(7), 1503-1513. http://dx.doi. org/10.1081/DRT-120005864.
Motevali, A., Minaei, S., Khoshtaghaza, M. H., & Amirnejat, H. (2011). Comparison of energy consumption and specific energy requirements of different methods for drying mushroom slices. Energy, 36(11), 6433-6441. http://dx.doi.org/10.1016/j.energy.2011.09.024. Mrad, N. D., Boudhrioua, N., Kechaou, N., Courtois, F., & Bonazzi,
C. (2012). Influence of air drying temperature on kinetics, physicochemical properties, total phenolic content and ascorbic acid of pears. Food and Bioproducts Processing, 90(3), 433-441. http:// dx.doi.org/10.1016/j.fbp.2011.11.009.
Acknowledgements
This research was supported by Uludag University Scientific Research Projects unit (Project No. OUAP(Z)-2014/6).
References
Akpinar, E. K., & Toraman, S. (2016). Determination of drying kinetics and convective heat transfer coefficients of ginger slices. Heat and Mass Transfer, 52(10), 2271-2281. http://dx.doi.org/10.1007/ s00231-015-1729-6.
Albanese, D., Cinquanta, L., Cuccurullo, G., & Di Matteo, M. (2013). Effects of microwave and hot‐air drying methods on color β‐carotene and radical scavenging activity of apricots. International Journal of Food Science & Technology, 48(6), 1327-1333. http://dx.doi. org/10.1111/ijfs.12095.
Alothman, M., Bhat, R., & Karim, A. A. (2009). Antioxidant capacity and phenolic content of selected tropical fruits from Malaysia extracted with different solvents. Food Chemistry, 115(3), 785-788. http://dx.doi.org/10.1016/j.foodchem.2008.12.005.
Artnaseaw, A., Theerakulpisut, S., & Benjapiyaporn, C. (2010). Drying characteristics of Shiitake mushroom and Jinda chili during vacuum heat pump drying. Food and Bioproducts Processing, 88(2-3), 105-114. http://dx.doi.org/10.1016/j.fbp.2009.09.006.
Barreto, J. C., Trevisan, M. T., Hull, W. E., Erben, G., De Brito, E. S., Pfundstein, B., Würtele, G., Spiegelhalder, B., & Owen, R. W. (2008). Characterization and quantitation of polyphenolic compounds in bark, kernel, leaves, and peel of mango (Mangifera indica L.). Journal of Agricultural and Food Chemistry, 56(14), 5599-5610. http://dx.doi. org/10.1021/jf800738r.
Beigi, M. (2016). Hot air drying of apple slices: dehydration characteristics and quality assessment. Heat and Mass Transfer, 52(8), 1435-1442. http://dx.doi.org/10.1007/s00231-015-1646-8.
Botha, G. E., Oliveira, J. C., & Ahrné, L. (2012). Quality optimisation of combined osmotic dehydration and microwave assisted air drying of pineapple using constant power emission. Food and Bioproducts Processing, 90(2), 171-179. http://dx.doi.org/10.1016/j.fbp.2011.02.006. Caparino, O. A., Tang, J., Nindo, C. I., Sablani, S. S., Powers, J. R., & Fellman, J. K. (2012). Effect of drying methods on the physical properties and microstructures of mango (Philippine ‘Carabao’ var.) powder. Journal of Food Engineering, 111(1), 135-148. http:// dx.doi.org/10.1016/j.jfoodeng.2012.01.010.
Carranza-Concha, J., Benlloch, M., Camacho, M. M., & Martínez-Navarrete, N. (2012). Effects of drying and pretreatment on the nutritional and functional quality of raisins. Food and Bioproducts Processing, 90(2), 243-248. http://dx.doi.org/10.1016/j.fbp.2011.04.002. Chayjan, R. A., Kaveh, M., & Khayati, S. (2015). Modeling drying
characteristics of hawthorn fruit under microwave‐convective conditions. Journal of Food Processing and Preservation, 39(3), 239-253. http://dx.doi.org/10.1111/jfpp.12226.
Chen, M. L., Yang, D. J., & Liu, S. C. (2011). Effects of drying temperature on the flavonoid, phenolic acid and antioxidative capacities of the methanol extract of citrus fruit (Citrus sinensis (L.) Osbeck) peels. International Journal of Food Science & Technology, 46(6), 1179-1185. http://dx.doi.org/10.1111/j.1365-2621.2011.02605.x.
Corzo, O., & Álvarez, C. (2012). Color change kinetics of mango at different maturity stages during air drying. Journal of Food Processing and Preservation, 38(1), 508-517. http://dx.doi.org/10.1111/j.1745-4549.2012.00801.x.
Szadzińska, J., Kowalski, S. J., & Stasiak, M. (2016). Microwave and ultrasound enhancement of convective drying of strawberries: Experimental and modeling efficiency. International Journal of Heat and Mass Transfer, 103, 1065-1074. http://dx.doi.org/10.1016/j. ijheatmasstransfer.2016.08.001.
Turkmen, N., Sari, F., & Velioglu, Y. S. (2005). The effect of cooking methods on total phenolics and antioxidant activity of selected green vegetables. Food Chemistry, 93(4), 713-718. http://dx.doi. org/10.1016/j.foodchem.2004.12.038.
Vega-Gálvez, A., Ah-Hen, K., Chacana, M., Vergara, J., Martínez-Monzó, J., García-Segovia, P., Lemus-Mondaca, R., & Di Scala, K. (2012). Effect of temperature and air velocity on drying kinetics, antioxidant capacity, total phenolic content, color, texture and microstructure of apple (var. Granny Smith) slices. Food Chemistry, 132(1), 51-59. http://dx.doi.org/10.1016/j.foodchem.2011.10.029.
Wojdylo, A., Figiel, A., & Oszmiański, J. (2009). Effect of drying methods with the application of vacuum microwaves on the bioactive compounds, color, and antioxidant activity of strawberry fruits. Journal of Agricultural and Food Chemistry, 57(4), 1337-1343. http:// dx.doi.org/10.1021/jf802507j.
Zanoelo, E. F., Cardozo-Filho, L., & Cardozo-Junior, E. L. (2006). Superheated steamdrying of mate leaves and effect of drying conditions on the phenol content. Journal of Food Process Engineering, 29(3), 253-268. http://dx.doi.org/10.1111/j.1745-4530.2006.00064.x. Nawirska, A., Figiel, A., Kucharska, A. Z., Sokol-Letowska, A., & Biesiada,
A. (2009). Drying kinetics and quality parameters of pumpkin slices dehydrated using different methods. Journal of Food Engineering, 94(1), 14-20. http://dx.doi.org/10.1016/j.jfoodeng.2009.02.025. Prior, R. L., Wu, X., & Schaich, K. (2005). Standardized methods for the
determination of antioxidant capacity and phenolics in foods and dietary supplements. Journal of Agricultural and Food Chemistry, 53(10), 4290-4302. http://dx.doi.org/10.1021/jf0502698.
Qing-guo, H., Min, Z., Mujumdar, A. S., Wei-hua, D., & Jin-cai, S. (2006). Effects of distinct drying methods on the quality changes of granular edamame. Drying Technology, 24(8), 1025-1032. http:// dx.doi.org/10.1080/07373930600776217.
Rajkumar, P., Kailappan, R., Viswanathan, R., & Raghavan, G. S. V. (2007). Drying characteristics of foamed alphonso mango pulp in a continuous type foam mat dryer. Journal of Food Engineering, 79(4), 1452-1459. http://dx.doi.org/10.1016/j.jfoodeng.2006.04.027. Santos, S. C., Guiné, R. P., & Barros, A. (2014). Effect of drying temperatures on the phenolic composition and antioxidant activity of pears of Rocha variety (Pyrus communis L.). Journal of Food Measurement and Characterization, 8(2), 105-112. http://dx.doi. org/10.1007/s11694-014-9170-y.