Received 31 Jan., 2014 Accepted 25 Mar., 2014 (006269)
1 Department of Chemical Engineering, Federal University of Sergipe, São Cristóvão, SE, Brazil, e-mail: [email protected] 2 Industrial Engineering Graduate Program, Nove de Julho University, São Paulo, SP, Brazil
*Corresponding author
Use of simulated annealing in standardization and optimization
of the
acerola
wine production
Sheyla dos Santos ALMEIDA1, Wonder Alexandre Luz ALVES2, Sidnei Alves de ARAÚJO2,
José Carlos Curvelo SANTANA2, Narendra NARAIN1, Roberto Rodrigues de SOUZA1*
1 Introduction
Antioxidants are molecules capable of reducing or preventing other molecules from oxidizing, while biological antioxidants may be defined as substances that when in small concentrations compared to an oxidizable substance, delay or prevent oxidation of that substance. Among the several classes of natural antioxidant substances, phenolic compounds have received particular attention because they inhibit lipid peroxidantion and lipo-oxygenation in vivo because of their chemical structures with reducing properties that enable neutralization or sequestrations of free radicals and their potential for transition metal chelation (Oliveira et al., 2012). Sargi et al. (2013) showed that some fruit seeds such as chia, golden flax, brown flax, white perilla, and brown perilla, which can also contain a high amount of antioxidants that are important to our health, are commonly discarded before ingestion.
Barbados cherry (Malpighia glabra L.) or acerola, as it is called in Brazil (Kawaguchi et al., 2007; Mezadri et al., 2008), is a fruit that is considered as an excellent source of antioxidant. According to Caetano et al. (2009), acerola extracts have significant amounts of total phenolics (1,780.6 to 5,954.2 µg catechinequivalent.mL–1) and good DPPH (1,1-diphenyl-2-picrilhidrazil) scavenging capacity (>70%), which makes it a promising source of natural antioxidants.
Acerola is known for its very high ascorbic acid (vitamin C) content; about 100 g of its juice have from 50 to 100-times more of this vitamin than an equal quantity of lemon or orange juice. Other vitamins of relevant importance for health and human food purposes such as A, B1, and B2 are also present in this fruit. The daily intake of 2 to 4 fruits is sufficient to meet the nutrient requirements of healthy individuals. The Barbados cherry fruit is also important from social and economic aspects
since it offers the poor population an easy and accessible source of vitamins and mineral salts at low cost (Almeida et al., 2010; Curvelo-Santana et al., 2010a). Mezadri et al. (2008) found that the composition of total ascorbic acid in acerola pulp ranged from 6.32 to 9.20 g kg–1 and 9.44 to 17.97 g L–1 in acerola juice. They reported that vitamin C, total phenol index (TPI), total anthocyanins, and polyphenolic compounds present in acerola fruit are main factors responsible for antioxidant activity.
In general, wines are obtained from grape; however, they can also be made from other fruits, such as orange, pineapple, strawberry, cashew apple (Anacardium occidentale L.), cajá (Spondias mombin L.), and other exotic fruits (Curvelo-Santana et al., 2010a; Severo Jr. et al., 2007). Usually, the wines made have flavor and aroma characteristics of the original fruit utilized and can be stored for a long time if proper precautions are taken.
In the present study, seven samples of acerola wine were prepared, and the simulated annealing technique was used to obtain the optimal sensory qualities and cost of wine.
2 Materials and methods
2.1 Preparation and analysis of acerola wines
Acerola fruits at maturity stage, provided by Central Food Supply of Sergipe (CEASA), Aracaju, SE, Brazil, were used in this study. The fruits were selected, cleaned with chlorine (2 ppm of active Cl2), washed and triturated using a mixer obtaining the pulp, which was stored in a refrigerator. The prices of acerola fruit and sugar have been updated according to the Central Food Supply of Pernambuco, CEASAPE (Centro de Abastecimento e Logística de Pernambuco, 2013) and the Center of Advanced
Abstract
In this study, seven wine samples were prepared varying the amount of pulpof acerola fruits and the sugar content using the simulated annealing technique to obtain the optimal sensory qualities and cost for the wine produced. S. cerevisiae yeast was used in the fermentation process and the sensory attributes were evaluated using a hedonic scale. Acerola wines were classified as sweet, with 11°GL of alcohol concentration and with aroma, taste, and color characteristics of the acerola fruit. The simulated annealing experiments showed that the best conditions were found at mass ratio between 1/7.5-1/6 and total soluble solids between 28.6-29.0 °Brix, from which the sensory acceptance scores of 6.9, 6.8, and 8.8 were obtained for color, aroma, and flavor, respectively, with a production cost 43-45% lower than the cost of traditional wines commercialized in Brazil.
Keywords: simulated annealing; sensory quality; acerola; wine; optimization; production cost. OI:
2010, 2012a, b, c, 2013a; Curvelo-Santana et al., 2010a; Severo Jr. et al., 2007; Cuquel et al., 2012; Dias et al., 2012; Souza et al., 2012). This study was approved by the Ethics Committee for Research with humans CoEP - UNINOVE (Protocol 006189). The sensory analysis was conducted (and the wine production data were obtained) at the Department of Chemical Engineering from the Federal University of Sergipe (UFS- Protocol 3060), and it was financially supported by CNPq (Brasilia, Brazil) and by FundoVerde-Amarelo (FINEP-EMDAGRO).
2.3 Applying simulated annealing algorithm
In order to better evaluate the effect of total solids (°Brix) and fruit pulp weight (%, m/v) on the wines acceptability in relation to taste, color, and aroma, a 22 experimental design (square design) was used aiming to reduce the number of experiments to be performed and a better evaluation of results obtained. Table 1 presents the data related to experiment planning using the normal and codified variables and their responses to the attributes taste, color, and aroma. (1) and acerola fruit (2) were codified according to their values and normalized to values -1, 0 and 1 to facilitate the regression calculations. In the present study, the SA technique was applied to determine the parameters 1 and 2, which maximize the objective function (OF), shown in Equation 1.
Simulated Annealing (SA) is a probabilistic search technique that simulates the annealing process of metals, in which the metal is heated to high temperatures and then systematically cooled in the same order to achieve an equilibrium characterized by an orderly and stable microstructure (Benvenga et al., 2011; Kirkpatrick et al., 1983).
2 0
1 1 1 1
avarege ( color aroma flavor) / 3 i
K K
l i i ii ij i j
i i i j i
y b b x b x b x x and
y y y y
= = = = +
= + + +
= + +
∑
∑
∑ ∑
(1)
where yl is the sum of the responses of the attributes flavor, color, and aroma; xi and xj are the coded variables 1 and 2, respectively; and bi is the least square regression coefficient, according to Almeida et al. (2010) and Curvelo-Santana et al. (2010b).
2.4 Minimum price and cost determination
The company studied has a staff of 6 employees and a capacity to produce up to 40,000 liters of acerola wine monthly. Table 2 shows the summary of this company’s fixed Studies in Applied Economy, CEPEA (Centro de Estudos
Avançados em Economia Aplicada, 2013), respectively. For the must preparation, the amount of acerola pulp and the total soluble solids (°Brix) content varied according to the 22experimental design, as shown in Table 1 (Biazus et al., 2010). The Acerola pulp was mixed with water (4.5 L) and triturated; the inorganic nutrients were added at the concentrations of 1 g/L of NH4H2PO4 and 0.1 g/L of MgSO4, and the pH was corrected from 4 to 5 with Na2CO3. The acerola juice was then separated into different flasks: one containing approximately 4 L and the inoculums with 500 ml and 10 ml, which were used to adapt the Saccharomyces cerevisiae yeast to the medium. Before the inoculation of the yeast and after the end of fermentation process, the musts were pasteurized. The total fermentation process lasted 336 h. The wines were clarified using a 1% bentonit clay solution, were placed in 1.0 L amber-colored bottles, were chemically characterized according to the Brazilian laws, and were stored in a refrigerator at 5°C for a period of 6 months (Almeida et al., 2010; Curvelo-Santana et al., 2010a, b; Severo Jr. et al., 2007). The evaluation of the costs to obtain the product was made based on the methods introduced by Almeida et al. (2013b), Castilho et al. (2000), De Castro et al. (2010), Giraçol et al. (2011), Lopes et al. (2012) and Passarini et al. (2014).
2.2 Sensory analysis
A panel of 50 untrained members evaluated the following sensory attributes of the wines: taste, color, and aroma. The comparisons were made between the various wines prepared according to the experimental design (Table 1). Initially, the testers evaluated the appearance of the wine sample, then its aroma, and finally the taste. After each analysis, they completed a standardized questionnaire and analyzed another sample. The tasters were offered water and a biscuit to cleanse the palate between samples and avoid influences of the previous analysis in the next sample. The quantitative experimental research was conducted based on a standard form for sensory analysis and random sampling for each sensory attribute using a 9-point hedonic scale.
The results obtained were tabulated, and their mean are presented in last 3 columns of Table 1. Based on the frequency of different responses, the sensory analysis data were compared using the T Student test at 95% of confidence (Almeida et al.,
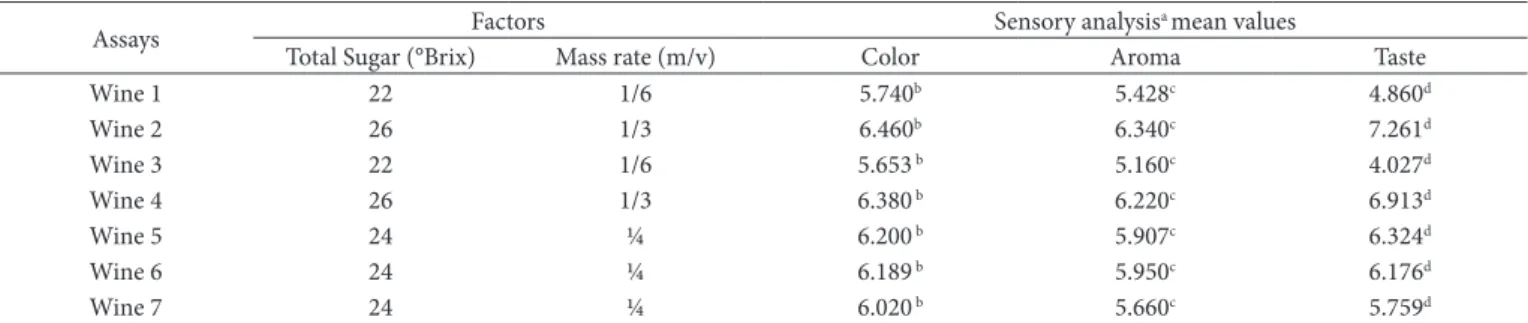
Table 1. Experimental conditions and results of sensory analysis of the acerola wines.
Assays Factors Sensory analysisa mean values
Total Sugar (°Brix) Mass rate (m/v) Color Aroma Taste
Wine 1 22 1/6 5.740b 5.428c 4.860d
Wine 2 26 1/3 6.460b 6.340c 7.261d
Wine 3 22 1/6 5.653 b 5.160c 4.027d
Wine 4 26 1/3 6.380 b 6.220c 6.913d
Wine 5 24 ¼ 6.200 b 5.907c 6.324d
Wine 6 24 ¼ 6.189 b 5.950c 6.176d
Wine 7 24 ¼ 6.020 b 5.660c 5.759d
wines do not vary significantly, which ensures that the fruit properties are maintained in acerola wines, as mentioned by (Caetano et al., 2009; Almeida et al., 2010; Curvelo-Santana et al., 2010a). The data in Table 1 show that the majority of the wines showed satisfactory sensory analysis results since all attributes were given a score close to 6. According to the T Student, there was no significant difference between the wines in terms of their sensory attributes since the T values calculated varied from 0.02 to 0.36, which are much lower than the values shown in the student’s T distribution table (2.86), according to (Almeida et al., 2010, 2012b, c, 2013a; Curvelo-Santana et al., 2010a; Severo Jr. et al., 2007).
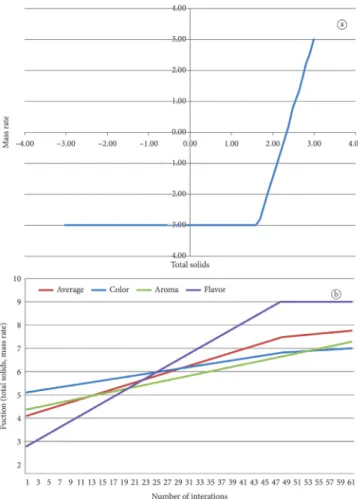
Figure 1 shows the performance of the algorithm during the search for the best values that fit to the experimental data. Figure 1a shows the search algorithm considering the objective costs. The minimum cost for producing acerola wine, given by
Equation 2, was obtained based on current information about sugar and acerola fruit process in the Brazilian market (Centro de Abastecimento e Logística de Pernambuco, 2013; Centro de Estudos Avançados em Economia Aplicada, 2013).
0.866 * 0.4493 *
100
TotalSolids
WineCost= MassRate+ (2)
The average monthly wage paid per employee (US$ 763.55) and the fee charged (38%) for these salary payments are based on the Brazilian micro-company laws (Almeida et al., 2013b; Lopes et al., 2012). The sale price of machines, tanks, and other machinery are available at Maquinas Sigma (2013) site; the other values were obtained from (Almeida et al., 2013b; Giraçol et al., 2011; Passarini et al., 2014). The minimum price of acerola wine (Equation 5) was calculated by the substituting wage (Equation 3) and fixed cost (Equation 4) in Equation 5, as follows.
763.55 * (1 0.38) *
WageCost= + Employeers (3)
infrastructure Equipment
Maintenance
FixedCost
Depreciation
= + +
+
∑
∑
∑
∑
(4)WineCost WageCost FixedCost
Minimum Price
ProductionCapacity
+ +
= (5)
The selling price, given by Equation 6, takes into account the minimum price (Equation 5) and the rates.
The total percentage including tax, shipping, commissions, and advertising was 38%, and a makeup range of 25% was used in calculation (Almeida et al., 2013b; De Castro et al., 2010; Lopes et al., 2012).
_
.
[1 ( )]
Minimum price Selling price
Total percents makeup
=
− + (6)
3 Results and discussion
The wines obtained have the color and aroma characteristics of acerola, light body and sweet flavor; the fruit characteristics were retained to a great extent. The values obtained in the analysis of the physicochemical characteristics of the acerola wines were the following: reducing sugars, 6.670±0.780 g/L; total acidity, 5.798±0.780 meq/ L; volatile acidity (meq/ L), 0.139±0.121 meq/ L; pH, 3.0±0.5; total suspended solids, 4.123±0.126%; and alcohol content at 20°C, 11.0±0.5°GL. It could be observed that all chemical characteristics were within the Brazilian standard range (Almeida et al., 2010; Curvelo-Santana et al., 2010; Severo Jr. et al., 2007). According to Teófilo et al. (2011), the anti-oxidant properties of pasteurized
Figure 1. Simulated annealing performance during optimization process. a) algorithm search for finding the optimal path and b) number of iterations to obtain the best conditions.
Table 2. Fixed monthly cost.
Item Quantity Cost per unity
(US$/month)
Fixed Cost (US$/month)
Depreciation (US$/month)
Maintenance Cost (US$/month)
Rent a Shed 1 985.22 985.22 - 39,41
fermentation tanks 4 125 246.30 24.63 9.85
Others 1 100 49.26 4.93 1.97
However, an increase in the mass ratio tends to saturate the fermentation media, reducing water activity and consequently the efficiency of ethanol production by microorganisms (Almeida et al., 2010; Curvelo-Santana et al., 2010a; Severo Jr. et al., 2007). In addition, the cost of wine is heavily influenced by the acerola price; thus, the lowest weight of acerola pulp was used to complete the optimization.
Thus, at the minimum weight condition, it is possible to obtain a maximum values of all attributes in hedonic scale. Total solid content varied from a minimum to a maximum value to obtain a condition of high sensory evaluation for taste, aroma function and the limits established for its variables. Figure 1b
shows the total number of iterations until the optimum condition is found by the algorithm. As can be seen, the best performance of the algorithm was reached after 48 iterations
Figures 2, 3 and 4 show the search for the optimal conditions of color, aroma, and taste to obtain a maximum acceptance by consumers of wine using the simulated annealing algorithm. Figure 2 shows the best conditions that were found to any value of acerola weight ratio and high levels of total solids. The same tendency was observed in Figures 3 and 4 for taste and aroma, respectively.
Figure 2. Simulated annealing searching the optimal condition for the color attribute.
Figure 3. Simulated annealing searching the optimal condition for the aroma attribute.
Figure 4. Simulated annealing searching the optimal condition for the taste attribute.
Using simulated annealing, the best conditions were found for weight ratio between 1/7.5-1/6 and total solids between 28.56-29.00 °Brix, at which the lowest producing cost and sensory acceptance values of 6.89±0.03, 6.84±0.04 and 8.83±0.10 were obtained for color, aroma, and flavor, respectively.
After calculation of minimum price, fixed cost, and other fees, the sale price of acerola wine was estimated between US$ 1.16 and US$ 1.25 per liter, which was 43-45% less than that of traditional wines commercialized in Brazil.
Acknowledgements
The authors are grateful for the financial support provided by CNPq (Brasilia, Brazil), FundoVerde-Amarelo (FINEP-EMDAGRO convention), and UNINOVE.
References
Almeida, S. S., Narain, N., Souza, R. R., & Santana, J. C. C. (2010). Optimization of processing conditions for wine production from acerola (Malpighia glabra L.). Acta Horticulturae, 864, 471-478. Almeida, P. F., Alves, W. A. L., Farias, T. M. B., & Santana, J. C.
C. (2012a). Preparation and sensorial classification of gelatins from chicken feet: correlation using artificial neural networks. Información Tecnológica, 23(6), 129-136. http://dx.doi.org/10.4067/ S0718-07642012000600014
Almeida, P. F., Araújo, M. G. O., & Santana, J. C. C. (2012b). Collagen extraction from chicken feet for jelly production. Acta Scientiarum: Technology, 34(3), 345-351.
Almeida, P. F., Salles, J. A. A., Farias, T. M. B., & Santana, J. C. C. (2012c). Use of chicken feet as an alternative to the reduce waste from slaughterhouse. Información Tecnológica, 23(4), 45-52. Almeida, P. A., Calarge, F. A., & Santana, J. C. C. (2013a). Production of
a product similar to gelatin from chicken feet collagen. Engenharia Agrícola, 33(6), 1289-1300. http://dx.doi.org/10.1590/S0100-69162013000600021
Almeida, P. F., Silva, J. R., Lannes, S. C. S., Farias, T. M. B., & Santana, J. C. C. (2013b). Quality assurance and economical feasibility of an innovative product obtained from a byproduct of the meat industry in Brazil. African Journal of Business Management, 7(25), 2410-2419. Benvenga, M. A. C., Araújo, S. A., Librantz, A. F. H., Santana, J. C. C.,
& Tambourgi, E. B. (2011). Application of simulated annealing in simulation and optimization of drying process of Zea mays malt.
Engenharia Agrícola, 31(5), 940-954. http://dx.doi.org/10.1590/
S0100-69162011000500012
Biazus, J. P. M., Santana, J. C. C., Souza, R. R., & Tambourgi, E. B. (2010). Purification of amylases from Zea mays malt. Ciência e Tecnologia de Alimentos, 30(1), 218-223. http://dx.doi.org/10.1590/ S0101-20612010000100032
Caetano, A. C. S., Melo, E. A., Lima, V. L. A. G., Maciel, M. I. S., & Araújo, C. R. (2009). Extraction of antioxidants from agro-industrial acerola waste. Brazilian Journal of Food Technology, 12(2), 155-160. http://dx.doi.org/10.4260/BJFT2009800900006
Castilho, L. R., Polato, C. M. S., Baruque, E. A., Sant’Anna Jr., G. L., & Freire, D. M. G. (2000). Economic analysis of lipase production by Penicillium restrictum in solid-state and submerged fermentations.
Biochemical Engineering Journal, 4(3), 239-247. http://dx.doi.
org/10.1016/S1369-703X(99)00052-2
and color. In the circled regions in Figures 2, 3 and 4, the best conditions were found for mass rate varying between 1/7.5-1/6 and total soluble solids content between 28.56-29.00 °Brix, where the set of values of 6.89±0.03, 6.84±0.04 and 8.83±0.10 were obtained, respectively, for color, aroma, and taste.
Figure 5 shows the algorithm search on the surface corresponding to the production costs of acerola wine since the cost function is independent of the sensory functions, a low price was set without affecting the sensory quality of the wine. As can be seen in Figure 5, the weight of the fruit strongly influences the production costs of wine. Under the best conditions, the cost of acerola wine ranged between US$ 0.24 and US$ 0.27 per liter.
Using the data available for the calculation of the minimum price and costs, a minimum price between US$ 0.43-0.46 per liter, wage of US$ 6322.17, and a fixed cost of US$ 1137.93 per month can be obtained. Since the fees charged in Brazil due to tax, shipping, commissions, and advertising are 38% and the regular profit is 25%, the estimated sale prices of acerola wine are between US$ 1.16 and US$ 1.25 per liter.
The cheapest wines produced from grape (traditional wine) are sold for US$ 2.46 per liter in Brazilian supermarkets. This shows that the wine produced in this study costs 43 to 45% less than the traditional wines sold in the Brazilian market; and since their flavor, aroma, and appearance were better than those of other wines, consumer acceptance should be high, which will facilitate their commercialization. If this happens, wine production and supply will have to be increased, and therefore, more acerola fruit will have to be produced, benefiting all participants in the production chain of this wine.
Using response surface methodology (RSM) and Kohonen neural network, Almeida et al. (2010) and Curvelo-Santana et al. (2010a), respectively, showed that an increase in the °Brix of the must influenced the sensory attributes of appearance, aroma, and taste of the acerola wine obtained, which were rated between 6 and 7 in the hedonic scale; but the acerola weight had no influence on the acceptance of the wine obtained. However, in the present study, it was found an influence of the acerola weight on the sensory attributes and on the production cost of wine.
Using the demand function, Troncoso-Valverde (2004) found that more wine varieties affect domestic consumer preferences by changing the product diversity available in the domestic market of wines commercialized in Chile.
Thus, a wine variety with high anthocyanins and C vitamins (nutraceutical properties) and low cost price, could force other companies to lower the prices of their wines to be competitive because according to Miele et al. (2007), low added value and good quality wine can make the company very competitive.
4 Conclusion
Máquinas Sigma. Sale of machines. (2013). São Paulo. Retrieved from www.maquinasinox.com.br
Mezadri, T., Villano, D., Fernández-Pachón, M. S., García-Parrilla, M. C., & Troncoso, A. M. (2008). Antioxidant compounds and antioxidant activity in acerola (Malpighia emarginata DC.) fruits and derivatives. Journal of Food Composition and Analysis, 21(4), 282-290. http://dx.doi.org/10.1016/j.jfca.2008.02.002
Miele, M., Coldebella, A., Waquil, P. D., & Miele, A. (2007). Segments of competition in south brazilian wineries. Scientia Agricola, 64(3) 227-234. http://dx.doi.org/10.1590/S0103-90162007000300003 Oliveira, M. S., Cipolatti, E. P., Furlong, E. B., & Siares, L. S. (2012).
Phenolic compounds and antioxidant activity in fermented rice (Oryza sativa) bran. Ciência e Tecnologia de Alimentos, 32(3), 531-537. http://dx.doi.org/10.1590/S0101-20612012005000071 Passarini, K. C., Pereira, M. A., Farias, T. M. B., Calarge, F. A., &
Santana, C. C. (2014). Assessment of the viability and sustainability of an integrated waste management system for the city of Campinas (Brazil), by means of ecological cost accounting. Journal of
Cleaner Production, 65, 479-488. http://dx.doi.org/10.1016/j.
jclepro.2013.08.037
Sargi, S. C., Silva, B. C., Santos, H. M. C., Montanher, P. F., Boeing, J. S., Santos Júnior, O. O., Souza, N. E., & Visentainer, J. V. (2013). Antioxidant capacity and chemical composition in seeds rich in omega-3: chia, flax, and perilla. Food Science and Technology, 33(3), 541-548.
Severo Jr., J. B., Almeida, S. S., Narain, N., Souza, R. R., Santana, J. C. C., & Tambourgi, E. B. (2007). Wine clarification from spondias mombin l. pulp by hollow fiber membrane system. Process
Biochemistry, 42(11), 1516-1520. http://dx.doi.org/10.1016/j.
procbio.2007.08.003
Souza, V. L. F., Sasaki, J. Y., Franco, M. L. R. S., Barbosa, M. J. B., & Cardozo, R. M. (2012). Processing, physicochemical, and sensory analysis of ostrich meat hamburger. Ciência e Tecnologia de Alimentos, 32(3), 50-454.
Teófilo, J. S. C., Bernardo, G. L., Silva, E. L., & Proença, R. P. C. (2011). Heating of red wine and grape juice in food preparations does not affect their antioxidant capacity and total phenol content. Revista
de Nutrição, 24(1), 153-159.
http://dx.doi.org/10.1590/S1415-52732011000100015
Troncoso-Valverde, C. (2004). Preference shifts, structural breaks and the domestic demand for Chilean wine. Revista de Economia e Sociologia Rural, 42(3), 487-508. http://dx.doi.org/10.1590/S0103-20032004000300005
Centro de Abastecimento e Logística de Pernambuco - CEASA/PE. (2013). Daily quote. Recife: CEASA/PE. Retrieved from http://www. ceasape.org.br/verCotacaoOrganicos.php?tipo=organicos Centro de Estudos Avançados em Economia Aplicada - CEPEA. (2013).
Indicador açúcar cristal CEPEA/ESALQ - São Paulo. Piracicaba: CEPEA. Retrieved from http://www.cepea.esalq.usp.br/acucar Cuquel, F. L., Oliveira, C. F. S., & Lavoranti, O. J. (2012). Sensory profile of
eleven peach cultivars. Ciência e Tecnologia de Alimentos, 32(1), 70-75. http://dx.doi.org/10.1590/S0101-20612012005000011
Curvelo-Santana, J. C., Dias, C. G., Souza, R. R., & Tambourgi, E. B. (2010a). Applying of neural network on the wine sensorial
analysis from Barbados cherry. Journal of Food Process
Engineering, 33(Suppl. 1), 365-378. http://dx.doi.org/10.1111/
j.1745-4530.2009.00521.x
Curvelo-Santana, J. C., Ehrhardt, D. D., & Tambourgi, E. B. (2010b). Optimizing of alcohol production from manioc starch. Ciência e Tecnologia de Alimentos, 30(3), 613-617. http://dx.doi.org/10.1590/ S0101-20612010000300007
De Castro, A. M., Carvalho, D. F., Freire, D. M. G., & Castilho, L. R. (2010). Economic analysis of the production of amylases and other hydrolases by Aspergillus awamori in solid-state fermentation of babassu cake. Enzyme Research, 2010.
Dias, N. A. A., Lara, S. B., Miranda, L. S., Pires, I. S. C., Pires, C. V., & Halborth, N. V. (2012). Influence of color on acceptance and identification of flavor of foods by adults. Ciência e Tecnologia
de Alimentos, 32(2), 296-301.
http://dx.doi.org/10.1590/S0101-20612012005000059
Giraçol, J., Passarini, K. C., Silva Filho, S. C., Calarge, F. A., Tambourgi, E. B., & Santana, J. C. C. (2011). Reduction in ecological cost through biofuel production from cooking oils: an ecological solution for the city of Campinas, Brazil. Journal of Cleaner Production, 19(12), 1324-1329. http://dx.doi.org/10.1016/j.jclepro.2011.02.015
Kawaguchi, M., Tanabe, H., & Nagamine, K. (2007). Isolation and characterization of a novel flavonoid possessing a 4,2”-glycosidic linkage from green mature acerola (Malpighia emarginata DC.) fruit. Bioscience, Biotechnology, and Biochemistry, 71(5), 1130-1135. http://dx.doi.org/10.1271/bbb.60513
Kirkpatrick, S., Gelatt, C. D., & Vecchi, M. P. (1983). Optimization by simulated annealing. Science, 220(4598), 671-680. PMid:17813860. http://dx.doi.org/10.1126/science.220.4598.671