Comparison between simulated annealing algorithms and rapid chain
delineation in the construction of genetic maps
Moysés Nascimento
1, Cosme Damião Cruz
2, Luiz Alexandre Peternelli
1and Ana Carolina Mota Campana
1 1Departamento de Estatística, Universidade Federal de Viçosa, Viçosa, MG, Brazil.
2
Departamento de Biologia Geral, Laboratório de Bioinformática, Universidade Federal de Viçosa,
Viçosa, MG, Brazil.
Abstract
The efficiency of simulated annealing algorithms and rapid chain delineation in establishing the best linkage order, when constructing genetic maps, was evaluated. Linkage refers to the phenomenon by which two or more genes, or even more molecular markers, can be present in the same chromosome or linkage group. In order to evaluate the ca-pacity of algorithms, four F2co-dominant populations, 50, 100, 200 and 1000 in size, were simulated. For each
popu-lation, a genome with four linkage groups (100 cM) was generated. The linkage groups possessed 51, 21, 11 and 6 marks, respectively, and a corresponding distance of 2, 5, 10 and 20 cM between adjacent marks, thereby causing various degrees of saturation. For very saturated groups, with an adjacent distance between marks of 2 cM and in greater number,i.e., 51, the method based upon stochastic simulation by simulated annealing presented orders with distances equivalent to or lower than rapid chain delineation. Otherwise, the two methods were commensurate through presenting the same SARF distance.
Key words:better order; genetic mapping; genomic analyses; stochastic optimization.
Received: July 24, 2009; Accepted: November 17, 2009.
Introduction
Genetic mapping favors breeding activities, by asso-ciating one or more marks to those genes of economic inter-est and/or control quantitative characteristics (QTL), with a reasonable chance of use in assisted selection, hence the ex-treme importance of the precise construction of genetic maps in the successful introduction of strategies in breed-ing programs.
One of the most important stages in the construction of linkage maps is the ordering of the genetic markers within each linkage group (Mollinariet al., 2008). It is said that two or more genes, or molecular markers, are con-nected if they belong to the same chromosome or linkage group.
Several methods for ordering markers are mentioned in the literature, such as rapid chain delineation (Doerge, 1996), seriation (Buetow and Chakravarti, 1987a,b), simu-lated annealing (Kirkpatricket al., 1983) and branch and bound (Thompson, 1987). Rapid chain delineation consists of obtaining a preliminary order for loci based upon a re-combination matrix of all the pairs of marks. Successive in-versions are then attempted with triple marks, in order to
minimize the sum of adjacent recombination fractions (SARF). Seriation is a simple method, in which a set of rules is proposed, based upon the recombination fractions between two loci (Liu, 1998). The method of branch and bound is based on a tree structure, a recombinant number being calculated for each branch. Simulated annealing, a stochastic simulation method, corresponds to the famous MCMC method (Markov Chain Monte Carlo, specifically the Metropolis-Hastings Algorithm), modified in such a way as to become an optimization algorithm. In order to ar-rive at an ordering solution through these methods, several criteria may be used, namely the minimum Sum of Adja-cent Recombination Fractions (SARF) (Falk, 1992), the minimum Product of Adjacent Recombination Fractions (PARF) (Wilson, 1988), and the maximum Sum of Adja-cent LOD Scores (SALOD) (Weeks and Lange, 1987).
Several studies using genetic mapping as a basis for breeding are to be found in the literature. The study of Silva
et al.(2008) intended to map and detect QTLs in chromo-some 4 of swine, and associate these with the carcass and characteristics of internal organs in an F2 population. Miyataet al.(2007) investigated the presence of QTLs in BTA14 chromosomes, by weight at birth and after 60 days, also in an F2 experimental station. Soareset al.(2008) also aimed to detect QTLs related to protein content in soybean cultivated in two divergent tropical environments, thereby
www.sbg.org.br
Send correspondence to Moysés Nascimento. Departamento de Estatística, Universidade Federal de Viçosa, Av. P.H. Rolphs, s/n,
36571-000 Viçosa, MG, Brazil. E-mail:
constructing a genetic map of genotypes adapted to tropical conditions.
In spite of the outstanding significance of ordering markers when constructing linkage maps, and of the nu-merous methods designed to provide solutions for the prob-lem of ordering itself, it is difficult to find works which present comparative analyses of these methods. Mollinari
et al. (2008) compared the rapid chain delineation and seriation methods, and concluded that final results were alike.
Thus, the aim hereby was to evaluate the efficacy of both the simulated annealing and rapid chain delineation methods, in establishing the most efficient linkage order when constructing genetic maps. The study was so devel-oped as to capacitate its competent reproduction and use in research. The problem of mark ordering is described as the problem of the traveling salesman.
Material and Methods
In order to create a real situation and compare the effi-ciency of the methods, four F2co-dominant populations in
various sizes (50, 100, 200 and 1000) were simulated. Genomes were generated for each population, with four linkage groups, each 100 cM in size. There were 51, 21, 11 and 6 marks in each linkage group, with distances of 2, 5, 10 and 20 cM, respectively, between adjacent marks, thus causing various degrees of saturation. The groups were composed of:
• First linkage group: marker 1 (m1), marker 2 (m2), ...,
marker 51 (m51), with intervals between adjacent marks of
2 cM;
• Second linkage group: marker 52 (m52), marker 53
(m53),..., marker 72 (m72), with intervals between adjacent
marks of 5 cM;
• Third linkage group: marker 73 (m73), marker 74
(m74),..., marker 83 (m83), with intervals between adjacent
marks of 10 cM;
• Fourth linkage group: marker 84 (m84), marker 85
(m85),..., marker 89 (m89), with intervals between adjacent
marks of 20 cM.
The “Complex Genome Simulation” module GQMOL (Cruz, 2007) for computing application was used in obtaining the above populations.
The problem of mark ordering by performing the analogies necessary for solving the traveling salesman problem, can be described in the following way: let
I= {1, ...,k} be a set of indices and M = {mi:iÎI} a set of
markers indexed byi. Consider thatDijrepresents the
dis-tance between the markermiand the markermjand defineL
as a set of all the possible permutations of the elements of the M set. An M element will be denoted by
xm =(ms1, , msk )
K , where (si, ...,sk) is a permutation of
the elements of setI. A permutationxmÎ Lcan be
under-stood as an order to by-pass all the markers. The problem is
to find an order that minimizes the distance necessary to by-pass all the markers only once, without the need of re-turning to the origin.
Letf(xm) be the function that associates SARF, or the
total distance covered, to each orderxmÎ L, or, in other
words, f xm D
i K i ( )= , + =
-å
s s1 11 1
, whereD
i
s s1, +1is the distance
be-tween the marksm
i
s andmsi+1. The objective is to find the
xmÎ Lorder that minimizesf(xm). Simulated annealing and
rapid chain delineation algorithms were used for obtaining a numeric approximation for the solution of this problem.
Simulated annealing is a small modification in the fa-mous MCMC algorithm of Metropolis-Hastings (Hastings, 1970), thereby transforming it into an optimization algo-rithm, known as simulated annealing (Kirkpatrick et al., 1983). The main idea inherent in this method is borrowed from physics. In condensed matter physics, annealing is the thermic process used to minimize the free energy of a solid. Informally, the process may be described as occurring in two stages: (i) an increase in temperature to melting; (ii) followed by a slow decrease in temperature until particle re-organization in a state of minimum energy. This physical process may be simulated computationally by using the Metropolis-Hastings algorithm.
Suppose that the current state of the solid isxand that the energy of this state isH(x). A candidate stateyof energy
H(y) is generated by applying slight perturbation to statex. The following probability is used in the decision-rule for accepting the candidate state:
a
T x y
H y H x T
( , )=min ,expæ- ( )- ( )
è ç ö ø ÷ æ è ç ö ø ÷ 1 ,
withTindicating temperature. If cooling is slow, the solid reaches thermic balance at each temperature. From the point of view ‘simulation’, this means generating several transactions at a certain temperatureT(Robert and Casella, 2004).
For the problem of marker ordering, there is the fol-lowing analogy:
• The solutions of problem ordering (optimization), or, in other words, the elementsxmÎ L, are equivalent to
the physical states ofx;
• The function f:L ® Â(SARF) is equivalent to the function ‘soil energy’,H(x);
• A candidate orderymof distance given by f:L ® Â
is equivalent to a candidate stateyof energyH(y); • A control parameterc > 0 is equivalent to the tem-perature.
Letxm0 be an initial order,c0the initial control
param-eter andL0the initial number of iterations used for an equal
value ofc0. Simulated annealing can thus be described in
the following manner:
1) Choosen= 0,xm =xmn Î L,c0andL0;
• Generateymin the neighborhood ofxmand generate
a random variableX~U(0, 1); • Iff(ym)£f(xm), thenxm¬ym;
• Iff(ym) >f(xm) andU
f y f x c
m m
n
< æ-
-è
çç ö
ø ÷÷
exp ( ) ( ) , then
xm¬ym;
• End of operation;
n¬n+ 1
DefinecnandLn, and return to step 2 until the ‘stop’
criterion, whereLnis the number of chain transactions in
each temperature (cn).
The rapid chain delineation algorithm (Doerge, 1996) constitutes a simple way of molecular marker ordering within linkage groups. This algorithm can be described in the following manner:
1) Verify for which pairs of markers (mi,mj) the
esti-mate of recombination fractions between pairs is the low-est. These markers will start the chain;
2) Verify which is the unmapped marker (mk)
present-ing the lowest estimate of recombination fractions with one of the terminal markers. Place the two together accord-ingly;
3) Repeat the procedure until all the markers are added to the chain;
4) Then, attempt successive inversions in double and triple marks, in order to minimize SARF (the sum of adja-cent recombination fractions).
One hundred repetitions were carried out with the sto-chastic simulation algorithm, simulated annealing, and the results compared to those provided by the rapid chain
eation method. The criterion used for reaching this solution was minimum SARF.
Results and Discussion
The results obtained with GQMOL software, which finds the solution for the problem through the rapid chain delineation method, are presented in Figures 1, 2, 3 and 4. For numeric approximation of the solution to the marker or-dering problem, when using the simulated annealing algo-rithm, it is necessary to define a neighborhood system inL, or, in other words, a candidate permutation of markers. A system was adopted in which the typical neighbor (candi-date order) of an order
xm m mi mi m j m j mk
=
+
-( s1,K, s , s 1,K, s 1,K, s ,K, s )
was defined as
ym m mi m j m j mi m j mk =
- - +
( s1,K, s , s 1, s 2,K, s 1, s ,K, s ).
During the application of the algorithm, it was de-fined to uniformly choose an orderymin the set of possible
orders. The algorithm was implemented in theRversion 2.7.1 programming language (R DEVELOPMENT CORE TEAM, 2007). An Intel Core 2 Duo T5750 2.0 GHz proces-sor was used with a 3 Gb RAM memory, Windows XP SP2. The parameter of control in thenthalgorithm iteration, denoted bycn, was calculated based upon the expression
c A
m
n = +
ln( 1)2,
wheremis the number of iterations of the algorithm andA
is a constant chosen in a convenient form, described as fol-lows:
The choice ofAis undertaken in such a way that the simulated annealing algorithm escapes from the minimum places of interest function (SARF) to reach the global mini-mum. Therefore, constant A must be chosen in such a way that all the initial orders are accepted. In the present case, 2 was considered as the value of this constant.
One hundred repetitions were carried out, with a com-parison of the best result from simulated annealing to that from the rapid chain delineation method.
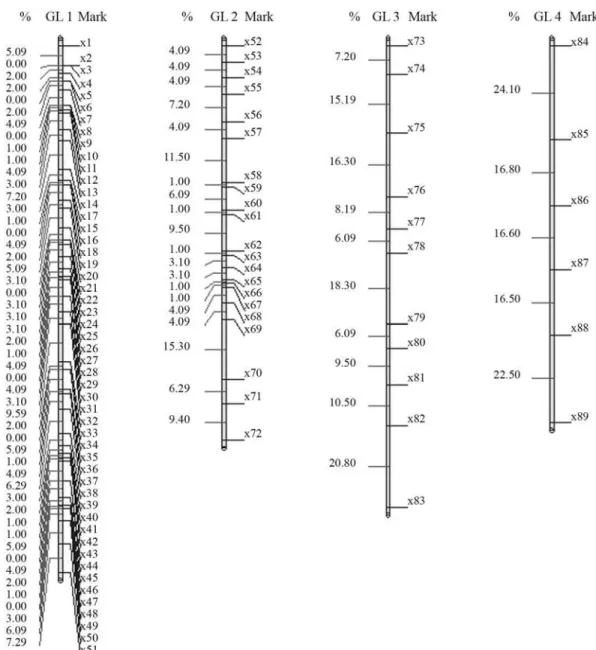
The final results through simulated annealing for a population composed of 50 individuals in linkage group 1, and as a numeric solution, is given by the following order,
m3,m2,m4,m5, ...,m14,m15,m17,m16,m18,m19, ...,m32,m34, m33,m1,m35,m36, ...,m49,m50,m51, with a total SARF
dis-tance of 129,90 cM, thus being of smaller size than the 135,00 cM from rapid chain delineation (Figure 1). For the second, third and fourth linkage groups, the solutions
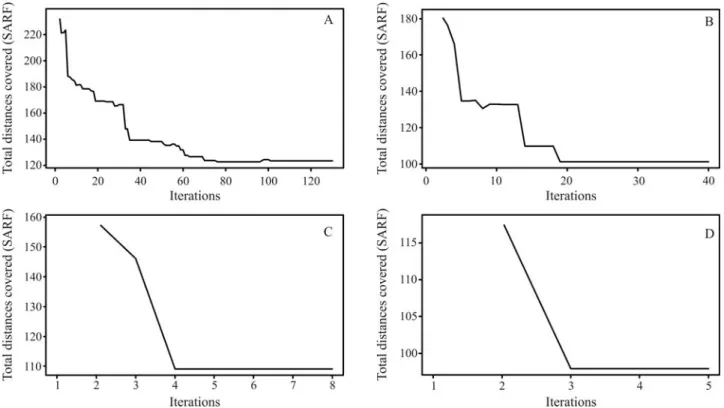
ob-tained through simulated annealing are the same as those by the method implemented in the GQMOL program, also ap-parent in Figure 1, with distances of 101,10 , 118,20 and 96,50, respectively. Figure 5 shows the evolution of total distances of algorithmic iteration in each of the linkage groups analyzed.
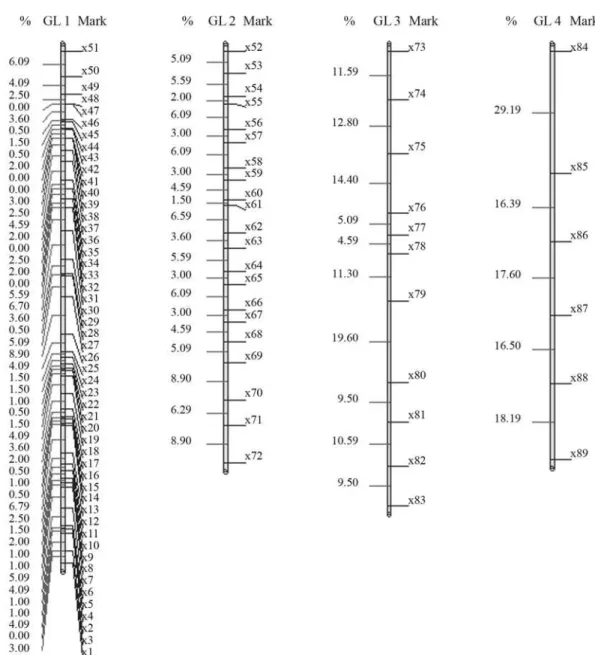
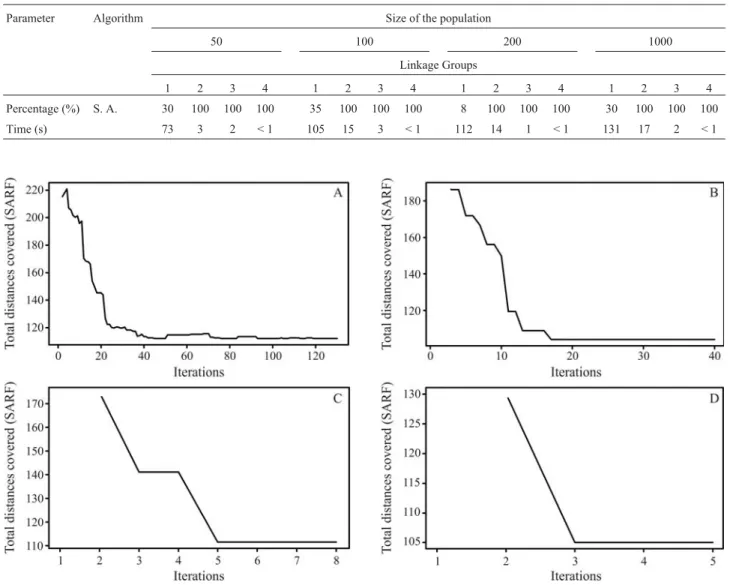
For a population with 100 individuals, the solution obtained for the first linkage group is given by the follow-ing order:m51,m50, ...,m22,m21,m19,m20,m1,m18,m17, ..., m3,m2. In this order, SARF is 117,60 cM. On comparing
this specific solution with that from rapid chain delineation (Figure 2), it can be seen that the total distance is shorter in the former than in the latter method (122,70 cM). The solu-tions obtained for linkage groups 2, 3 and 4 by simulated annealing are the same as those found by way of the rapid chain delineation method, with a total distance of 98,70, 109,00 and 97,90 cM, respectively. These orders are
sented in Figure 2. Figure 6 shows the evolution of total al-gorithmic iteration distances in each of the linkage groups analyzed.
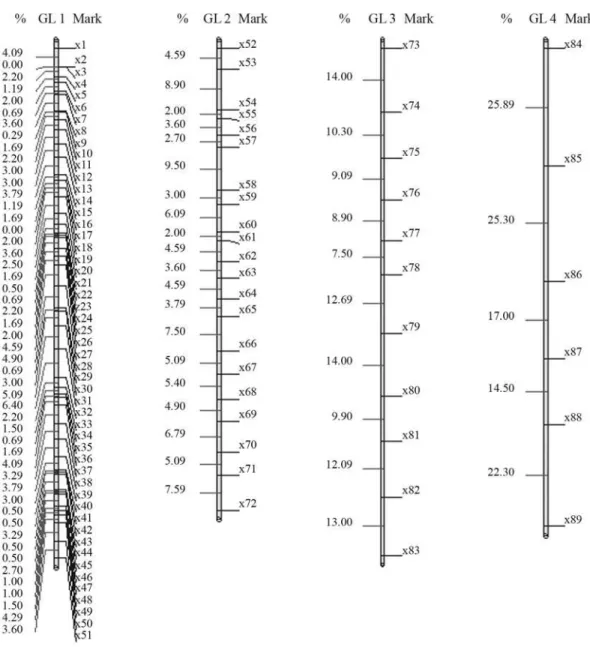
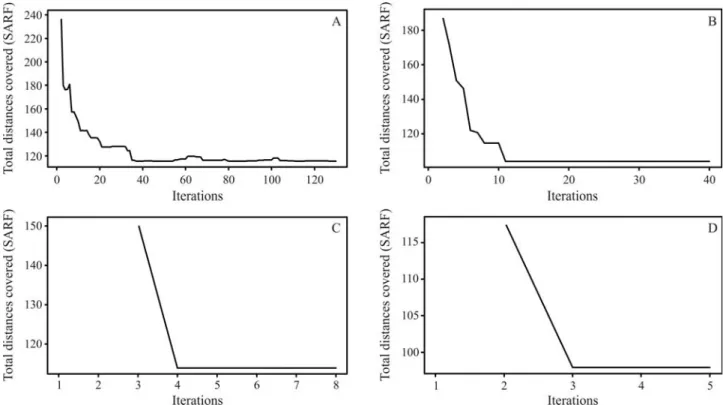
On considering a population of 200 individuals, the numeric solution for the first linkage group, when employ-ing stochastic optimization, is given by the followemploy-ing order:
m51,m50, ...,m46,m45,m43,m44,m42,m41, ...,m20,m19,m1, m18,m16,m17,m15,m14, ...,m2,m3, with a total distance of
108,40 cM, thus smaller than that provided by the method implemented in the GQMOL program, whereby the SARF value was 112,00 cM. The corresponding numeric order is presented in Figure 3. As regards the three remaining link-age groups, the solutions arrived at by both methods are identical, and are also perceptible in Figure 3. These orders presented total distances of 101,40, 111,50 and 105,00 cM, respectively. The evolution of total distances of algorithmic
iterations in each linkage group analyzed can be seen in Figure 7.
According to Ferreiraet al.(2006), a total of 200 in-dividuals is considered large enough for constructing rea-sonably precise genetic maps. They evaluated F2
popula-tions with dominant and co-dominant markers, backcrossing, recombinant inbred lines (RIL) and dou-ble-haploid. Nevertheless, on comparison, algorithmic performance in simulated annealing was superior to that in rapid chain delineation, even with sufficiently large populations.
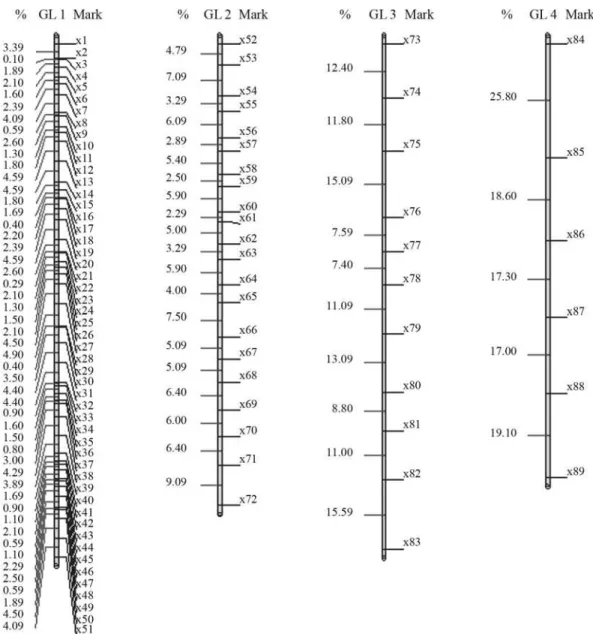
The analysis of a population of 1000 individuals re-vealed that the order established by the rapid chain delinea-tion method was identical to that from a populadelinea-tion of 200 individuals, thus corroborating the results by Ferreiraet al., (2006). Nevertheless, application of the algorithm of simu-lated annealing gave rise to the following order as a
meric solution:m51,m50, ...,m19,m1,m18,m17, ...,m3,m2.
The total distance was 112,30 cM, thus shorter than that arising from the other method evaluated (SARF) of
115,60 cM. The numeric order appears in Figure 4. The so-lutions found in the other linkage groups are mutually equivalent (Figure 4).
Figure 5- Evolution of the total distances at each algorithm iteration in each population of 50 individuals. (A) linkage group 1 (B) linkage group 2 (C) linkage group 3 (D) linkage group 4.
The total distances for these orders are 104,10, 113,90 and 97,80 cM, for the second, third and fourth linkage groups, respectively. The evolution of the total distances of algorithmic iteration in the linkage groups was analyzed (Figure 8).
In all the cases studied, execution of simulated an-nealing took less than 131 s, at the most (Table 1). As rapid chain delineation is a deterministic method, no repetitions were used, the time-span not exceeding 5 s in the various cases studied. The percentage of times, in 100 repetitions, that results from simulated annealing were higher (lowest SARF value) than those from rapid chain delineation, are presented in Table 1. As can be observed, in the first link-age group of each population, results from simulated an-nealing were higher in less than 50% of the cases, although there were orders with a lower SARF value in the same groups.
Figures 5, 6, 7 and 8 demonstrate that the number of necessary iterations for the algorithm to obtain a satisfac-tory result depends on the number of markers in the study, since the higher the number of marks in the linkage group, the higher the number of iterations.
It is obvious from the data that, in the case of the most saturated linkage groups, namely those with shorter dis-tances between adjacent marks, viz., 2 cM, achievements through simulated annealing were similar or better than those by rapid chain delineation in less than 50% of the rep-etitions. Nevertheless, on considering the criterion used for constructing linkage maps,i.e.the lowest SARF value, the former proved to be more efficient. Such a superior perfor-mance can also be explained by the number of markers, for, as the algorithm in question is stochastic, the higher the number of markers, the more efficient the method when compared to rapid chain delineation, ultimately leading to
Figure 7- Evolution of total distances at each algorithm iteration in each population of 200 individuals. (A) linkage group 1 (B) linkage group 2 (C) link-age group 3 (D) linklink-age group 4.
Table 1- The average time spent on simulated annealing (S.A.), and the percentage of times when the results were higher than those from rapid chain de-lineation in 100 repetitions.
Parameter Algorithm Size of the population
50 100 200 1000
Linkage Groups
1 2 3 4 1 2 3 4 1 2 3 4 1 2 3 4
Percentage (%) S. A. 30 100 100 100 35 100 100 100 8 100 100 100 30 100 100 100
the possibility of analyzing a higher number of possible or-ders, as occurred here. As to the other linkage groups, with lower saturation levels and consequently less markers, re-sults were similar with the two methods.
Furthermore, the number of individuals constituting the population has no effect on results when using the algo-rithm, since recombination frequencies, previously calcu-lated for each pair of markers, are fundamental when ordering. So, the number of individuals exerts an influence only on the precision of estimates, but not on the ordering, thereby possibly leading to the construction of imprecise linkage maps. According to Mollinariet al., (2008), it was concluded that the rapid chain delineation and the seriation methods are both equivalent, whereby it is possible to infer that simulated annealing is also superior to the seriation method in certain situations.
Conclusions
In the present study, simulated annealing and rapid chain delineation algorithms were compared when estab-lishing the best linkage order in the construction of genetic maps, in populations of different sizes and saturation lev-els. It was observed that, for very saturated linkage groups, with an adjacent distance between marks of 2 cM, and a higher number of marks,e.g.51, the method based on sto-chastic simulation, viz., simulated annealing, presented or-ders with distances (SARF) equal to or shorter than rapid chain delineation in less than 50% of the repetitions. Never-theless, the former method appears to be more interesting
than the latter in these cases, as the criterion used for constructing linkage maps is to take into consideration the order of markers with lower SARF values. In the other cases, the two methods were alike, presenting the same SARF distances. Furthermore, it was noted that the number of individuals in the population does not affect ordering, al-though it does affect the estimates of recombination fre-quencies. The average time taken for simulated annealing execution did not exceed 112 s, thus not an obstacle for im-plementation.
The data from the present work demonstrate the rele-vance of the method used for ordering markers in the con-struction of genetic maps. Therefore, future studies should be carried out, in order to evaluate all the methods encoun-tered in the literature, and thus facilitate their use according to the situation.
Acknowledgments
We wish to thank CNPQ for granting scholarships and financial support.
References
Buetow KH and Chakravarti A (1987a) Multipoint gene mapping using seriation. I. General methods. Am J Hum Genet 41:180-188.
Buetow KH and Chakravarti A (1987b) Multipoint gene mapping using seriation. I. Analysis of simulated and empirical data. Am J Hum Genet 41:189-201.
GQMOL (2007) Application to computational analysis of molec-ular data and their associations with quantitative traits. V. 1.0.0. Universidade Federal de Viçosa, Viçosa.
Doerge R (1996) Constructing genetic maps by rapid chain delin-eation. J Quant Trait Loci 2:121-132.
Falk CT (1992) Preliminary ordering of multiple linked loci using pairwise linkage data. Genet Epidemiol 9:367-375. Ferreira A, Silva MF, Silva LC and Cruz CD (2006) Estimating
the effects of population size and type on the accuracy of ge-netic maps. Genet Mol Biol 29:187-192.
Hastings W (1970) Monte Carlo sampling methods using markov chains and their applications. Biometrika 57:97-109. Kirkpatrick S, Gelatt CD and Vecchi MP (1983) Optimization by
simulated annealing. Science 220:671-680.
Liu BH (1998) Statistical Genomics. CRC Press, New York, 611 pp.
Miyata M, Gasparin G, Coutinho LL, Martinez ML, Machado MA, Silva MVGB, Campos AL, Sonstergard TS, Rosado MF and Regitano LCA (2007) Quantitative trait loci (QTL) mapping for growth traits on bovine chromosome 14. Genet Mol Biol 30:364-369.
Mollinari M, Margarido GRA and Garcia AAF (2008) Compa-ração dos algoritmos delineação rápida em cadeia e seriação, para a construção de mapas genéticos. Pesq Agropec Bras 43:505-512 (Abstract in English).
R Development Core Team (2007) R: A Language and Environ-ment for Statistical Computing. R Fundation for Statistical Computing, Vienna.
Robert C and Casella G (2004) Monte Carlo Statistical Methods. Springer, Berlin, 645 pp.
Silva KM, Paixão DM, Silva PV, Solero BP, Pereira AMS, Lopes PS and Guimarães SEF (2008) Mapping of quantitative trait loci and confirmation of the FAT1region on chromosome 4 in an F2 population of pigs. Genet Mol Biol 31:475-480. Soares TCB, Good-God PIV, Miranda FD, Soares YJB, Schuster
I, Piovesan ND, Barros SEG and Moreira MA (2008) QTL mapping for protein content in soybean cultivated in two tropical environments. Pesq Agropec Bras 43:1533-1541. Thompson EA (1987) Crossover counts and likelihood in
multi-point linkage analysis. MA-J Math Appl Med Biol 4:93-108. Weeks D and Lange K (1987) Preliminary ranking procedures for
multilocus ordering. Genomics 1:236-242.
Wilson SR (1988) A major simplification in the preliminary or-dering of linked loci. Genet Epidemiol 5:75-80.
Internet Resources
R: A language and environment for statistical computing, http://r-project.org.
GQMOL: application to computational analysis of molecular data and their associations with quantitative traits, http://www.ufv.br/dbg/gqmol/gqmol.htm.
Associate Editor: Luciano Da Fontoura Costa