Genetic structure of Argentinean hexaploid wheat germplasm
Leonardo S. Vanzetti
1,2*, Nadia Yerkovich
1*, Eugenia Chialvo
1, Lucio Lombardo
1, Luis Vaschetto
1and Marcelo Helguera
11
Grupo Biotecnología y Recursos Genéticos, INTA EEA Marcos Juárez, Marcos Juárez, Córdoba,
Argentina.
2Consejo Nacional de Investigaciones Científicas y Técnicas, Buenos Aires, Argentina.
Abstract
The identification of genetically homogeneous groups of individuals is an ancient issue in population genetics and in the case of crops like wheat, it can be valuable information for breeding programs, genetic mapping and germplasm resources. In this work we determined the genetic structure of a set of 102 Argentinean bread wheat (Triticum aestivum L.) elite cultivars using 38 biochemical and molecular markers (functional, closely linked to genes and neu-tral ones) distributed throughout 18 wheat chromosomes. Genetic relationships among these lines were examined using model-based clustering methods. In the analysis three subpopulations were identified which correspond largely to the origin of the germplasm used by the main breeding programs in Argentina.
Keywords: wheat, genetic structure, molecular markers, genetic diversity.
Received: March 15, 2013; Accepted: May 15, 2013.
Introduction
Bread wheat (Triticum aestivum L.) is the principal winter crop grown in Argentina for both internal consump-tion and export. Genetically improved cultivars and agri-cultural practices have resulted in an increased average wheat yield during the past 41 years, from 1352 kg/ha in 1969 to more than 3500 kg/ha in 2010. To maintain this rate of wheat productivity, exploring the genetic variability at molecular levels in adaptation and yield components and integrating such information with conventional breeding methods will be critical (Chaoet al., 2007). The identifica-tions of genomic regions associated with relevant agro-nomic traits through QTL mapping using bi-parental popu-lations, can now be complemented with alternative genetic mapping strategies like Association Mapping, in which the accurate determination of the population genetic structure is important for the appropriate association between the ge-notype and the phege-notype (Breseghello and Sorrells, 2006; Penget al., 2009; Le Couviouret al., 2011).
In wheat, the assessment of genetic structure in differ-ent populations has been historically based on qualitative and quantitative traits (Spagnoletti-Zeuli and Qualset, 1987; Van Beuningen and Busch, 1997b) and pedigree re-cords (Burkhameret al., 1998; Van Beuningen and Busch,
1997a; Beredet al., 2002). However, pedigree records are not always available or detailed enough for this type of analysis, especially when large numbers of breeding lines or cultivars are being assessed. More recently, biochemical markers such as variation in storage protein subunits (Me-takovsky and Branlard, 1998; Lerneret al., 2009) and/or molecular markers like RAPDs, RFLPs, AFLPs, SSRs, DArTs and SNPs become alternative methods of obtaining a large amount of data for precisely calculating genetic re-lationship estimates (Mukhtaret al., 2002; Parker et al., 2002; Soleimaniet al., 2002; Neumannet al., 2011; Chaoet al., 2010). Particularly in Argentina the levels and patterns of genetic diversity among local wheat cultivars have been investigated using SSRs (Manifestoet al., 2001) and stor-age proteins (Lerneret al., 2009).
Frequently, the biochemical and/or molecular infor-mation has been analyzed using tree-based methods that calculate genetic distance between individuals and tree construction algorithms such as UPGMA or neighbor join-ing to group them in clusters (Sneath and Sokal, 1973; Saitou and Nei, 1987). An alternative model-based method developed recently by Pritchardet al. (2000) and imple-mented in the software Structure aims at delineating clus-ters of individuals on the basis of their genotypes at multi-ple loci using a Bayesian approach (Breseghello and Sorrells, 2006; Chaoet al., 2010). However Evannoet al. (2005) demonstrated that in most cases the estimated “log probability of data” used in Structure fails to provide a cor-rect estimation of the number of clusters, (K). Hence, they
www.sbg.org.br
Send correspondence to Marcelo Helguera. Grupo Biotecnología y Recursos Genéticos, INTA EEA Marcos Juárez, Ruta 12 s/n, 2580 Marcos Juárez, Córdoba, Argentina. E-mail: helguera.marcelo@inta.gob.ar.
*These authors contributed equally to the study.
developed an ad hoc statistic DK based on the rate of change in the log probability of data between successive K values, and found that Structure accurately detects the up-permost hierarchical level of structure. Based on these pa-rameters, Earl and von Holdt (2012) developed Structure Harvester, a website and software for visualizing the output based on Evannoet al.(2005).
In this report, we determined the genetic structure of a set of Argentinean wheat cultivars using a model-based ap-proach. 102 cultivars representative of the main breeding companies in Argentina were characterized using a set of 38 biochemical and molecular markers, each mapped to a single chromosome location and distributed over 18 of the 21 wheat chromosomes.
Materials and Methods
Plant material
A set of 102 bread wheat cultivars registered in Ar-gentina was selected to determine its genetic structure based on molecular and biochemical markers. This set in-cluded old and recent commercial cultivars selected from the main wheat breeding companies in Argentina. Seed stocks were kindly provided by the Instituto Nacional de Tecnología Agropecuaria (INTA) Marcos Juárez Wheat Germplasm Bank (Marcos Juárez, Argentina).
Genotypic data
For each accession, genomic DNA was extracted from fresh leaves of single plants using a fast, small-scale DNA isolation procedure based on Helgueraet al.(2005). Sample genotyping included: (1) functional markers Vrn-A1(Yan et al., 2004),Vrn-B1, Vrn-D1(Fuet al., 2005), Ppd-D1 (Bealeset al., 2007),Rht-B1, Rht-D1(Elliset al., 2002),PinA-D1(Gautieret al., 1994),Glu-A3(Zhang et al., 2004), Wx-A1andWx-B1 (McLauchlanet al., 2001, Vanzettiet al., 2009),Vp1-B3(Yanget al., 2007),Ppo-A1 andPpo-D1(Heet al., 2007), 7oe+8* (Butowet al., 2004); (2) molecular markers closely linked to genesLr10 (Scha-chermayret al., 1997),Lr34(Lagudahet al., 2006),Lr24 (Schachermayret al., 1995) andPpd-B1(Díazet al., 2012); and (3) 17 SSR markers selected according to information available in the GrainGenes database (Matthews et al., 2003) and one ISBP marker newly developed for this work. In all cases, polymerase chain reactions (PCR) were per-formed in 25mL aliquots in a PTC-100 thermal cycler (MJ Research Inc., Waltham, MA, USA). The reaction con-tained 100 ng of genomic DNA (template), 1XTaq poly-merase buffer (Promega Corp. Madison, WI, USA), 1 U TaqDNA polymerase (Promega), 0.2 mM of each deoxy-nucleotide, 0.2mM of each primer, and 1.5 mM of MgCl2.
Primers names, sequences and cycling conditions for each molecular marker are detailed in Table S1. SSR markers were run on 6% non-denaturing polyacrylamide gels in 0.5X TBE buffer using a Mega-Gel Dual High-Throughput
Vertical Electrophoresis Unit (CBS Scientific Co, Del Mar, CA, USA), stained with ethidium bromide (0.5 g/L) and vi-sualized under UV light. In the case of functional genes and genes closely linked to molecular markers, 10mL of the PCR products were run on 2% agarose (Promega) gels in SB buffer (Brody and Kern, 2004) at constant power (100 V) for about 30 min. After electrophoresis, the gels were stained with ethidium bromide (0.5 g/L) and visual-ized under UV light.
Glutenin analysis
Glutenins were extracted from single seeds and ana-lyzed by SDS-PAGE according to protocols described by Pflügeret al.(2001). Glu-A1, Glu-B1 and Glu-D1 subunits were analyzed by SDS-PAGE in 8% polyacrylamide gels (16x18 cm) in a Hoefer electrophoresis system (Hoefer Inc. Holliston, MA, USA) at 30 mA/gel for approximately 12 h. The gels were stained with 0.2% (w/v) Coomassie Blue R-250 (Promega), in 5% (v/v) ethanol and 12% (w/v) trichloroacetic acid overnight and destained in tap water for 24 h.
Allele diversity
All cultivars were treated as pure lines. A small pro-portion of heterozygosity was observed, and the following criteria were used to define the working allele. In the case of SSRs, where cultivars displayed two bands with differ-ent intensities, only the stronger band was considered. Yet, if the two bands showed similar intensities, then the most frequent allele was considered. If none of these options could be applied, the sample was scored as missing data. In the case of biochemical (glutenins) and functional molecu-lar markers, samples showing heterozygous alleles were scored as missing data. Rare alleles (with frequency lower than 5%) were treated as missing data for population struc-ture. The effective number of alleles per locus was com-puted on the basis of common alleles as ne= 1/Spi2(Hartl
and Clark, 1997). The estimate nerepresents the number of
equally frequent alleles that would result in the same proba-bility observed when randomly drawing two different al-leles from the population. It is a measure of variability at the locus that takes into account both allele number and fre-quency. The polymorphism index content (PIC), a measure of allelic diversity, was calculated according to Nei’s coef-ficient (Nei, 1973), PIC = 1-S(pi2), where pi is the
fre-quency of theithpolymorphism detected in the germplasm.
Population structure
and von Holdt, 2012). No prior information was used to de-fine the clusters, and the number of subpopulations (K) was set from 1 to 10, without admixture and with correlated al-lele frequencies, burn-in phase of 105iterations, and a sam-pling phase of 2 x 10⁵replicates, runs with K = 1 to 10 were repeated 10 times (Falush et al., 2003; Breseghello and Sorrells, 2006). This method estimates the proportion of the genomes of each individual derived from the different clus-ters and assigns individuals to subpopulations based on membership probability. We used the run that assigned all the cultivars to a single cluster at a probability > 0.50. The degree of differentiation of each subpopulation was mea-sured by a modified FST parameter (Falush et al., 2003).
The programGenetix(Belkhiret al., 1996-2004) was used to compute an overall FST(Weir and Cockerham, 1984) and
to conduct multiple correspondence analysis, with three di-mensions.
Results
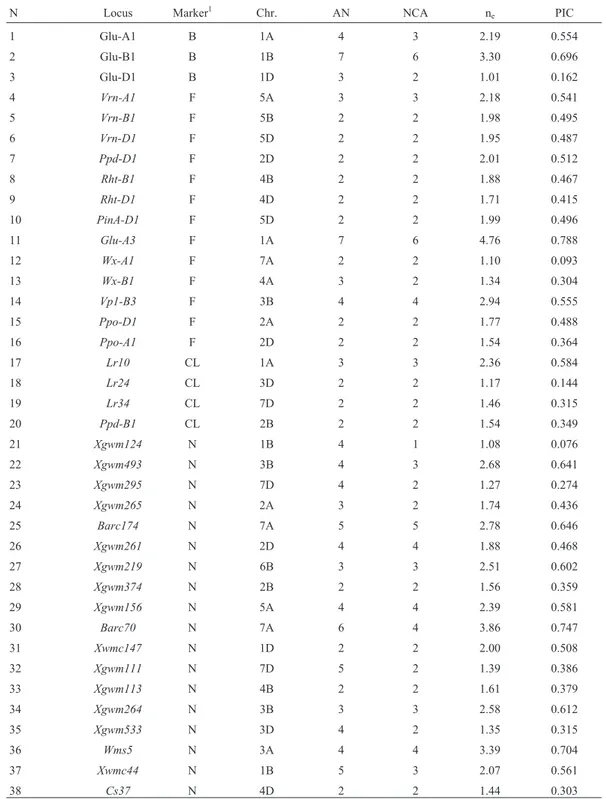
The genetic diversity of a collection of 102 bread wheat cultivars from Argentina was assessed using 35 mo-lecular markers (13 functional markers, 4 markers closely linked to genes, 17 SSR, and 1 ISBP) and 3 storage proteins (Table 1). A total number of 124 alleles was detected in the panel, including 21 rare alleles (with frequencies lower than 5% in the panel) that were discarded in the population structure studies. The number of alleles per locus varied be-tween two and seven, with an average of 3.26. The average numbers of common (excluding rare alleles in the analysis) and effective alleles (ne) were 2.65 (from 1 to 6) and 2.05
(from 1.01 to 4.76), respectively. Polymorphism informa-tion content (PIC) values obtained from the 38 polymor-phic markers varied between 0.076 and 0.788, with an average of 0.458. The mean frequency of missing data was 0.43%, or 1.65% when rare alleles were included (Table 1).
We explored the population genetic structure among the accessions using a based method. A model-based method is a cluster analysis that evaluates genetic similarity among genotypes without using prior informa-tion. After a first analysis with theStructureprogram we could not determine precisely the K number (number of subgroups or subpopulations) in the population, as the curve of the Ln probability of data [L(K)], did not generate a plateau after K = 10 (Figure 1A). Therefore, we used the output ofStructureas input data forStructure Harvester, now obtaining a clear peak with the highestDK value at K = 3 (Figure 1B). The analysis showed that three subpopu-lations were optimal for assigning all except 13 cultivars into one among the three clusters, with ana posteriori prob-ability > 0.80. The 13 genotypes assigned to individual clusters with ana posterioriprobability > 0.50 (but < 0.80) are underlined in Table 2. The three subpopulations K1, K2 and K3 included 17, 48 and 37 cultivars, respectively, with FSTaverages slightly higher in K1 (0.1939) than in K2 and
K3 (0.1279 and 0.1218, respectively), this evidencing a moderated differentiation within subgroups. Furthermore, the FSTvalue across subpopulations was 0.1485, indicating
a moderate differentiation also between subgroups. Figure 2 shows the projection of the multiple corre-spondence analysis (MCA) cloud on one orthogonal plane, with different symbols identifying each subpopulation ac-cording to the classification from Structure. The cloud was continuous, with three protrusions corresponding to the three subpopulations. In agreement with FSTestimates,
sub-populations 2 and 3 were less dispersed than 1.
Discussion
Genetic variability of the panel
The means for allele numbers and PIC values ob-served across all markers used in this work were 3.26 and 0.458 respectively (Table 1). These values were consider-ably lower than those observed for SSR loci (9.4 and 0.720; Manifestoet al., 2001) and for storage proteins (5.00 and 0.544; Lerneret al., 2009) for different but overlapping col-lections of wheat cultivars from Argentina. The mean allele number detected herein was also significantly lower than those revealed by SSR analysis in US wheat germplasm (4.8 and 7.2 alleles), reported by Breseghello and Sorrells (2006) and Chao et al. (2007) respectively. It was also lower than the 6.20 and 7.49 alleles observed by Plaschkeet al.(1995) and Le Couviouret al.(2011) in European wheat germplasm, and the 5.4 alleles detected by Dreisigackeret al.(2004) in CIMMYT germplasm. Finally, Balfourieret al.(2007) working with a worldwide wheat collection of 3,942 entries from 73 countries detected the very high aver-age value of 23.9 alleles per locus. These large differences in the number of alleles detected may be due to differences in the technologies used to detect polymorphism, as well as the type of molecular markers selected for the characteriza-tion (and/or the rate and amount of the germplasm evalu-ated).
Markers associated with traits of agronomic interest
In our study we selected a set of markers (biochemi-cal, functional markers and closely linked to genes mark-ers) related with relevant traits for breeding, like growth habit and/or vernalization response(Vrn-A1,Vrn-B1 and Vrn-D1), photoperiod sensitivity (Ppd-D1), plant height (Rht-B1, Rht-D1), grain texture (PinA-D1), starch waxy proteins variants (Wx-A1andWx-B1), PPO activity ( Ppo-A1,Ppo-D1), variants of the Viviparous-1B gene (Vp1-B3) associated with pre-harvest tolerance (Yanget al., 2007), low molecular weight glutenins (Glu-A3) and high molecu-lar weight glutenins (Glu-A1, Glu-B1, Glu-D1)
the tested cultivars carried at least one spring allele, consid-eringVrn-A1,Vrn-B1andVrn-D1loci,vs.11 cultivars with the triple winter alleles combination). These data agree with previous phenotypic (Appendinoet al., 2003) and mo-lecular data (Fuet al., 2005). We also noticed a higher fre-quency of the photoperiod insensitive (PI) allelesPpd-D1a
and/orPpd-B1aalleles (74 cultivars) than the combination ofPpd-D1bandPpd-B1balleles associated with photope-riod sensitivity (PS) (28 cultivars), this suggesting a better adaptation of photoperiod insensitivity to the environmen-tal conditions in Argentina (between 27° and 38° S). A high frequency of PI alleles was also observed in low latitude
re-Table 1- Biochemical and molecular markers used in the study, chromosome location, number of alleles, number of common alleles, effective allele number and polymorphic information content (for details see Supplementary Tables S2 and S3).
N Locus Marker1 Chr. AN NCA n
e PIC
1 Glu-A1 B 1A 4 3 2.19 0.554
2 Glu-B1 B 1B 7 6 3.30 0.696
3 Glu-D1 B 1D 3 2 1.01 0.162
4 Vrn-A1 F 5A 3 3 2.18 0.541
5 Vrn-B1 F 5B 2 2 1.98 0.495
6 Vrn-D1 F 5D 2 2 1.95 0.487
7 Ppd-D1 F 2D 2 2 2.01 0.512
8 Rht-B1 F 4B 2 2 1.88 0.467
9 Rht-D1 F 4D 2 2 1.71 0.415
10 PinA-D1 F 5D 2 2 1.99 0.496
11 Glu-A3 F 1A 7 6 4.76 0.788
12 Wx-A1 F 7A 2 2 1.10 0.093
13 Wx-B1 F 4A 3 2 1.34 0.304
14 Vp1-B3 F 3B 4 4 2.94 0.555
15 Ppo-D1 F 2A 2 2 1.77 0.488
16 Ppo-A1 F 2D 2 2 1.54 0.364
17 Lr10 CL 1A 3 3 2.36 0.584
18 Lr24 CL 3D 2 2 1.17 0.144
19 Lr34 CL 7D 2 2 1.46 0.315
20 Ppd-B1 CL 2B 2 2 1.54 0.349
21 Xgwm124 N 1B 4 1 1.08 0.076
22 Xgwm493 N 3B 4 3 2.68 0.641
23 Xgwm295 N 7D 4 2 1.27 0.274
24 Xgwm265 N 2A 3 2 1.74 0.436
25 Barc174 N 7A 5 5 2.78 0.646
26 Xgwm261 N 2D 4 4 1.88 0.468
27 Xgwm219 N 6B 3 3 2.51 0.602
28 Xgwm374 N 2B 2 2 1.56 0.359
29 Xgwm156 N 5A 4 4 2.39 0.581
30 Barc70 N 7A 6 4 3.86 0.747
31 Xwmc147 N 1D 2 2 2.00 0.508
32 Xgwm111 N 7D 5 2 1.39 0.386
33 Xgwm113 N 4B 2 2 1.61 0.379
34 Xgwm264 N 3B 3 3 2.58 0.612
35 Xgwm533 N 3D 4 2 1.35 0.315
36 Wms5 N 3A 4 4 3.39 0.704
37 Xwmc44 N 1B 5 3 2.07 0.561
38 Cs37 N 4D 2 2 1.44 0.303
1
gions of Japan (36° N), associated also in this case with early flowering to avoid rains at harvest and preharvest sprouting (Sekiet al., 2011). Unlike this situation, Lanning et al.(2012) evaluated PS and PI spring near-isogenic lines (NILs) and observed better agronomic perfomance in PS NILs planted at higher latitudes (between 45° and 54° N) and considering early planting dates, as no difference be-tween PS and PI lines occurred for the latest planting date. In the case of the dwarfing genesRht-B1andRht-D1, the most frequent allelic combinations were semi-dwarf phe-notypes (37 Rht-B1b/Rht-D1a and 29 Rht-B1a/Rht-D1b) followed by tall phenotypes (35Rht-B1a/Rht-D1a) and fi-nally, only one dwarf phenotype (Rht-B1b/Rht-D1b). The reduced height allelesRht-B1bandRht-D1bare incorpo-rated in breeding programs to reduce lodging (Flinthamet al., 1997) and increase the harvest index (Goodinget al., 2012) under favorable environments, including problably, most fertile environments in Argentina.
These data would support a better adaptation of spring, photoperiod insensitive and semidwarf wheats to dominant environments in Argentina, however, a fine tun-ing evaluation of sprtun-ing NILs carrytun-ing different combina-tions of vernalization, photoperiod insensitivity, as well as plant height alleles is still a pending issue.
In the case of markers closely linked toLrgenes, the most valuable information is perhaps, the relatively high number of cultivars that probably possess the adult plant leaf rust resistance gene Lr34 (20 cultivars), a finding which agrees with Vanzettiet al.(2011). This gene has sup-ported resistance to leaf rust in wheat for more than fifty years and is extensively used in breeding programs world-wide (Krattingeret al., 2009).
Relevant information for bread-making quality can be the presence of the Glu-B1 7oe subunit associated with improved dough strength of wheat (Butowet al., 2004) in ten cultivars. Valuable alleles for the development of
culti-Figure 1- Population genetic structure analysis of Argentinian wheat germplasm. (A) Mean L(K) (±SD) over 10 runs for eachKvalue. The model con-sidered here is a hierarchical island model using all 102 individuals per population and 38 loci. (B)DKcalculated asDK=m|L”(K)| /s[L(K)]. The modal value of this distribution is the trueKor the uppermost level of structure, here 3 clusters.
Table 2- Distribution of 102 Argentinean wheat cultivars in the three subpopulations detected using a model-based approach.
K Cultivar name*
1 Baguette 10, Baguette 17, Baguette 18, Baguette 19, Baguette 21, Baguette 30, Baguette 31, Baguette 9, Baguette P. 11, BSYN 100, BSYN 200, BSYN 300, Klein 32, Klein Atlas, Klein Centauro, Sinvalocho, SRN Nogal
2 ACA 223, ACA 801, ACA 901, ACA 906, ACA 907, BIOINTA 1001, BIOINTA 1003, BIOINTA 1004, BIOINTA 1005, BIOINTA 1006, BIOINTA 3004, Buck AGP-FAST, Buck Huanchen, Buck Puelche, Don Mario Arex, Don Mario Atlax, Don Mario Cronox, Don Mario Onix, INIA Centinela, INIA Churrinche, INIA Torcaza, Klein Brujo, Klein Cacique, Klein Capricornio, Klein Carpin-cho, Klein Castor, Klein Don Enrique, Klein Escorpión, Klein Gavilán, Klein Gladiador, Klein Guerrero, Klein León, Klein Pantera, Klein Proteo, Klein Rayo, Klein Tauro, Klein Tigre, Klein Yarará, Klein Zorro, LE 2330, LE 2331, LE 2333, LE 2341, ProINTA Eli-te, ProINTA Guazú, ProINTA Isla Verde, ProINTA Oasis, Relmo Sirirí
3 ACA 201, ACA 202, ACA 320, ACA 903B, Barletta 77, BIOINTA 1000, BIOINTA 1002, BIOINTA 2001, BIOINTA 2004, BIOIN-TA 3003, BIOINBIOIN-TA 3005, Buck 55CL, Buck Aniversario, Buck Baqueano, Buck Bigua, Buck Brasil, Buck Chacarero, Buck Guapo, Buck Malevo, Buck Mangrullo, Buck Meteoro, Buck Napostá, Buck Norteño, Buck Pingo, Buck Pronto, Buck Ranquel, Buck Taita, Don Mario Themix, INIA Cóndor, Klein Chajá, Klein Impacto, Klein Nutria, Klein Rendidor, Marcos Juárez INTA, Olaeta Artillero, ProINTA Gaucho, ProINTA Granar
*
vars with superior bread quality, partial waxy wheats, low PPO activity, and pre-harvest sprouting tolerance were also detected in the panel.
K = 3 is associated with the main breading programs in Argentina
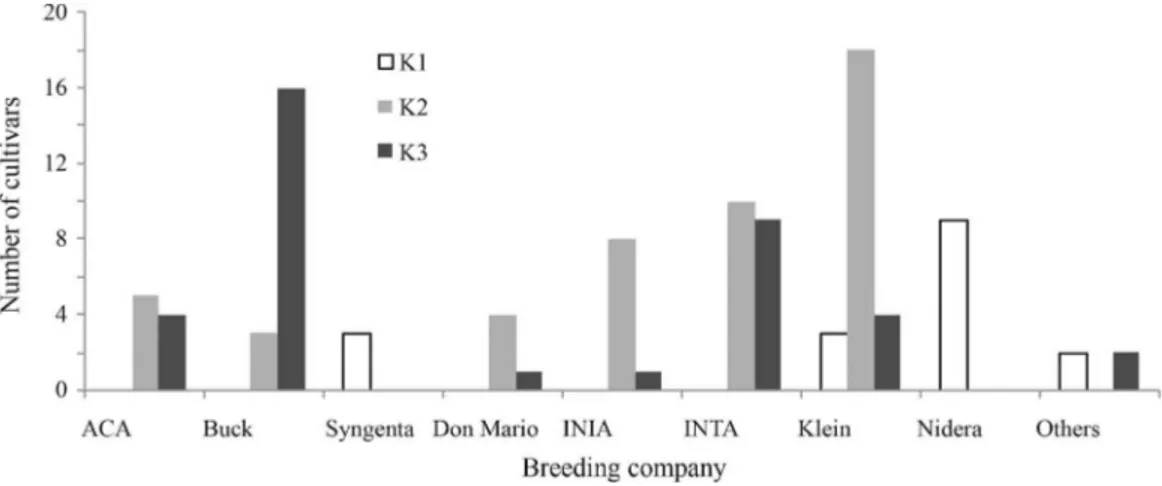
In this work, using a model-based approach we de-tected three subpopulations in the collection of 102 Argen-tinean wheat cultivars. Our hypothesis is that this subpopu-lation division actually reflects the origin of the germplasm used by the main breeding programs in Argentina. For ex-ample, K1 is composed mainly (70.58%) by cultivars from Nidera and Syngenta breeding programs, as 100% of the cultivars tested and released by these companies were grouped only in K1. It is worthy of note that this germplasm (at least early materials released by Nidera (Buloset al., 2006), has a European origin, mainly from France, and was introduced gradually to Argentina since 1999. The K1 subpopulation also includes old cultivars from the Klein breeding program, like Klein 32 (released in 1932), Klein Atlas (1963) and Klein Centauro (1989) (Figure 3). K2 is mainly composed (60.41%) by cultivars from Klein, INIA and Don Mario breeding programs, the 72% of Klein,
87.5% of INIA and 80% of Don Mario tested cultivars were included in K2 (Figure 3). The cultivars grouped in K2 are basically (1) introductions and selections made in CIMMYT, as well as crosses made in Argentina, including CIMMYT material like Bobwhite, Kavkaz, Pastor, Seri, Veery and Weebill, (2) introductions from Brazil (some materials from Don Mario Breeding Company), and (3), to a lesser degree, materials selected from crosses including traditional germplasm from Argentina. Finally, K3 is com-posed mostly by cultivars belonging to the Buck Breeding Program (43.24%). INTA and ACA Breeding Programs have an even distribution of their tested cultivars between the K1 and K2 subpopulations (Figure 3). The cultivars grouped in K3 are mostly derived from traditional germ-plasm from Argentina and, to a lesser degree, from CIMMYT.
A similar type of grouping of cultivars by geographic origin and breeding history using a model-based approach was observed by Le Couviouret al.(2011) working with an elite wheat panel from Europe. They identified four sub-populations, including cultivars from UK, Germany and France divided into two subgroups and proposed that the separation between French, German and UK cultivars can be explained by the geographic origin and, in the case of France, the conformation of two subgroups as being due to the breeding history. Furthermore, Chaoet al.(2007), when using a similar approach to analyze the genetic structure of U.S. wheat cultivars and breeding lines, found four sub-populations and suggested that the genetic diversity exist-ing among these U.S. wheat germplasm was influenced by regional adaptation. Our data would suggest that in Argen-tina the most important factor explaining the genetic vari-ability of adapted commercial bread cultivars would be the different core collections of germplasm used by the main breeding programs instead of geographic adaptation, as ob-served in Europe and US.
The results obtained in this paper are a very valuable source of information for breeding programs for the cre-ation of novel combincre-ations of alleles from genes involved
Figure 3- Bar chart representing the frequency of cultivars belonging to each breeding company distributed in the subpopulations K1 to K3.
in adaptation, disease resistance and bread-making quality between other traits. Additionally, the genetic structure of the panel of cultivars analyzed in this study is being used as the starting point of association studies considering addi-tional phenotypic traits of interest for the breeding like drought tolerance and yield components like kernel weight between others.
Acknowledgments
This work is part of the project AEBIO241351 “As-sociation mapping for agronomic interest traits” supported by the Instituto Nacional de Tecnología Agropecuaria, Ar-gentina.
References
Appendino M, Bartoloni N and Slafer G (2003) Vernalization re-sponse and earliness per se in cultivars representing differ-ent eras of wheat breeding in Argdiffer-entina. Euphytica 130:61-69.
Balfourier F, Roussel V, Strelchenko P, Exbrayat-Vinson F, Sour-dille P, Boutet G, Koenig J, Ravel C, Mitrofanova O, Be-ckert M,et al.(2007) A worldwide bread wheat core collec-tion arrayed in a 384-well plate. Theor Appl Genet 114:1265-1275.
Beales J, Turner A, Griffiths S, Snape JW and Laurie DA (2007) APseudo-Response Regulatoris misexpressed in the photo-period insensitive Ppd-D1a mutant of wheat (Triticum aestivumL.). Theor Appl Genet 115:721-733.
Belkhir K, Borsa P, Chikhi L, Raufaste N and Bonhomme F (1996) GENETIX 4.05, logiciel sous Windows pour la gé-nétique des populations. Université de Montpellier II, Montpellier, France.
Bered F, Barbosa-Neto JF and de Carvalho FIF (2002) Genetic variability in common wheat germplasm based on coeffi-cients of parentage. Genet Mol Biol 25:211-215.
Breseghello F and Sorrells MS (2006) Association mapping of kernel size and milling quality in wheat (Triticum aestivum L.) cultivars. Genetics 172:1165-1177.
Brody JR and Kern SE (2004) Sodium boric acid: A Trisfree, cooler conductive medium for DNA electrophoresis. Bio-Techniques 36:214-216.
Bulos M, Echarte M and Sala C (2006) Occurrence of the rust re-sistance geneLr37fromAegilops ventricosain Argentine cultivars of wheat. Electr J Biotechnol 9:1-17.
Burkhamer RL, Lanning SP, Martens RJ, Martin JM and Talbert LE (1998) Predicting progeny variance from parental diver-gence in Hard Red Spring wheat. Crop Sci 38:243-248. Butow BJ, Gale KR, Ikea J, Juhász A, Bedö Z, Tamás L and
Gianibelli MC (2004) Dissemination of the highly expressed Bx7 glutenin subunit (Glu-B1al allele) in wheat as revealed by novel PCR markers and RP-HPLC. Theor Appl Genet 109:1525-1535.
Chao S, Zhang W, Dubcovsky J and Sorrells M (2007) Evaluation of genetic diversity and genome-wide linkage disequilib-rium among U.S. wheat (Triticum aestivumL.) germplasm representing different market classes. Crop Sci 47:1018-1030.
Chao S, Dubcovsky J, Dvorak J, Luo MC, Baenziger S, Matnya-zov R, Clark D, Talbert L, Anderson J, Dreisigacker S,et al.
(2010) Population- and genome-specific patterns of linkage disequilibrium and SNP variation in spring and winter wheat (Triticum aestivumL.). BMC Genomics 11:e727.
Díaz A, Zikhali M, Turner AS, Isaac P and Laurie DA (2012) Copy number variation affecting the Photoperiod-B1 and Vernalization-A1 genes is associated with altered flowering time in wheat (Triticum aestivum). PLoS One 7:e33234. Dreisigacker S, Zhang P, Warburton ML, Van Ginkel M,
Hoi-sington D and Melchinger AE (2004) SSR and pedigree analyses of genetic diversity among CIMMYT wheat lines targeted to different megaenvironments. Crop Sci 44:381-388.
Earl DA and von Holdt BM (2012) STRUCTURE HARVESTER: A website and program for visualizing STRUCTURE output and implementing the Evanno method. Conserv Genet Resour 4:359-361.
Ellis MH, Spielmeyer W, Gale KR, Rebetzke GJ and Richards RA (2002) “Perfect” markers for the Rht-B1b and Rht-D1b dwarfing genes in wheat. Theor Appl Genet 105:1038-1042. Evanno G, Regnaut S and Goudet J (2005) Detecting the number
of clusters of individuals using the software STRUCTURE: A simulation study. Mol Ecol 14:2611-2620.
Falush D, Stephens M and Pritchard JK (2003) Inference of popu-lation structure using multilocus genotype data: Linked loci and correlated allele frequencies. Genetics 164:1567-1587. Flintham JE, Börner A, Worland AJ and Gale MD (1997)
Opti-mizing wheat grain yield: Effects ofRht (gibberellin-insen-sitive) dwarfing genes. J Agric Sci 128:11-25.
Fu D, Szücs P, Yan L, Helguera M, Skinner JS, von Zitzewitz J, Hayes PM and Dubcovsky J (2005) Large deletions within the first intron in VRN-1 are associated with spring growth habit in barley and wheat. Mol Genet Genom 273:54-65. Gautier MF, Aleman ME, Guirao A, Marion D and Joudrier P
(1994) Triticum aestivum puroindolines, two cystine-rich seed proteins: cDNA sequence analysis and developmental gene expression. Plant Mol Biol 25:43-57.
Gooding MJ, Addisu M, Uppal RK, Snape JW and Jones HE (2012) Effect of wheat dwarfing genes on nitrogen-use effi-ciency. J Agric Sci 150:3-22.
Hartl D and Clark A (1997) Principles of Population Genetics. Sinauer Associates, Sunderland, 635 pp.
He XY, He ZH, Zhang LP, Sun DJ, Morris CF, Fuerst EP and Xia XC (2007) Allelic variation of polyphenol oxidase (PPO) genes located on chromosomes 2A and 2D and development of functional markers for the PPO genes in common wheat. Theor Appl Genet 115:47-58.
Helguera M, Vanzetti L, Soria M, Khan IA, Kolmer J and Dub-covsky J (2005) PCR markers forTriticum speltoidesleaf rust resistance gene Lr51 and their use to develop isogenic hard red spring wheat lines. Crop Sci 45:728-734.
Krattinger SG, Lagudah ES, Spielmeyer W, Singh RP, Huerta-Espino J, McFadden H, Bossolini E, Selter LL and Keller B (2009) A putative ABC transporter confers durable resis-tance to multiple fungal pathogens in wheat. Science 323:1360-1363.
Lagudah ES, McFadden H,Singh RP, Huerta-Espino J, Bariana HS and Spielmeyer W (2006) Molecular genetic character-ization of the Lr34/Yr18 slow rusting resistance gene region in wheat. Theor Appl Genet 114:21-30.
al.(2012) Agronomic performance of spring wheat as re-lated to planting date and photoperiod response. Crop Sci 52:1633-1639.
Le Couviour F, Faure S, Poupard B, Flodrops Y, Dubreuil P and Praud S (2011) Analysis of genetic structure in a panel of elite wheat varieties and relevance for association mapping. Theor Appl Genet 123:715-727.
Lerner SE, Kolman MA and Rogers WJ (2009) Quality and endo-sperm storage protein variation in Argentinean grown bread wheat. I. Allelic diversity and discrimination between culti-vars. J Cereal Sci 49:337-345.
Manifesto MM, Schlatter AR, Hopp HE, Suarez EY and Dub-covsky J (2001) Quantitative evaluation of genetic diversity in wheat germplasm using molecular markers. Crop Sci 41:682-690.
Matthews DE, Carollo VL, Lazo GR and Anderson OD (2003) GrainGenes, the genome database for small-grain crops. Nu-cleic Acids Res 31:183-186.
McLauchlan A, Ogbonnaya FC, Hollingsworth B, Carter M, Gale KR, Henry RJ, Holton TA, Morell MK, Rampling LR, Sharp PJ,et al.(2001) Development of robust PCR-based DNA markers for each homoeo-allele of granule-bound starch synthase and their application in wheat breeding programs. Austr J Agric Res 52:1409-1416.
Metakovsky EV and Branlard G (1998) Genetic diversity of French common wheat germplasm based on gliadin alleles. Theor Appl Genet 96:209-218.
Mukhtar MS, Rahman M and Zafar Y (2002) Assessment of ge-netic diversity among wheat (Triticum aestivumL.) cultivars from a range of localities across Pakistan using random am-plified polymorphic DNA (RAPD) analysis. Euphytica 128:417-425.
Nei M (1973) Analyses of gene diversity in subdivided popula-tions. Proc Natl Acad Sci USA 70:3321-3323.
Neumann K, Kobiljski B, Dencic S, Varshney RK and Börner A (2011) Genome-wide association mapping: A case study in bread wheat (Triticum aestivumL.). Mol Breed 27:37-58. Parker GD, Fox PN, Langridge P, Chalmers K, Whan B and
Ganter PF (2002) Genetic diversity within Australian wheat breeding programs based on molecular and pedigree data. Euphytica 124:293-306.
Peng JH, Bai Y, Haley SD and Lapitan NLV (2009). Microsa-tellite-based molecular diversity of bread wheat germplasm and association mapping of wheat resistance to the Russian wheat aphid. Genetica 135:95-122.
Pflüger LA, D’Ovidio R, Margiotta B, Peña R, Mujeeb-Kazi A and Lafiandra D (2001) Characterisation of high- and low-molecular weight glutenin subunits associated to the D ge-nome ofAegilops tauschiiin a collection of synthetic hexa-ploid wheats. Theor Appl Genet 103:1293-1301.
Plaschke J, Ganal M and Röder M (1995) Detection of genetic di-versity in closely related bread wheat using microsatellite markers. Theor Appl Genet 91:1001-1007.
Pritchard JK, Stephens P and Donnelly P (2000) Inference of pop-ulation structure using multilocus genotype data. Genetics 155:945-959.
Saitou N and Nei M (1987) The neighbor-joining method: A new method for reconstructing phylogenetic trees. Mol Biol Evol 4:406-425.
Schachermayr G, Messmer MM, Feuillet C, Winzeler H, Win-zeler M and Keller B (1995) Identification of molecular markers linked to the Agropyron elongatum-derived leaf rust resistance gene Lr24 in wheat. Theor Appl Genet 90:982-990.
Schachermayr G, Feuillet C and Keller B (1997) Molecular mark-ers for the detection of the wheat leaf rust resistance gene Lr10in diverse genetic backgrounds. Mol Breed 3:65-74. Seki M, Chono M, Matsunaka H, Fujita M, Oda S, Kubo K,
Kiribuchi-Otobe C, Kojima H, Nishida H and Kato K (2011) Distribution of photoperiod-insensitive alleles Ppd-B1a and Ppd-D1a and their effect on heading time in Japanese wheat cultivars. Breed Sci 61:405-412.
Sneath pH and Sokal RR (1973) Numerical Taxonomy. W.H. Freeman, San Francisco, 573 pp.
Soleimani VD, Baum BR and Johnson DA (2002) AFLP and ped-igree-based genetic diversity estimates in modern cultivars of durum wheat [Triticum turgidumL. subsp.durum(Desf.) Husn.]. Theor Appl Genet 104:350-357.
Spagnoletti-Zeuli PLS and Qualset CO (1987) Geographical di-versity for quantitative spike characters in a world collection of durum wheat. Crop Sci 27:235-241.
Van Beuningen LT and Busch RH (1997a) Genetic diversity among North American spring wheat cultivars: I. Analysis of the coefficient of parentage matrix. Crop Sci 37:570-579. Van Beuningen LT and Busch RH (1997b) Genetic diversity
among North American spring wheat cultivars: III. Cluster analysis based on quantitative morphological traits. Crop Sci 37:981-988.
Vanzetti L, Pflüger L, Rodríguez-Quijano M, Carrillo JM and Helguera M (2009) Genetic variability of Waxy genes in hexaploid wheats. Electron J Biotechnol 12:e4-5.
Vanzetti L, Campos P, Demichelis M, Lombardo L, Vaschetto LM, Aurelia PR, Bainotti C and Helguera M (2011). Identi-fication of leaf rust resistance genes in Argentinean hexa-ploid wheat (Triticum aestivumL.) using molecular markers and traditional gene postulation. Electron J Biotechnol 14:e9-9.
Weir BS and Cockerham CC (1984) Estimating F-statistics for the analysis of population structure. Evolution 38:1358-1370. Yan L, Helguera M, Kato K, Fukuyama S, Sherman J and
Dub-covsky J (2004) Allelic variation at the VRN-1 promoter re-gion in polyploid wheat Theor Appl Gen 109:1677-1686. Yang Y, Zhao XL, Xia LQ, Chen XM, Xia XC, Yu Z, He Z and
Röder MS (2007). Development and validation of Vivipa-rous-1 STS marker for pre-harvest sprouting tolerante in Chinese wheats. Theor Appl Genet 115:971-980.
Zhang W, Gianibelli MC, Rampling LR and Gale KR (2004) Characterisation and marker development for low molecular weight glutenin genes fromGlu-A3alleles of bread wheat (Triticum aestivum. L). Theor Appl Genet 108:1409-1419.
Internet Resources
GrainGenes database, http://wheat.pw.usda.gov/GG2/in-dex.shtml (September 15, 2012).
Structure software, http://pritch.bsd.uchicago.edu/structure.html (September 15, 2012).
Structure harvester,
Genetix software, http://kimura.univ-montp2.fr/genetix/ (Sep-tember 15, 2012).
Supplementary Material
The following online material is available for this ar-ticle:
Table S1 - Molecular markers used in the study.
Table S2 - Biochemical and functional molecular markers in Argentinean wheat cultivars.
Table S3 - Neutral molecular markers in Argentinean wheat cultivars.
This material is available as part of the online article from http://www.scielo.br/gmb.
Associate Editor: Everaldo Gonçalves de Barros