www.ccarevista.ufc.br ISSN 1806-6690
Characterisation of the optimal hydric interval for a Yellow Argisol
cultivated with sugarcane on the coastal plains of Alagoas, Brazil
1Caracterização do intervalo hídrico ótimo de um Argissolo Amarelo cultivado com
cana-de-açúcar nos tabuleiros costeiros de Alagoas - Brasil
Ismar Lima de Farias2*, Edson Patto Pacheco3 e Pedro Roberto Almeida Viégas4
ABSTRACT - This work had as its objective to study the optimum water range (OWR) of a Yellow Argisol of the coastal plains, planted with sugarcane, when subjected to different levels of compaction. For the laboratory tests soil samples with a non-preserved structure were used, removed from depths of from 0.20 m to 0.40 m and 0.40 m to 0.60 m, representing the AB and Bt horizons respectively. The treatments consisted of different soil densities represented by specimens contained in volumetric rings. The critical densities of the AB and Bt horizons for samples of upturned soil, were 1.84 and 1.63 Mg m-3 respectively. In undisturbed soil a critical density of 1.63 and 1.64 Mg m-3 was observed for
the same horizons. However, the soil density at which root development begins to be restricted was 1.61 Mg m-3 for
samples of upturned soil, and 1.50 Mg m-3 for samples of undisturbed soil at a depth of from 0.20 to 0.40 m. From 0.40
to 0.60 m the critical density was 1.45 and 1.18 Mg m-3 for samples of upturned and undisturbed soil respectively. It can
be concluded that upturning the soil increased the IHO of the AB and Bt horizons of the Yellow Argisol, compared to the undisturbed soil cultivated with sugarcane. The subsurface movement of the studied Argisol increases the IHO at higher densities, due to the increase in the critical density of the AB and Bt horizons, improving their hydro-mechanical behavior.
Key words: Soil-compaction. Water Balace. Sugar Cane.
RESUMO - Este trabalho teve como objetivo estudar o intervalo hídrico ótimo (IHO) de um Argissolo Amarelo de
tabuleiros costeiros, cultivado com cana-de-açúcar, quando submetido a diferentes níveis de compactação. Para os ensaios de laboratório foram utilizadas amostras de solo com estrutura não preservada retiradas nas profundidades de 0,20 a 0,40 m e 0,40 a 0,60 m, representando os horizontes AB e Bt, respectivamente. Os tratamentos foram compostos por diferentes densidades do solo representadas por corpos de prova contidos em anéis volumétricos. As densidades críticas para os horizontes AB e Bt, para amostras de solo revolvido, foram 1,84 e 1,63 Mg m-3, respectivamente. No solo com estrutura preservada observou-se
densidade crítica de 1,63 e 1,64 Mg m-3 para os mesmos horizontes. Contudo, a densidade do solo em que começa a restrição ao
desenvolvimento radicular foi 1,61 Mg m-3 para amostras de solo revolvido e, 1,50 Mg m-3, para amostras de solo com estrutura
preservada na profundidade de 0,20 a 0,40 m. Na profundidade de 0,40 a 0,60 m a densidade crítica foi 1,45 e 1,18 Mg m-3 para
amostras de solo revolvido e com estrutura preservada, respectivamente. Conclue-se que o revolvimento do solo aumentou o IHO dos horizontes AB e Bt do Argissolo Amarelo em comparação ao solo com estrutura preservada cultivado com cana-de-açúcar. A movimentação subsuperficial do Argissolo Amarelo estudado aumenta o IHO em densidades maiores, devido ao aumento da densidade crítica dos horizontes AB e Bt, melhorando o seu comportamento hídrico e mecânico.
Palavras-chave: Solos-compactação. Balanço Hídrico. Cana-de-açúcar.
*Autor para correspondência
1Recebido para publicação em 24/04/2012; aprovado em 28/06/2013
Trabalho extraído de parte da Dissertação de Mestrado do primeiro autor apresentada na UFS
2Programa de Pós-Graduação em Agroecossistemas/NEREN, Universidade Federal de Sergipe, Aracaju-SE, Brasil, [email protected] 3Embrapa Tabuleiros Costeiros, Aracaju-SE, Brasil, [email protected]
INTRODUCTION
Brazil shows great potential in the use of alternative and renewable energy that can replace petroleum. According to Instituto Brasileiro de Geografia e Estatística (2011), the crop produced in Brazil in 2010 exceeded 717 million tonnes of sugar cane, with 68.7 million tonnes being produced in the northeast and 24.3 million tonnes in the state of Alagoas. The cultivated area in the northeast accounted for 13% of the total for Brazil.
The cultivation of sugar cane mainly occupies the ecosystem of the coastal plains, which has soils with cohesive horizons of pedogenetic origin, aggravated by the intensive use of agricultural machinery and implements, as well as by the flat to gently rolling topography, little rocky outcropping and medium texture. This cohesive horizon, according to Jacomine (2001), is very hard or extremely hard when dry, and normally brittle when moist.
Generally, soil preparation for planting perennial, semi-perennial and annual crops is carried out with a mouldboard or disc plough and heavy harrows which intensely and superficially turn over the soil. In the case of soils from the coastal plains, this practice can bring to the surface material from the underlying cohesive horizon, having physico-chemical characteristics which are undesirable for plant growth, such as densification, toxic aluminum and a low capacity for cation exchange (REZENDE, 2000).
The optimal hydric interval (OHI) represents an interval with upper and lower limits for water content, in which the constraints on plant growth are minimal, being associated with the matric potential or water availability, aeration and soil resistance
to root penetration (SILVAet al., 2010). Due to this
characteristic, the OHI is considered a multifactorial indicator of the physical quality of the soil (SILVA;
CABEDA, 2006; TORMENAet al., 2007). However,
Leãoet al. (2005) argue that to define the critical limits
of the OHI, it is recommended to set the values of those critical limits according to the experimental conditions and knowledge of the processes or phenomena involved.
Moisture in the soil, where its resistance to penetration is considered restrictive, is the factor that most reduces the amplitude of the OHI under agricultural soil
conditions (IMHOFF et al., 2001), because it presents a
greater variation to changes in soil density. As the density of the soil increases, the OHI is reduced, due to a sharp rise in penetration resistance with the least variation in soil
moisture (KAISERet al., 2009).
In this context, the aim of this work was to study the OHI of a Yellow Argisol of the coastal plain cultivated with sugar cane, when subjected to different levels of compaction.
MATERIAL AND METHODS
The soil volumes of a non-preserved structure used in the tests were obtained from an area planted with sugar cane in the municipality of Coruripe (10º02’60 “S, 36º10’31” W, elevation 6.0 m), in the State of Alagoas. Soil samples were taken at depths of from 0.20 to 0.40 m and from 0.40 to 0.60 m, representing the AB and Bt horizons of a soil classified as a dystrophic yellow argisol (EMPRESA BRASILEIRA DE PESQUISA AGROPECUÁRIA, 2006), of flat terrain and medium (light) or clayey texture, made up of Barreiras-group sediment characteristic of the geomorphological
coastal-plain unit (JACOMINE et al., 1975). The
local climate as described by Köppen is tropical wet, with dry summers. The average annual rainfall is approximately 1,400 mm and the average temperature
is 24.4 C (JACOMINEet al., 1975).
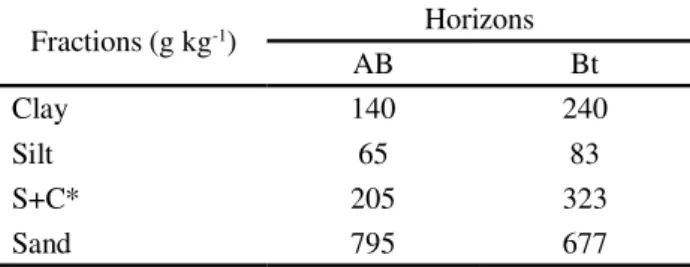
The particle size of the soil was determined with the Boyoucos hydrometer method (EMPRESA BRASILEIRA DE PESQUISA AGROPECUÁRIA, 1997). The sand, silt and clay content of the AB and Bt horizons of the argisol under study is presented in Table 1.
After being dried in the shade and passed through a 4 mm sieve, the soil was used to fill rings made of PVC with a diameter of 5.2 cm and a height of 2.0 cm, making up the test samples used in the physical analyses of the soil, which were carried out at the Laboratory of Soil Physics of Embrapa, at their coastal-plain headquarters in Aracaju, Sergipe. The mass of the dry soil was calculated in order to fill the volumetric rings with five density levels for the subsurface horizons: 1.4; 1.5; 1.6; 1.7
and 1.8 Mg m-3 for the AB horizon; and 1.3; 1.4; 1.5; 1.6
and 1.7 Mg m-3 for the Bt horizon. The lower and upper
limits for the density of the Bt horizon were lower than those for the AB horizon due to the higher clay content, which results in a lower value for the critical density. For each density, three replications in the laboratory and eight matric-potential suction tests (-1; -4; -6; -10; -33; -100; -500 and -1500 kPa) were carried out, giving a total of 240 samples.
Table 1 - Particle-size composition of the deformed samples from the AB and Bt horizons
Fractions (g kg-1) Horizons
AB Bt
Clay 140 240
Silt 65 83
S+C* 205 323
The soil bulk density (BD) was calculated by dividing the mass of the dry sample (MDS) in megagrams
(Mg), by the total volume of the ring in m3. The total pore
volume (TPV) in m3 m-3 was calculated by equation 1, the
particle density, determined by the volumetric flask method as per Empresa Brasileira de Pesquisa Agropecuária
(1997), being equal to 2.62 Mg m-3.
TPV = [1- (Ds/Dp)] (1)
The microporosity (VMicro) was determined by means of the volumetric humidity of the sample submitted to a suction tension of -6 kPa. The macroporosity (VMacro) was calculated by the difference between the total porosity and the microporosity.
To set the upper limit of the OHI, the matric potential at field capacity ( fc) and the critical value of the aeration porosity ( ap) were obtained, and was
considered as 0.10 m3 m-3. For the lower limit, the
limiting matric potential at the permanent wilting point pwp) and the volumetric humidity related to a soil penetration resistance of 2,000 kPa ( rp) were both defined. The OHI is obtained by the difference between the lowest upper limiting value for the matric potential
) and the highest lower limiting value for .
In order to obtain a graph of the OHI, the exponential models (DIAS JUNIOR, 2000) of resistance to penetration as a function of the volumetric humidity content (PR = 10 (a + b. )) were determined, with which the values of volumetric humidity at which soil resistance to penetration is considered critical,
were then calculated (SILVAet al., 2010; TORMENA,
SILVA; LIBARDI, 1998), i.e. 2,000 kPa ( rp = [ln (2000 / a )] / b) for each soil density considered in the study.
Where: rp = resistance of the soil to penetration; 2,000 = soil resistance considered as limiting root development (kPa); ln = natural logarithm; and “a” and “b” = coefficients of determination.
By means of linear regression models, the curves of rp, pwp, fc and ap were adjusted as a function of the soil density. All adjustment coefficients of the regression equations were obtained using the SAEG 9.1 software, developed by the Federal University of Viçosa (SAEG, 2007).
The values of TPV, fc and pwp were estimated using the characteristic curve for water-retention and those values of rp estimated by the regression models, adjusted for the estimation of soil resistance to penetration as a function of humidity.
The determination of the OHI was carried out
using the criteria described by Wuet al. (2003):
(a) Se ( ap fc) e ( rp pwp) => OHI = fc - pwp;
(b) Se ( ap fc) e rp pwp) => OHI = fc - rp;
(c) Se ( ap fc) e ( rp pwp) => OHI = ap - pwp;
(d) Se ( ap fc) e ( rp pwp) => OHI = ap - rp.
Where ap = soil moisture for an aeration porosity
of 0.1 m3 m-3; fc = soil humidity at field capacity
(water retained at -10 kPa); pwp = soil humidity at the permanent wilting point (water retained at a tension of -1500 kPa); rp = soil humidity at a penetration resistance of 2,000 kPa (obtained by the penetration resistance curve as a function of soil humidity); and OHI = optimal hydric interval.
As parameters, the OHI for samples with a preserved structure extracted from the same area under study were generated, employing the database used by Pacheco and Cantalice (2011a, 2011b).
RESULTS AND DISCUSSION
AB horizon (depth from 0.20 to 0.40 m)
The total pore volume (TPV) decreases with the increase in soil density (Ds), however, it is interesting to compare treatments where the Ds is equal or close, regarding the behaviour of the macro and microporosity of the soil as a result of destructuring. A greater amount of macropores and a lower amount of micropores are seen in those treatments using destructured soil. As examples the 1.6DC treatment may be compared to the1.58CI and the 1.4DC to the 1.41MI (Table 2). In addition, there may be differences in the class of micropores in the compared
treatments, as noted by Smith et al. (2005) who, when
working with a yellow argisol at the Triunfo plant in Alagoas, verified an increase in the amount of micropores of smaller diameter, caused by the larger-diameter pores being filled with illuvial clay and consequent greater water retention in the model, even at higher tensions.
Another factor that should be considered in explaining the behaviour of treatments 1.6DC and 1.58CI is the occurrence of both compaction and densification in non-deformed samples, and of only compaction in the deformed samples, seeing that Curi
(1993) and Machado et al. (2008), agree that soil
compaction is the main physical limitation of the soil to plant development resulting from human activities in soil use and management, and is characterised by a reduction in the volume of soil, brought about by compression, causing denser rearrangement of the soil
particles. According to Dias Júnior et al. (2004), soil
Table 2 - Total pore volume (TPV), macropore volume (VMacro), micropore volume (VMicro), available water (AW) and optimal hydric interval (OHI) of a Yellow Argisol at a depth of from 0.20 to 0.40 m
1.4DC = Density 1 of deformed samples from the cultivated area; 1.5DC = Density 2 of deformed samples from the cultivated area; 1.6DC = Density 3 of deformed samples from the cultivated area; 1.7DC = Density 4 of deformed samples from the cultivated area; 1.8DC = Density 5 of deformed samples from the cultivated area; 1.58NC = non-deformed samples from the cultivated area; 1.41NW = non-deformed samples from the wooded area; * Source: Pacheco and Cantalice (2011a, 2011b)
Treatments 1.4DC 1.5DC 1.6DC 1.7DC 1.8DC 1.58NC* 1.41NW*
TPV (m3 m-3) 0.466 0.427 0.389 0.351 0.313 0.397 0.462
VMacro (m3 m-3) 0.331 0.281 0.239 0.155 0.089 0.199 0.297
VMicro (m3 m-3) 0.135 0.147 0.150 0.196 0.224 0.198 0.165
AW (m3 m-3) 0.057 0.056 0.054 0.053 0.051 0.061 0.050
OHI (m3 m-3) 0.057 0.056 0.054 0.038 0.000 0.011 0.050
which is a natural phenomenon in soil horizons. Silva
et al. (1998) emphasize that this densification has a
pedogenetic source, whereas the dramatic reduction in porosity is a consequence of the densification brought about by illuvial clay being moved to the subsurface and as a result filling the pores. This densification can mainly be found in the textural B and nitic B horizons of argisols and nitosols respectively (EMBRAPA, 2006).
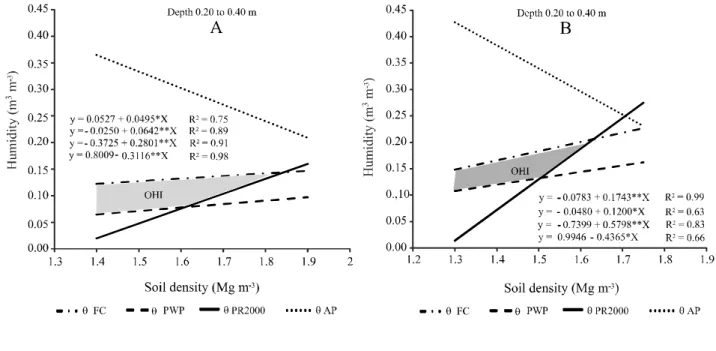
At a depth of from 0.20 to 0.40 m, the OHI of the destructured soil begins to present restriction to
root development at Ds = 1.61 Mg m-3 (Figure 1a),
while the OHI of soil with a preserved structure begins
to show this restriction at Ds = 1.50 Mg m-3 (Figure 1b).
In this study, this occurs when the humidity curve for restrictive resistance to penetration (PR> 2000 kPa)
according Tormena et al. (1998), intersects with the
humidity curve of the permanent wilting point as a function of soil density (Figure 1A and B).
Both for soil samples with preserved and non-preserved structures therefore, behaviour follows the
pattern of premise “a”, as described by Wuet al. (2003),
i.e. the humidity in order for the aeration porosity to be
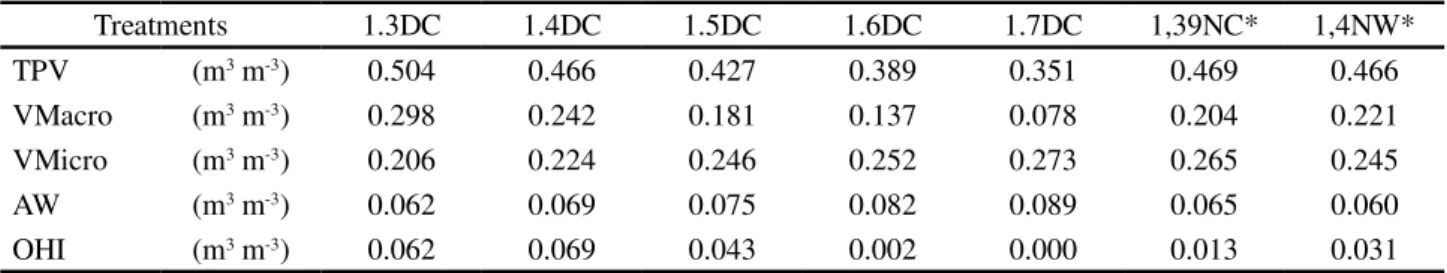
Table 3 - Total pore volume (TPV), macropore volume (VMacro), micropore volume (VMicro), available water (AW) and optimal hydric interval (OHI) of a Yellow Argisol at a depth of from 0.40 to 0.60 m
at least 0.1 m3 m-3 ( ap) is greater than the humidity at field
capacity ( fc), as can be evidenced by the values in Table 2, a condition in which the OHI is equal to the available water.
From that soil density where the humidity at which soil resistance is greater than or equal to 2,000 kPa ( rp), is greater than the humidity at the permanent wilting point ( pwp), the OHI becomes smaller than the AW, a
characteristic of premise “b”, described by Wuet al. (2003),
i.e. ap fc and rp pwp. Additional compaction
may evolve until that soil density at which the humidity where the penetration resistance is 2,000 kPa, is equal to the field capacity humidity. This density is known as the critical density (OHI = 0), not due to drought but due to the mechanical resistance of the soil to root penetration. Therefore, prior to this point, not only should decisions be made relating to irrigation, but also relating to soil management involving, for example, subsoiling or scarification.
For cohesive horizons, the positive effect of subsoiling on root development may be partly explained by the increase in the critical density of those samples with
a preserved structure of from 1.63 Mg m-3 (Figure 1A)
to 1.84 Mg m-3 (Figure 1B), than of destructured samples,
pointing to a beneficial effect on mechanical and hydric behaviour, with the destructuring of the AB horizon of the soil under study. Non-deformed samples from the cultivated
area showed an average density of 1.58 Mg m-3, a value
which is close to the critical density (1.63 Mg m-3), i.e. the
soil already presents mechanical resistance to root growth, even for humidities close to the field capacity. This fact can be confirmed by the decrease in the humidity range suitable
for root development from 0.061 m3 m-3 (WA) to 0.011 m3 m-3
(OHI), for the AB horizon in treatment 1.58CI (Table 2).
Bt horizon (depth from 0,40 a 0,60 m)
Treatments 1.39CI and 1.4DC have a similar Ds and TPV, but it turns out that the destructuring of the soil
resulted in an increase in macroporosity and a reduction in microporosity, bringing the soil closer to that of deformed structure 1.4DC in the natural conditions represented by the woodlands (Table 3). Studying a dystrophic yellow latosol of the coastal plains near the Clotilde plant in Rio Largo on the Alagoas coast,
Vasconceloset al. (2010) also found that compaction of
the soil provided a breakdown of the larger aggregates, and consequently changes in the pore system in general, transforming macropore environments into micropore. Similar behaviour can also be observed in the AB horizon
(Table 2). Silva et al. (2005) studying three different
management systems of sugar cane: one under rainfed cultivation, one under irrigated cultivation and one a cultivated area with the application of vinasse, and also in a wooded area, reported a reduction in macroporosity and a consequent increase in microporosity in the cultivated areas compared to the soil from the woodlands, resulting in changes in the hydric behaviour of a yellow argisol at the Triunfo plant in Alagoas.
The total porosity of the AB horizon (Table 2) was lower than the total porosity of the Bt horizon
(Table 3), as also described by Lima Netoet al. (2009),
who when working with a typical dystrophic Yellow Argisol, found that the total porosity was lower for horizons of a cohesive character, consolidating the presence of this horizon into coastal-plain argisols, and
corroborating Limaet al. (2004), who worked with the
identification and characterisation of cohesive horizons on the coastal plains of the state of Ceará.
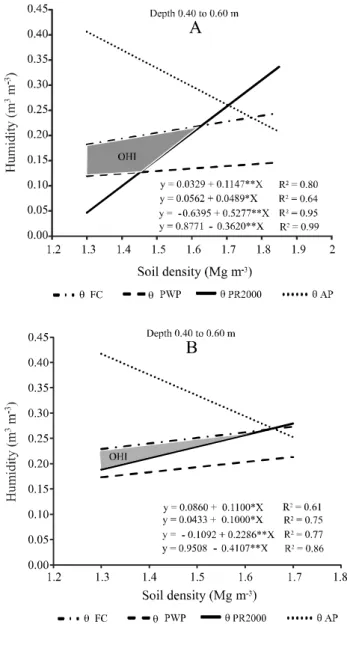
When verifying the AW, it is not possible to observe any hydric restrictions in the Bt horizon of the argisol (Table 3), however a restriction on root development can be seen with the OHI, caused by rp
from Ds = 1.45 Mg m-3 for destructured soil samples
(Figure 2A), while for soil with a preserved structure
the Ds is 1.18 Mg m-3, where rp = pwp (Figure 2B).
Treatments 1.3DC 1.4DC 1.5DC 1.6DC 1.7DC 1,39NC* 1,4NW*
TPV (m3 m-3) 0.504 0.466 0.427 0.389 0.351 0.469 0.466
VMacro (m3 m-3) 0.298 0.242 0.181 0.137 0.078 0.204 0.221
VMicro (m3 m-3) 0.206 0.224 0.246 0.252 0.273 0.265 0.245
AW (m3 m-3) 0.062 0.069 0.075 0.082 0.089 0.065 0.060
OHI (m3 m-3) 0.062 0.069 0.043 0.002 0.000 0.013 0.031
The critical Ds for the Bt horizon was similar for samples with preserved or deformed structures (Figure 2A and B), however the samples with preserved structure showed a reduction in the OHI even for lower soil densities, as can be evidenced in Figure 2B where the area between the humidity curves for penetration resistance is greater than 2000 kPa and the field-capacity humidity is smaller in relation to that of Figure 2A.
Figure 2 - Optimal Hydric Interval (OHI) at a depth of 0.40 to 0.60 m for samples with non-preserved structure (A) and with preserved structure (B) from an area planted with sugar cane. Level of significance for coefficient “b” = * at 5% or ** at 1%. Where: FC = samples with humidity at field capacity; PWP = samples with humidity at the permanent wilting point; RP2000 = samples with resistance to penetration of 2000 kPa in the laboratory; AP = samples with humidity at the aeration porosity
These results prove that there was an improvement in the OHI of those subsurface horizons having a deformed structure, it being observed that treatments with densities equal to or slightly greater than those samples with a non-preserved structure presented an OHI greater than the non-deformed soil samples for both the Bt horizon (Table 3 ) and the AB horizon (Table 2).
CONCLUSIONS
1. Turning the soil increased the OHI in the AB and Bt horizons of the Yellow Argisol cultivated with sugar cane, compared to soil with preserved structure; 2. Subsurface movement of the Yellow Argisol under
study may increase the OHI at higher densities due to the increase in the critical density of the AB and Bt horizons, thus improving the mechanical and hydric behavior of the soil.
REFERENCES
CURI, N. (Coord.).Vocabulário de ciência do solo. Campinas: Sociedade Brasileira de Ciência do Solo, 1993. 90 p.
DIAS JUNIOR, M. S. Compactação do solo. Tópicos em Ciência do Solo. Viçosa, 2000. p. 1-56.
DIAS JUNIOR, M. S.et al. Método alternativo de avaliação da pressão de preconsolidação por meio de um penetrômetro.
Revista Brasileira de Ciência do Solo, v. 28, p. 805-810, 2004.
EMPRESA BRASILEIRA DE PESQUISA AGROPECUÁRIA. Centro Nacional de Pesquisa do Solo.Manual de métodos de análise de solo. 2. ed. Rio de Janeiro, 1997. 212 p.
EMPRESA BRASILEIRA DE PESQUISA AGROPECUÁRIA. Centro Nacional de Pesquisa de Solos.Sistema brasileiro de classificação de solos. 2. ed. Rio de Janeiro, 2006. 306 p.
IMHOFF, S. et al. Quantificação de pressões críticas para o crescimento das plantas. Revista Brasileira de Ciência do Solo, v. 25, n. 1, p. 11-18, 2001.
INSTITUTO BRASILEIRO DE GEOGRAFIA E ESTATÍSTICA. Banco de Dados Agregado: Sistema IBGE de recuperação automática - SIDRA. Disponível: <http://www. ibge.gov.br>. Acesso em: 10 ago. 2011.
JACOMINE, P. K. T. Evolução do conhecimento sobre solos coesos no Brasil. In: CINTRA, F. L. D.; ANJOS, J. L.; IVO, W. M. P. M. WORKSHOP COESÃO EM SOLOS DOS TABULEIROS COSTEIROS, 2001, Aracaju.Anais... Aracaju: EMBRAPA-CPATC, 2001. p. 19-46.
Embrapa, Centro de Pesquisas Pedológicas, 1975, 531 p. (Boletim Técnico, 35).
KAISER, D. R. et al. Intervalo hídrico ótimo no perfil explorado pelas raízes de feijoeiro em um Latossolo sob diferentes níveis de compactação. Revista Brasileira de Ciência do Solo, v. 33, n. 4, p. 845-855, 2009.
LEÃO, T. P. et al. An algorithm for calculating the least limiting water range of soil using SAS.Agronomic Journal, v. 97, n. 4, p. 1210-1215, 2005.
LIMA, H. V. et al. Identificação e caracterização de solos coesos no Estado do Ceará. Revista Brasileira de Ciência do Solo, v. 28, n. 3, p. 467-476, 2004.
LIMA NETO, J. A. et al. Caracterização e gênese do caráter coeso em Latossolos Amarelos e Argissolos dos tabuleiros costeiros do estado de alagoas.Revista Brasileira de Ciência do Solo, v. 33, p. 1001-1011, 2009.
MACHADO, J. L. et al. Inter-relações entre propriedades físicas e os coeficientes da curva de retenção de água de um Latossolo sob diferentes sistemas de uso.Revista Brasileira de Ciência do Solo, v. 32, p. 495-502, 2008.
PACHECO, E. P.; CANTALICE, J. R. B. Análise de trilha no estudo dos efeitos de atributos físicos e matéria orgânica sobre a compressibilidade e resistência à penetração de um Argissolo cultivado com cana-de-açúcar. Revista Brasileira de Ciência do Solo, v. 35, p. 417-428, 2011a.
PACHECO, E. P.; CANTALICE, J. R. B. Compressibilidade, resistência a penetração e intervalo hídrico ótimo de um Argissolo Amarelo cultivado com cana-de-açúcar nos Tabuleiros Costeiros de Alagoas. Revista Brasileira de Ciência do Solo, v. 35, p. 403-415, 2011b.
REZENDE, J. O. Solos coesos dos tabuleiros costeiros: limitações agrícolas e manejo. Salvador: SEAGRI-SPA, 2000, 117 p. (Série Estudos Agrícolas, 1).
SAEG.SAEG: sistema para análises estatísticas, versão 9.1. Viçosa: UFV, 2007.
SILVA, A. J. N.; CABEDA, M. S. V. Modificações na matriz de um Argissolo Amarelo Coeso sob diferentes sistemas de manejo com cana-de-açúcar. Revista Brasileira de Engenharia Agrícola e Ambiental, v. 10, n. 3, p. 554-562, 2006.
SILVA, A. J. N.; CABEDA, M. S. V.; LIMA, J. F. W. F. Efeito de sistemas de uso e manejo nas propriedades físico-hídricas de um argissolo amarelo de tabuleiro costeiro. Revista Brasileira de Ciência do Solo, v. 29, p. 833-842, 2005. SILVA, A. J. N.et al.. Influência do cultivo contínuo da cana-de-açúcar em Latossolos amarelos coesos do Estado de Alagoas: propriedades micromorfológicas.Revista Brasileira de Ciência do Solo, v. 22, p. 515-525, 1998.
SILVA, A. P.et al. Indicadores da qualidade física do solo. In:Física do Solo. Viçosa, Sociedade Brasileira de Ciência do Solo, 2010. p. 241-281.
TORMENA, C. A. et al. Variação temporal do intervalo hídrico ótimo de um Latossolo Vermelho distroférrico em sistemas de plantio direto.Revista Brasileira de Ciência do Solo, v. 31, n. 2, p. 211-219, 2007.
TORMENA, C. A.; SILVA, A. P.; LIBARDI, P. L. Caracterização do intervalo hídrico ótimo de um Latossolo Roxo sob plantio direto.Revista Brasileira de Ciência do Solo, v. 22, p. 573-581, 1998.
VASCONCELOS, R. F. B.et al. Estabilidade de agregados de um Latossolo amarelo distrocoeso de Tabuleiro Costeiro sob diferentes aportes de resíduos orgânicos de cana-de-açúcar.
Revista Brasileira de Ciência do Solo, v. 34, p. 309-316,
2010.