Painterly Rendering Using Human Vision
Hans du Buf Jo˜ao Rodrigues Samuel Nunes Daniel Almeida Vera Brito Jo˜ao Carvalho
Vision Laboratory, Faculty of Sciences and Technology
University of the Algarve, Campus de Gambelas, Faro
{dubuf,jrodrig}@ualg.ptAbstract
Painterly rendering has been linked to computer vision, but we propose to link it to human vision because perception and painting are two processes that are interwoven. Recent progress in developing computational models allows to establish this link. We show that completely automatic rendering can be obtained by applying four image representations in the visual system: (1) colour constancy can be used to correct colours, (2) coarse background brightness in combination with colour coding in cytochrome-oxidase blobs can be used to create a background with a big brush, (3) the multi-scale line and edge representation provides a very natural way to render finer brush strokes, and (4) the multi-scale keypoint representation serves to create saliency maps for Focus-of-Attention, and FoA can be used to render important structures. Basic processes are described, renderings are shown, and important ideas for future research are discussed.
Keywords
Perception, colour, brightness, attention, NPR, painterly rendering.
1. INTRODUCTION
We combine two different research areas in this paper: non-photorealistic rendering (NPR), in particular painterly rendering of images or photographs by means of dis-crete brush strokes; and visual perception, in particu-lar computational models that have been—or are being— developed for colour and brightness perception and Focus-of-Attention. Painterly rendering has been combined with computer vision [14, 21, 36], but, in our view, it should be linked to human vision because painting is intrinsically related to the way we perceive the external world, i.e. real scenes or photographs.
NPR is a research area which aims at transforming input images (photographs, data) into output images which re-semble the input, but an artistic impression can be created. For a recent NPR taxonomy and survey of stroke-based rendering techniques see [18, 37]. In this paper we ad-dress painterly rendering in the sense of Hertzmann [17], i.e., completely automatic creation of paintings by using brush strokes of different sizes. Since painters often select fine brushes in regions with important detail structures, we can combine painterly rendering with stylisation and
ab-straction as introduced by DeCarlo and Santella [6], but
with automatic selection of the regions. In addition, since painters often exaggerate colours, we apply a method for transforming dull colours into more vivid ones.
The goal of this paper is to show how we can apply mod-els of visual perception. Painters have learned to observe and to select important structures to be painted, and do
this quasi-automatically or intuitively. Rendering schemes must be developed that do the same, which requires good insight into our visual system and processes in the vi-sual cortex. In this paper we illustrate painterly render-ing based on cortical image representations. In view of the many aspects involved, like disparity (stereo, depth), mo-tion and texture percepmo-tion, we will concentrate on only three aspects for which state-of-the-art models are avail-able: colour constancy, brightness perception on the basis of multi-scale line/edge representations, and saliency maps for Focus-of-Attention based on keypoint representations. Future extensions may involve texture perception for ren-dering realistic textures, simulating the hand of a painter while painting fine, repetitive textures, and motion percep-tion for creating animapercep-tions from video; see also Discus-sion.
This paper is organised as follows: Section 2 introduces basic concepts. Sections 3, 4 and 5 deal with bright-ness perception and line/edge interpretation, Focus-of-Attention and keypoints, and colour constancy. Rendering procedures are explained and illustrated in Section 6, and we conclude with a discussion in Section 7.
2 From perception to rendering
In area V1, which is the input layer of the visual cortex, there are simple and complex cells which are tuned to dif-ferent spatial frequencies (scales) and orientations. Sim-ple cells are often modelled by means of comSim-plex Gabor functions, with a real cosine component and an imaginary sine component, both Gaussian windowed, and complex
cells are then modelled by the modulus, see [9]. Many of these cells are also tuned to disparity (stereo, depth) because of the neighbouring, periodic left-right hyper-columns, e.g. [19, 28]. All these cells provide input for grouping cells that code line and edge information and that attribute depth. There also are end-stopped cells that, to-gether with complicated inhibition processes, allow to ex-tract keypoints (singularities, vertices and points of high curvature). Recently, models of simple, complex and end-stopped cells have been developed, e.g. [16]. In addi-tion, several inhibition models [15, 27], keypoint detection [16, 32] and line/edge detection schemes [12, 15, 32, 38], including disparity models [13, 31], have become avail-able. On the basis of these models and neural process-ing schemes, it is now possible to create a cortical ar-chitecture for e.g. figure-ground segregation [20, 40] and Focus-of-Attention (FoA) [25], including object detection and recognition with both bottom-up and top-down data streams in the ventral what and dorsal where subsystems [7, 29, 34]. A detailed introduction of all these processes is beyond the scope of this paper.
In the following sections we will explain a few processes and show how perception models can be employed in NPR. These models cover four aspects:
1. Brightness perception based on the multi-scale line/edge representation provides a very natural way for painterly rendering [17], with brush sizes that are coupled to the scale of image analysis, from coarse (global structures) to fine (local detail). Many painters start with big brushes in order to create a background with coarse regions, after which smaller brushes are used to paint small structures. Here we will not go into special techniques like clair-obscur and will only apply wet-on-dry, i.e. a new (wet) brush stroke will substitute previously applied (dry) strokes.
2. A global background level of brightness cannot be coded by cortical simple and complex cells if these are modelled by bandpass Gabor filters with a zero— or very small, residual—DC component. However, apart from the rods and cones, the common pho-toreceptors, retinal ganglion cells have been identi-fied that have no (in)direct connection to rods and cones; their dendrites act as photoreceptors [1]. These ganglion cells transfer global luminance information to central brain regions, for controlling the circadian clock (solar day) and the eyes’ iris muscles (pupil size). Because of their projections on ventral and dor-sal areas of the LGN (lateral geniculate nucleus), it is assumed that they also project on the cytochrome-oxidase (CO) blobs in the cortical hypercolumns, where colour information from the retinal cones is processed [19]. This way, colour coding in CO blobs is complemented with a global brightness level, and this representation will be used to paint a background with very large brush strokes. We will not devote a separate section to this aspect, because the solution is extremely simple; see Section 6.
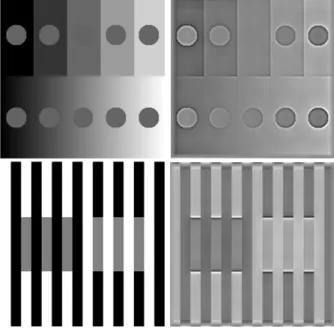
Figure 1. Brightness induction effects (left) and model predictions (right).
3. Colour constancy, which means that the colours of a scene or image are perceived with little influence of the illumination spectrum (colours of light sources), can be obtained by applying the retinex theory [23] or the more recent ACE (Automatic Colour Equalisa-tion) model [30]. The ACE model can be applied to create more vivid colours, an effect that can be ob-served in many paintings.
4. Focus-of-Attention by means of the multi-scale key-point representation and saliency maps can be used to guide the rendering such that line/edge-based brush strokes are only applied in image regions with a cer-tain complexity. This aspect is related to image styli-sation and abstraction [6], but automatic generation of saliency maps eliminates the need to record eye movements, i.e. fixation points, of persons who are actually looking at the image to be rendered.
There is a relation between colour constancy and bright-ness perception. However, this relation is very complex and not sufficiently covered in the literature concerning computational models. Therefore we will not go into de-tail. Another aspect will be ignored too: DeCarlo and San-tella [6] employed the contrast sensitivity function (CSF) of sinewave gratings to suppress fixation points in regions with low contrast. We will not do this for two reasons: (1) A CSF depends on retinal eccentricity, the size of the gratings and background luminance, and can only be mea-sured under very controlled experimental conditions and with very trained observers. (2) The sinewave CSF may
only be used in the case of sinusoidal patterns. CSFs in the
case of other gratings (squarewave, trapezoidal) are dif-ferent, and all CSFs of periodic gratings differ completely
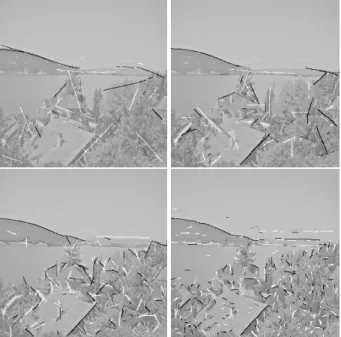
Figure 2. Event maps at four scales. from threshold curves of aperiodic patterns like blobs or discs [8]. Nevertheless, in NPR it may make sense to sup-press very low-contrast patterns, but a unified detection model that can be applied to all patterns remains a Holy
Grail of visual psychophysics [3, 10].
Below, we illustrate the application of the perception mod-els, without going into the mathematics of the modmod-els, but with first results created by painterly rendering. In the next three sections we explain the brightness model, keypoints and FoA, and the ACE model.
3 Lines, edges and brightness
Figure 1 (left) shows two brightness induction effects, i.e. simultaneous brightness contrast (top) and assimila-tion (bottom). All nine circles have the same level of grey (pixel value), as have the six grey bars, which means that under homogeneous illumination they should appear equal in brightness. However, it can be seen that in simultaneous brightness contrast the background pushes the brightness of the circles in the opposite direction: grey circles against a dark background become brighter. On the other hand, in assimilation the black flanking bars pull the brightness of the grey bars in the same direction. Figure 1 shows correct model predictions.
For explaining the model predictions, it is necessary to as-sume that our visual system reconstructs, more or less, the input image. For example, image reconstruction can be based on one lowpass filter plus a complete set of bandpass wavelet filters such that the frequency domain is evenly covered. This is the basis of many image coding schemes, and could be used in the visual cortex because simple cells in V1 are often modelled by complex Gabor wavelets (bandpass filters) [16], and lowpass information is avail-able through the special retinal ganglion cells with
pho-Figure 3. Symbolic line/edge interpretations at the four scales.
toreceptive dendrites [1]. Activities of all cells could be combined by summing them in one cell layer that would provide a brightness map. But then there is a big problem: it is necessary to create another observer of this map in our brain.
The solution is simple: instead of summing all cell ac-tivities, we can assume that the visual system extracts lines and edges from simple- and complex-cell responses, which is necessary for object recognition, and that re-sponding “line cells” and “edge cells” are interpreted sym-bolically. For example, responding line cells along a bar signal that there is a line with a certain position, orien-tation, amplitude and scale, the latter being interpreted by a Gaussian cross-profile which is coupled to the scale of the underlying simple and complex cells. The same way a responding edge cell is interpreted, but with a bipo-lar, Gaussian-truncated, error-function profile. This multi-scale symbolic interpretation, in combination with lowpass information—the special retinal ganglion cells with pho-toreceptive dendrites—forms the basis for the model pre-dictions shown in Fig. 1 and image reconstruction shown below. In addition, this brightness model is one of the very few that can predict Mach bands seen at ramp edges but not at ideal step edges [26]: the crucial idea is that simple-cell responses do not allow to distinguish between ramp edges and lines, which explains why bright and dark lines are seen at ramp edges [9]. The model was shown to be able to predict more brightness illusions, but was first tested in 1D [11] and is currently being extended to 2D.
Figures 2, 3 and 4 illustrate visual reconstruction. Figure 2 shows event maps at four scales, i.e., detected positions of positive and negative lines and edges, coded by grey
Figure 4. Visual reconstruction (top-right) based on lowpass filtering (top-left) and line/edge interpretations (bottom).
level and superimposed on a low-contrast version of the input image (the “lake” input image is shown in B/W in Fig. 6 and in colour in Figs 7 and 12). The actual detec-tion process, with soludetec-tions to solve problems related to stability, completeness and curvature, has been described elsewhere [33]. Figure 3 shows symbolic line/edge inter-pretations at the same four scales. Figure 4 illustrates the reconstruction process by summing lowpass information (top-left) and combined interpretations with real event am-plitudes at the four scales (only two scales are shown at the bottom) and the result (top-right). Using more filter scales leads to better reconstructions and the relative weighting of all information is very important in developing brightness models. The basic idea for NPR follows from Figs 2 and 3: event positions form strokes and the size of the profiles de-termines brush size, in the case of edges two parallel brush strokes.
4 Keypoints, saliency and FoA
Responses of end-stopped cells in V1 are very fuzzy and require optimised inhibition processes in order to detect, with high precision, keypoints at singularities like edge crossings. Recently, the original, single-scale model [16] has been further stabilised and extended to arbitrary scale, and the multi-scale keypoint representation has been used to detect faces [34].
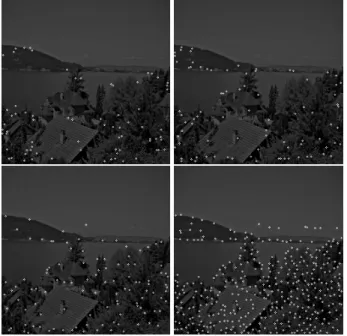
Figure 5 shows detected keypoints in the case of the same image (Figs 6 and 12) and at the same scales as used in Figs 2 and 3. In general, keypoints are stable over certain scale intervals: over fine scales at fine image detail, over medium scales at coarser structures, etc. For a detailed analysis of keypoint behaviour in scale space we refer to
Figure 5. Keypoint maps at the four scales. [34]. If we assume that detected keypoints are summed over all scales, which is a retinotopic (neighbourhood-preserving) projection by grouping cells in a saliency map, keypoints which are stable over many scales will result in large, distinct peaks. In other words, since keypoints are related to local image complexity, such a saliency map codes complexity at different scales, and different saliency maps can be created at fine, medium and coarse scales, in-dicating interesting points at those scales. Figure 6 shows, apart from the input image (B/W), such a map as a normal image and in projected view. The regions around the peaks were created by assuming that each peak has a certain
Region-of-Interest (RoI): keypoints at a certain scale
in-herit the “size” of the underlying simple and complex cells, as was the case of the line/edge profiles in the previous sec-tion. Retinotopic projections over scale intervals therefore result in distinct peaks (actual positions) plus RoIs that are coupled to scale (in Fig. 6 we only show one map obtained after summing over many scales).
Because saliency maps code complexity in terms of po-sition and RoI, such maps provide ideal information for Focus-of-Attention, a process used to steer our eyes and mental attention [25]: to plan saccadic eye movements be-tween fixation points (the peaks), and during fixation the stable information in the RoI (lines/edges, disparity) has time to be processed in V1 and, also during the next sac-cade, to propagate to area V2 and higher cortical areas. Here our point is that saliency maps can be used in NPR in order to control the rendering, using brushes of a certain size only inside the RoIs around the peaks. This eliminates the need to record eye movements [6].
5 Colour constancy
Colour constancy is the effect that the colours of a scene or image are perceived with little influence of the colour of
Figure 6. Input image (B/W) and a saliency map for FoA.
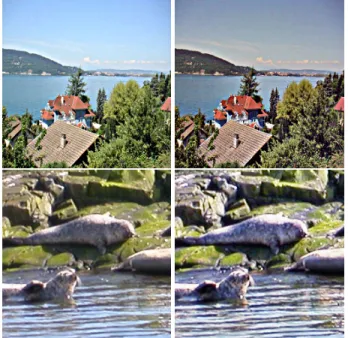
the light source. The retinex theory [23] explains this by assuming that local colour depends on the surrounding re-gion or even the entire image. The recent ACE (Automatic Colour Equalisation) model [30] achieves this in two pro-cessing steps in the RGB channels: First, chromatic and spatial adjustment of each pixel is applied by subtracting R, G and B values of all pixels, thereby employing a non-linear saturation function to the differences and weighting the contributions of all pixels by a Euclidean distance func-tion. Second, dynamic tone reproduction scaling serves to rescale, linearly but with clamping, the R, G and B values of all pixels to use the available range, normally from 0 to 255 (8 bits) in 24-bit images. Figure 7 shows the “lake” and “seals” images before (left) and after (right) applying the ACE model. As can be seen, contrast and colour ranges have been stretched, and the colours are more balanced. This effect is ideal for automatic, unsupervised NPR on the basis of unprocessed photographs (we note that con-trast stretching, although not on the basis of a perception model, can be easily achieved by packages like Adobe’s Photoshop, Corel’s Paint Shop Pro and GNU’s GIMP). 6 Painterly rendering
The models described above are employed in a sequence of processing steps. Two steps can be seen as options: (1) If the colours of an image are very pleasing because they convey a certain mood, for example a sunset with red-dish colours against a dark landscape and sky, the ACE model may change the mood drastically and it may be bet-ter to skip colour equalisation. (2) Stylisation by means of saliency maps leads to less brush strokes in regions
Figure 7. Colour correction by the ACE model (right).
where there are no or few keypoints, for example along long edges between homogeneous regions. Application of stylisation may therefore suppress important structures and the user can decide to experiment with and without styli-sation. Below we will illustrate a few effects and option selections, but the normal procedure is the following: First, the ACE model is applied to the input image. Sec-ond, a background image is created. In order to obtain the effect of a painted undergound, a large brush size of 16 by 32 pixels, for example, is applied: (A) A position and an orientation are selected randomly. (B) Three colours are picked in the ACE image, at the actual position (the centre of the stroke) and at the two end points. (C) If the colour at one of the end points deviates significantly from the av-erage of the other two colours, the stroke will not be ap-plied. The reason is simple: the orientation of this stroke is such that it covers two distinct regions, and a wrong colour would be introduced in one region in which no line/edge information may be available. This colour may not be cor-rected by line/edge-related brush strokes, for example in homogeneous regions like the sky or in water. (D) If the three colours do not deviate significantly, they are aver-aged, the stroke will be painted, and we continue with step A. (E) This procedure is repeated until the entire image (all pixels) has been covered, counting the number of painted strokes, and then the same number of strokes will be ap-plied again using the same procedure. This repetition with random positions and orientations will cover many previ-ously painted strokes such that only parts remain visible, which yields more realistic results. Figure 8 shows created backgrounds in the case of the colour-corrected “lake” and “seals” images shown in Fig. 7. The strokes which were painted last are clearly visible because they are complete.
Figure 8. Created background images: lake (top) and seals (bottom).
Finally, detected lines and edges (event type, position, scale) are rendered, scale by scale, by continuous brush strokes with colours that are picked in the colour-corrected image. This is accomplished in seven steps:
1. Detected events are checked for continuity, sepa-rated, and continuous sequences of (x, y) positions are stored in lists. Lists that contain more than 16 po-sitions are divided into separate lists. If there are a few more positions, like 18, we keep the entire list, but a list of 21 will be separated into two lists of 10 and 11. This is done to prevent rendering very long strokes with one and the same colour, which are of-ten detected at coarse scales. In the future, the num-ber of positions (16, 18) will be varied such that lists (strokes) will be shorter at fine scales.
2. Each list is filtered in order to transfer discrete
lat-Figure 9. Polygon (triangle) construction us-ing lines perpendicular to average left-right slopes.
tice positions into smooth strokes with coordinates in floating point. The filtering applied consists of itera-tively moving each point in the direction of the line defined by the point’s four neighbouring points, two on each side, until movements become very small [24]. As a result, strokes are slightly “randomised,” as if they were painted by hand.
3. The centre point of each list is determined by count-ing. If this point is within a RoI of the saliency map at the list’s scale, the entire list will be rendered as one stroke. If not, a new list will be processed. As men-tioned above, the selection can be skipped if stylisa-tion leads to incomplete structures.
4. Through each point, a perpendicular line is computed on the basis of the average of the slopes of the two lines that connect the point with its two neighbours, see Fig. 9.
5. Point pairs are used to create polygons by (a) using the perpendicular lines and (b) a distance to the points that depends on brush size. In the case of rendering an edge, two but connected polygons are created, one on each side.
6. Colours are picked in the colour-corrected image: a line stroke is rendered by averaging the colours at all the list’s positions, and an edge stroke by two colours that are the averages of the colours at symmetric po-sitions off the centre list on the perpendicular lines. 7. All polygons (or triangles) are rendered using
OpenGL, with texture (opacity) mapping in the al-pha channel. Below we will illustrate two mappings: gradual opacity maps for creating clean, ellipsoidal-like strokes (as were used in Fig. 8), and real, digitised strokes composed of randomly-selected heads, bodies and tails.
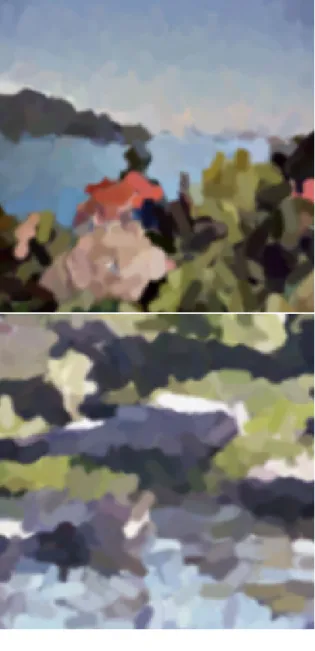
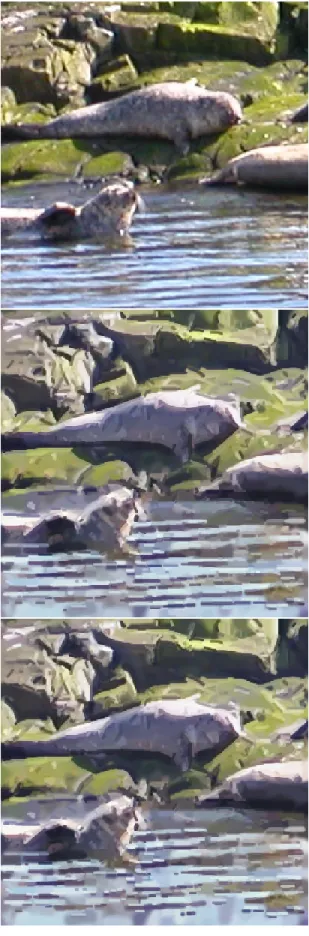
Figure 10 shows discretised and painted strokes at four scales and Fig. 11 the combination with the background, using coarse-to-fine-scale colour replacement which sim-ulates painting wet-on-dry (at the moment, all individual brush strokes replace previously rendered positions). It can be seen that adding finer scales leads to many local correc-tions, i.e. to more realistic detail. Final results are shown in Figs 12 (lake) and 13 (seals). These results were obtained by using only five scales, from medium to fine, and clean,
Figure 10. Discrete strokes at the four scales.
artificial strokes. The middle images were created without saliency maps, the bottom ones with saliency maps. The difference is clearly visible in the case of the seals image, but not in the case of the lake image (only two positions at the edge between the sky and the landscape).
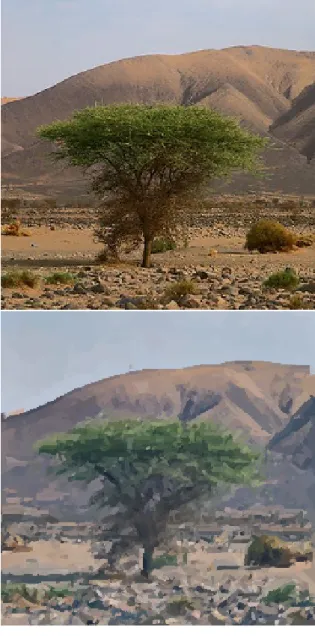
Figure 14 shows the background and final result in the case of the lake image when rendered with real, digitised strokes (compare with Figs 8 and 12). These strokes are composed of randomly-combined heads, bodies and tails from digitised oil-painted strokes, see Fig. 15, which are used to control colour opacity. As can be seen, the use of real brush strokes changes our impression of the “paint-ings.” Figures 16 to 18 show more examples, i.e. with real (16) and clean (17,18) brush strokes. Finally, Fig. 19 shows results without (top) and with the application of colour equalisation. Two different parameter selections (mini-mum contrast, middle; maxi(mini-mum contrast, bottom) of the ACE model yield more vivid colours, for example the blue in the sky, but the mood of the reddish sunset has been lost. This is an example of a case where it may be better not to apply colour equalisation.
7 Discussion
We have seen that perception models can provide a solid basis for NPR, specifically for painterly rendering. Colours can be corrected to cover the available dynamic range, such that unprocessed photographs are optimised and colours become more vivid. Coarse brightness and colour cod-ing can be used to create a painted background with very large brush strokes, thereby avoiding painting across edges with different colours. The symbolic line/edge interpreta-tion translates directly into brush strokes, and adding more scales (finer brushes) leads to more realistic renderings. Saliency maps can be used to steer the rendering by
paint-Figure 11. Rendering coarse to fine scale. ing lines and edges only in regions with sufficient plexity. As mentioned in the Introduction, our goal is
com-pletely automatic painterly rendering by using human
vi-sion. Although all processing steps can be selected, there are a few options that the user can (de)select. The most important options, with possible solutions or alternatives, are:
1. Colour correction by the ACE model often leads to brighter, more vivid colours, especially after exper-imenting with ACE’s own parameters (different sat-uration and distance functions), but sometimes this effect is not desired. If the colours of the input im-age convey a desired mood or effect, for example, the ACE model can be skipped. Automatically applying ACE or not, or selecting its parameters, requires a
pri-ori knowledge or years of research into local/global
colour histograms and their relation to subjective in-terpretations of many observers. The user is always free to edit the colour gamut with standard techniques, like decreasing saturation in the case of preparing a watercolour rendering (transfer RGB space to HSV, reduce saturation and then transfer back to RGB). 2. Stylisation by selecting brush strokes on the basis
of keypoints and their ROIs may interrupt long lines and edges if no vertices or other structures like tex-tures are present, and the painted background may be too random to convey continuity. The approach pre-sented here is only one of many possibilities, because saliency maps at different scales can be used or com-bined in other ways. In addition, postprocessing of detected lines, edges and keypoints could be used to detect long and important structures. This solution might replace the use of image segmentation in con-junction with edge detection [6].
Figure 12. Input image (top) and rendering
Figure 14. Rendering with real brush strokes.
3. Many line/edge scales can be selected: the more scales are used, the more realistic the rendering will be (from NPR to nPR to PR), which may not be desir-able. Our impression is that, apart from the big brush strokes to render the background, only very few scales may lead to best results, but this requires many exper-iments with many images and renderings and subjec-tive ratings of many observers. In addition, in order to improve the painterly effect, the few selected scales could be applied two or more times by overpainting already painted strokes using interpolations of stroke lists. Although such a process better resembles the technique applied by real artists, finer brushes may be necessary in some cases, for example when painting (small) faces. The multi-scale keypoint representa-tion has already been used to detect faces [34], and detected faces and their positions plus sizes could be used to control scale selection, but many other objects
Figure 15. Examples of heads, bodies and tails.
may require the same processing. This aspect is per-haps the most difficult one, because it relates to cogni-tive image interpretation and distinction between im-portant and unimim-portant objects to be painted or to be left out.
Renderings shown here are first results produced to test the methods in an integrated framework. We intentionally did not present results obtained with different styles, in or-der to illustrate possibilities but also problems of the basic approach. Experiments with different styles and compar-isons with renderings based on computer vision will be re-ported in forthcoming papers. Apart from improvements and future research as mentioned above, there are many other possibilities that can be explored to enhance artistic effects: (1) to test different ways of picking colours, for example only at one (two) central position(s) of a stroke, instead of by averaging colours under an entire stroke as done here, (2) to discretise and/or randomise positions, ori-entations, lengths and colours, for simulating styles like impressionism, expressionism or cubism, and (3) to re-place the brush strokes by a library of strokes created by using different brush types, e.g. [39]. The latter aspect in-cludes mixing painting wet-on-dry and wet-in-wet for sim-ulating different types of oil paintings and watercolours, in addition to using opacity maps—possibly also bump or normal mapping—for simulating the texture of a canvas or paper in combination with different media like oil, crayon and charcoal.
A bigger challenge is to find new applications that may foster new styles in contemporary visual arts. An example is symbolic pointillism that exploits Gestalt laws of cogni-tive psychology [22]. Instead of combining segmentation and single-scale edge-detection methods in stylisation and abstraction [6], our line and edge representation could be used for the same purpose, i.e., the creation of cartoon-like effects. In addition to rendering important edges on top of large, homogeneous regions, regions could be hatched (textured) such that an impression of 3D shape is obtained. This requires a cortical model for solving the shape-from-shading problem, which could be combined with a dis-parity model in the case of using a stereo camera, and could lead to automatic production of etchings. Such an approach can complement suggestive contours based on
radial curvature, in both still images and animations [5]. Texture segmentation is often based on complex Gabor fil-ters (simple cells). For example, analysis of the symmetry order for separating linear, rectangular and hexagonal pat-terns can be achieved by complex moments but also by a simple cortical model [2, 35]. Within segmented regions, the symmetry order along with detected orientations at dif-ferent scales can be used to render realistic textures [39]. A good model of motion perception could be used to solve problems in creating animations from video. Instead of rendering frame by frame, effects of moving objects and a panning and tilting camera can be combined to create a stable background, adding moving objects and new infor-mation at the image borders in a consistent way [4]. Ad-ditional perception models and rendering techniques may be employed in the future, because we just started looking
through the eyes of the painter!
Acknowledgements This research is partly financed by
PRODEP III Medida 5, Action 5.3, and by the FCT pro-gram POSI, framework QCA III. The ACE model imple-mentation was provided by Alessandro Rizzi. The “lake,” “canal” and “thinker” images are courtesy of Doug De-Carlo.
References
[1] D. Berson. Strange vision: ganglion cells as cir-cadian photoreceptors. TRENDS in Neurosciences, 26(6):314–320, 2003.
[2] J. Bigun and J.M.H. du Buf. N-folded symmetries by complex moments in Gabor space and their applica-tion to unsupervised texture segmentaapplica-tion. IEEE Tr.
Pattern Anal. Machine Intell. PAMI-16, pages 80–87,
1994.
[3] U. Bobinger and J.M.H. du Buf. In search of the Holy Grail: a unified spatial detection model. 25th ECVP,
Glasgow (UK), Perception Vol. 31 (Suppl.), page 137,
2002.
[4] J.P. Collomosse, D. Rowntree, and P.M Hall. Stroke surfaces: temporally coherent non-photorealistic an-imations from video. IEEE Tr. Vis. Comp. Graphics, 11(5):540–549, 2005.
[5] D. DeCarlo, A. Finkelstein, and S. Rusinkiewicz. Interactive rendering of suggestive contours with temporal coherence. Proc. ACM/SIGGRAPH-Eurographics NPAR, Annecy (France), pages 15–24,
2004.
[6] D. DeCarlo and A. Santella. Stylization and abstrac-tion of photographs. Proc. ACM SIGGRAPH ’02, pages 769–776, 2002.
[7] G. Deco and E.T. Rolls. A neurodynamical cortical model of visual attention and invariant object recog-nition. Vision Res., (44):621–642, 2004.
[8] J.M.H du Buf. Modelling spatial vision at the thresh-old level. Spatial Vision, 6(1):25–60, 1992.
Figure 16. Using real brush strokes. [9] J.M.H. du Buf. Ramp edges, Mach bands, and the
functional significance of simple cell assembly. Biol.
Cybern., 70:449–461, 1994.
[10] J.M.H. du Buf. Modelfest and contrast-interrelation-function data predicted by a retinal model. 28th
ECVP, A Coru˜na (Spain). Perception Vol. 34 (Suppl.),
page 240, 2005.
[11] J.M.H. du Buf and S. Fischer. Modeling brightness perception and syntactical image coding. Optical
Eng., 34(7):1900–1911, 1995.
[12] J.H. Elder and S.W. Zucker. Local scale control for edge detection and blur estimation. IEEE Tr.
Pat-tern Anal. Machine Intell. PAMI-20, pages 699–716,
1998.
[13] D.J. Fleet, A.D. Jepson, and M.R.M. Jenkin. Phase-based disparity measurement. CVGIP: Image
Figure 17. Using clean brush strokes. [14] B. Gooch, G. Coombe, and P. Shirley. Artistic
vision: painterly rendering using computer vision techniques. Proc. ACM/SIGGRAPH-Eurographics
NPAR, Annecy (France), pages 83–91, 2002.
[15] C. Grigorescu, N. Petkov, and M.A. Westenberg. Contour detection based on nonclassical recep-tive field inhibition. IEEE Tr. Image Processing, 12(7):729–739, 2003.
[16] F. Heitger et al. Simulation of neural contour mecha-nisms: from simple to end-stopped cells. Vision Res., 32(5):963–981, 1992.
[17] A. Hertzmann. Painterly rendering with curved brush strokes of multiple sizes. Proc. ACM SIGGRAPH 98, pages 453–460, 1998.
[18] A. Hertzmann. A survey of stroke-based rendering.
IEEE Comp. Graphics Appl., 23(4):70–81, 2003.
Figure 18. Using clean brush strokes. [19] D.H. Hubel. Eye, brain and vision. Scientific
Amer-ican Library, 1995.
[20] J.M. Hupe et al. Feedback connections act on the early part of the responses in monkey visual cortex.
J. Neurophysiol., 85(1):134–144, 2001.
[21] L. Kov´acs and T. Szir´anyi. Painterly rendering con-trolled by multiscale image features. Proc. 20th Spring Conf. Comp. Graphics, Budmerice (Slovakia),
pages 177–184, 2004.
[22] N. Kr¨uger and F. W¨org¨otter. Symbolic pointillism: Computer art motivated by human brain structures.
Leonardo, MIT Press, 38(4):337–341, 2005.
[23] E. Land and J. McCann. Lightness and retinex theory.
J. Opt. Soc. Am., 61:1–11, 1971.
[24] S. Nunes, D. Almeida, E. Loke, and J.M.H. du Buf. Polygon optimization for the modelling of planar
Figure 19. Without (top) and with ACE. range data. 2nd Iberian Conf. IbPRIA, Estoril
(Por-tugal),, Springer LNCS Vol. 3522:128–136, 2005.
[25] D. Parkhurst, K. Law, and E. Niebur. Modelling the role of salience in the allocation of overt visual atten-tion. Vision Res., 42(1):107–123, 2002.
[26] L. Pessoa. Mach bands: how many models are possi-ble? Recent experimental findings and modeling at-temps. Vision Res., 36:3205–3227, 1996.
[27] N. Petkov, T. Lourens, and P. Kruizinga. Lateral inhi-bition in cortical filters. Proc. Int. Conf. Dig. Signal
Processing and Int. Conf. Computer Appllications to Eng. Systems,, Nicosia (Cyprus):122–129, 1993.
[28] C. Rasche. The making of a neuromorphic visual
sys-tem. Springer, 2005.
[29] R. Rensink. The dynamic representation of scenes.
Visual Cogn., 7(1-3):17–42, 2000.
[30] A. Rizzi, C. Gatta, and D. Marini. A new algorithm for unsupervised global and local color correction.
Pattern Recogn. Lett., 24(11):1663–1677, 2003.
[31] J. Rodrigues and J.M.H. du Buf. Vision frontend with a new disparity model. Early Cogn. Vision
Worksh., Isle of Skye, Scotland, see
http://www.cn.stir.ac.uk/ecovision-ws/,
2004.
[32] J. Rodrigues and J.M.H. du Buf. Visual cortex fron-tend: integrating lines, edges, keypoints and dispar-ity. Int. Conf. Image Anal. Recogn., Springer LNCS Vol. 3211:664–671, 2004.
[33] J. Rodrigues and J.M.H. du Buf. Improved line/edge detection and visual reconstruction. Proc. 13th
Por-tuguese Comp. Graphics Meeting (13EPCG), Vila Real, pages 179–184, 2005.
[34] J. Rodrigues and J.M.H. du Buf. Multi-scale key-points in V1 and face detection. 1st Int. Symp. Brain,
Vision and Artif. Intell., Naples (Italy),, Springer
LNCS Vol. 3704:205–214, 2005.
[35] L.M. Santos and J.M.H. du Buf. Computational cor-tical cell models for continuity and texture. Biol.
Mo-tivated Comp. Vision Worksh., Tuebingen., Springer
LNCS Vol. 2525:90–98, 2002.
[36] M. Shiraishi and Y. Yamaguchi. An algorithm for automatic painterly rendering based on local source image approximation. Proc. ACM/SIGGRAPH-Eurographics NPAR, Annecy (France), pages 53–58,
2000.
[37] M. Sousa. Theory and practice of non–photorealistic graphics: Algorithms, methods, and production systems. Course Notes for SIGGRAPH03, see
http://pages.cpsc.ucalgary.ca/˜mario/,
2003.
[38] J.H. van Deemter and J.M.H. du Buf. Simultaneous detection of lines and edges using compound Gabor filters. Int. J. Patt. Recogn. Artif. Intell., 14(6):757– 777, 1996.
[39] B. Wang, W. Wang, H. Yang, and J. Sun. Effi-cient example-based painting and synthesis of 2D directional texture. IEEE Tr. Vis. Comp. Graphics, 10(3):266–277, 2004.
[40] L. Zhaoping. V1 mechanisms and some figure-ground and border effects. J. Physiology, pages 503– 515, 2003.