7
Low cost carriers and tourism destinations development: case study of Oporto, Portugal
As companhias aéreas de baixo custo e o desenvolvimento dos destinos turísticos: um estudo de caso do aeroporto do Porto, Portugal
Vânia Costa
School of Management, Polytechnic Institute of Cávado and Ave, Campus do IPCA, 4750-810 Barcelos, Portugal. GOVCOPP – Research Unit in Governance, Competitiveness and Public Policies, University of Aveiro, Portugal, [email protected]
Cláudia Almeida
School of Management, Hospitality and Tourism, University of Algarve, Campus da Penha, 8005-139 Faro, Portugal. Research Centre for Spatial and Organizational Dynamics (CIEO), Campus de Gambelas, Faro, Portugal, [email protected]
Abstract
Mobility is one of the characteristics of modern society. The world today, despite the uncertainties brought by globalization is an interconnected reality of networks, whether physical or virtual. In Europe this mobility is higher than before due to the new offer of routes and frequencies of airlines, mainly of the low cost carriers (LCC). Portugal is one of the countries that grew in terms of new routes, new destinations and above all new customers with economic impacts in the regions. Over the last decade, LCC at Oporto (OPO) airport have boosted their traffic volume by approximately 260%. The evolution of OPO airport, generated by LCC, has meant that other regional airports have followed this trend and have also experienced a positive and growing net impact on their local economy.
The main issue of this study is to analyse the evolution of LCC air traffic at Francisco Sá Carneiro Airport in OPO and its economic impact on this airport’s area of influence. We use a cost-benefit analysis model to determine the costs, benefits and net impact of low cost routes on the development of the local economy between 2005 and 2012. In 2005 these carriers started operating at OPO Airport.
Keywords: Airports, cost-benefit analysis, low cost carrier, regional development, economic impact.
Resumo
A mobilidade é uma das características da sociedade moderna. O mundo de hoje, apesar das incertezas trazidas pela globalização, é uma realidade interconectada de redes, sejam elas físicas ou virtuais. Na Europa, essa mobilidade é maior do que antes devido à nova oferta de rotas e frequências de companhias aéreas, principalmente das companhias de baixo custo (LCC).
Portugal é um dos países que cresceu quer em termos de novas rotas, novos destinos e, sobretudo, novos clientes, gerando impactos económicos regionais. Ao longo da última década, as companhias áreas de baixo custo que operam no aeroporto do Porto (OPO) aumentaram o volume de tráfego em aproximadamente 260%. Esta evolução, gerada pelas LCC, significou que outros aeroportos regionais seguiram essa tendência e também experimentaram um impacto líquido positivo e crescente na sua economia local.
Este estudo tem como principal objetivo analisar a evolução do tráfego aéreo do LCC no Aeroporto Francisco Sá Carneiro (OPO) e o seu impacto económico na área de influência. Foi utilizado um modelo de análise de custo-benefício para determinar os custos, benefícios e impacto líquido das rotas de baixo custo no desenvolvimento da economia local entre 2005 e 2012. As operadoras áreas de baixo custo começaram a operar no aeroporto OPO em 2005.
Palavras-chave: Aeroportos, análise custo benefício, low cost carrier, desenvolvimento regional, impacto económico.
1. Introduction
In recent years, air transport has significantly increased the number of flights, routes, destinations and passengers, heavily contributing to the process of airspace liberalisation. This process has led to a shift from a management model with heavy state intervention to a competitive market model, allowing the entry of LCC. These carriers have enabled consumers to enjoy a wider range of supply and low airfares.
In Europe, this process began in 1987 in the United Kingdom and Ireland, and strong growth allowed these carriers to capture quickly a large market share. According to Graham (2013), from 2001 to 2011, LCC substantially increased their aircraft seats from 8% to 24%. Reports show that in 2011, LCC held a 36% share of the air transport market in Europe, 30% in North America, and 19% in the Asia/Pacific region. In Portugal, LCC started in 1995 at the Faro and
Lisbon airports with Air Berlin and Ryanair, and, in 2011, LCC transported approximately 37% of the total number of air passengers in Portugal (INAC, 2012).
According to Warnock-Smith and Potter (2005), LCC choose airports primarily because of the size of the catchment area, the availability of slots, securing reduced turnaround times, low levels of congestion and reduced airport charges. Local and secondary airports are now preferred by LCC and, according to Graham (2013), many airports that serve these carriers have recorded notably high passenger growth rates. These airports have been rehabilitated to accommodate LCC to provide facilities with low airport charges and reduced response times. In OPO Airport, these carriers started to operate after the airport’s master plan for expansion was launched. This was a project of medium to long-term investment, aimed at increasing the airport’s annual capacity. From 2000 to 2007, the
8
first phase of the airport’s expansion took place, which increased its installed capacity from 3 million to 11 million passengers. The increase in LCC’s supply has resulted in major changes in air transport, incurring a change in demand behaviour and a positive effect on the development of other activity sectors, including the tourism sector.In this study we analyse the evolution of LCC air traffic at OPO Airport and we assess the economic impact of low cost flights on OPO airport’s area of influence. The methodology applied, cost-benefit analysis, could be used by all the airports and could help them to explain some of main impacts caused by these carriers. This article is structured into the following sections. After the introduction, Section Two emphasizes the relationship between LCC and economic development and focuses on the input and development of these companies’ operations at OPO Airport and, thereby, in the north of Portugal. Section Three details the methodology applied in the case study. We use a cost-benefit analysis model to determine the costs, benefits and net impact of low cost routes on the development of the local economy between 2005 and 2012. In 2005, these carriers started operating at OPO Airport. Section Four presents and discusses the results of a cost-benefit analysis of LCC operating at OPO Airport, and, finally, Section Five contains the general conclusions of this study. 2. Impact of LCC on Local Economies
Air transport plays a key role in economies, either as a direct employer or indirectly as a driver of economic growth. Over the past 100 years, this means of transport recorded a strong growth in demand. According to ATAG (2014) in the last 100 years the airlines carried some 65,3 billion passengers. Between 1970 and 2013, according to IATA (2012) and ICAO (2013), the total number of passengers carried by airlines worldwide increased 10 times, from 310 million to 3,1 billion. ICAO predicts that until 2030 this figure could reach 6,4 billion passengers. ICAO (2013) states that the year of 2013 was a year of records with almost 33 million airplanes crossing the international air space, 1 million more than 2012. Europe grew about 3,8% in total traffic with a 79,9% load factor, higher than the global international average (79,1%).
In Europe, the aviation industry is an important sector. The main figures show that in 2012, about 780,6 million passengers were transported by air, in some 9.401.000 flights, to 959 commercial airports, in 387 airlines (ATAG, 2014). According to ATAG (2014), in 2012 the air transport industry generated in total about 7 million jobs and contributed $581 billion to GDP in Europe (2,8% of economic-wide GDP). The direct employment of air transport in Europe is about 2,6 million jobs in 2012, 22% in jobs for airlines or handling agents (flight crew, check in staff, maintenance crew, reservations and head office staff); 6% of the total work for airport operators (airport management, maintenance, security and operations); 55% were on-site in airports, at retail outlets, restaurants, hotels, etc; 15% were employed in the manufacture of civil aircraft
(including systems, components, airframes and engines) and 2% in air navigation service providers.
Worldwide, including the tourism impacts, Europe accounts for 20% of the jobs and 35% of the GDP supported by the air transport industry. Air travel forecasts suggest that these benefits will grow significantly in the future (ATAG, 2014). Over the next 20 years, revenue passenger kilometres are expeted to grow at an average annual rate of 3,8% in Europe. This expansion in air travel is likely to generate significant economic impacts. Oxford economics (ATAG, 2014) forecasts that the number of jobs supported by aviation and tourism impacts will grow to 191 million by 2032, a 63% increase from 2012. The GDP is forecast to grow to 1,8 trillion by 2032, a 108% increase in 2012 figures. Air transport is of great importance in Europe – and globally – and is now a key sector in regional development. It provides more accessibility, which according to Reynolds-Feighan and McLay (2006) can be thought of as the capacity of a location to be reached from other locations, or to provide access to other locations, and it is inversely related to the generalised costs associated with this access. The introduction of new air links to a region extends the air transport network and improves the accessibility enjoyed by potential passengers located at both ends of the service, due to the speed and convenience of air travel relative to surface alternatives.
In recent years, the airline and tourism industries are undergoing profound changes, some of them due to technological advancements, the appearance of new business models, the emergence of the new consumer, globalization and new country relations, liberal policies and environmental concerns (Forsyth, 2006).
The increase in air transport demand is driven by economic growth, and more recently by LCC. The main differences between LCC and full service carriers (FSC) can be divided into three areas: economy of services, operating economy and economy of overheads (ICAO, 2003). LCC concentrate their expertise on short-distance routes, generally not more than 1,500 kilometres, maximise their passenger seats per aircraft and do not offer additional services, thus obtaining a competitive advantage.
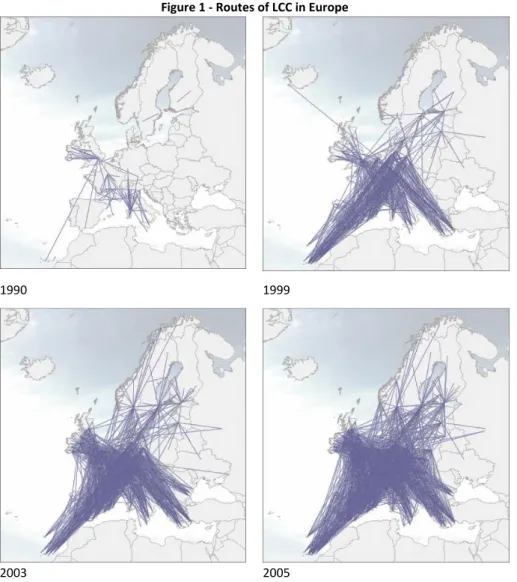
These carriers use secondary airports – benefiting from lower congestion and utilisation rates – and operate with a single-type fleet, allowing the crews to operate any aircraft in their fleets. To save on costs, LCC sell online directly to customers, avoiding intermediaries’ commissions. According to Gábor (2010), initially Europe’s low cost network had a north-south orientation, specifically from the United Kingdom, Germany and Scandinavia to the Mediterranean, Spain, Southern France and Italy (see Figure 1).
This orientation resulted from the fact that LCC initially focused on tourist transport, but the expansion of the European Union and the emergence of new regions generated a new dynamic network for LCC, especially from 2004 onwards. Despite the fact
9
that the basic characteristics of the LCC network have not changed, the transmission grid has become denser, with a greater number of destinations. Gábor (2010) identifies the first tourist network structure as dominated by flows between the north and south of Europe, and a second structure with a networkpattern between the west and east. Moreover, more recently, a third mixed network structure has emerged that combines routes between the north and south and the west and east, making the geographical distribution of LCC more dispersed.
Figure 1 - Routes of LCC in Europe
1990 1999
2003 2005
Source: Zwan (2005). In 2014, 44 European LCC offered flights in several countries
and destinations, with more than 3.000 destinations and routes and about 30.000 workers. Ryanair and EasyJet are the leaders among all LCC. ELFAA (2015) refers that Ryanair carried 86,4 million passengers and Easyjet some 65,3 million passengers in 2014, flying to 325 destinations (Ryanair to 189 and Easyjet to 136 destinations). These two companies offered 2.355 routes (Ryanair – 1600 and Easyjet 755 routes).
By the end of 2012, according to OAG Aviation (2012), the number of seats offered by LCC represented about 25% of the total seats available in the world market, which is twice their nearly 12% share in 2003. In Europe, this growth was more pronounced, recording an average annual growth of 4.2%, with a market share of 15% for LCC places in 2003 and 35% in 2012. With LCC, a new segment of demand emerged in the European market, which had not previously been served by FSC (ELFAA, 2004). Although 37% of passengers have changed their
preference of transport operator from FSC to LCC, 59% of LCC’s passengers are new customers, 71% of whom declare that, in other circumstances, they would never have chosen aircraft as a means of transport. Additionally, increased competition between traditional airlines has forced FSC to reduce their rates, allowing the number of passengers carried to increase also in this market segment.
Castillo-Manzano, López-Valpuesta and González-Laxe (2011) refer in their study some authors that analyse and justify the role of airports and air traffic in the economic activities of towns, cities and surrounding areas (Brueckner, 2003; Button, Lall, Stough & Trice, 1999; Debbage & Delk, 2001; Verde, 2007; Robertson, 1995). The authors also cited other studies that have also highlighted the importance of airports as an engine of regional economic and social development, boosting new public and private investment and increasing employment (Bel & Fageda, 2008; Brueckner, 2003; Button, Lall, Stough, & Trice, 1999;
10
Debbage, 1999, Debbage & Delk, 2001; Echavarne, 2008; Robertson, 1995), as well as the effects of LCC. Castillo-Manzano, López-Valpuesta and González-Laxe (2011) conclude that these carriers have had a positive impact, mainly in the tourism sector. ACI and York Aviation (2004) estimate that in Europe, on average 950 jobs are created per million passengers carried, either directly or indirectly, and 2,950 induced jobs are generated at the national level, 2,000 at the regional level and 1,425 at the local level. Airports have contributed enormously to the European economy since, according to the same study, the three levels together have a total impact that may represent about 1.4% to 2.5% of Europe’s GDP, excluding the impact of interest rates. Macário et al. (2007) analysed the effects of LCC on three airports and concluded that, in 2003, LCC operating at Carcossone Airport in France generated a new demand of about 230,000 passengers, a total increase in revenue of about €584 million (direct effect of €8.4 million, indirect effect of €253 million and induced income of €272.4 million). In Italy, in Pisa Airport, these carriers have created a new demand of 316,000 passengers with a total economic impact of €149.2 million on the regional economy.Huderek (2008) analysed the impact on three regional airports in Poland: Gdańsk, Wroclaw and Katowice. Gdańsk Airport registered a total traffic of 1.589 million passengers, of which 64.4% were transported by LCC. Passengers remained, on average, 4.6 days per stay and non-residents spent €82 per day, generating an indirect impact of €114 million on local income. At Wroclaw Airport, 1.137 million passengers were transported – 59.1% on LCC – who remained, on average, 3.7 days and spent €109 every day in the region, stimulating the economy with €95 million. Finally, according to Huderek (2008), Katowice Airport
transported 1.529 million passengers, with a majority share on LCC (81.9%). Passengers remained, on average, 2.6 days and spent daily about €140, adding €123 million in regional income. The expansion of the LCC network has been beneficial to various regions, insofar as LCC serve specific locations, unlike traditional companies, and have exploited regions that did not previously have intense regular traffic (Eurocontrol, 2007). According to Eurocontrol, FSC preferred hubs, concentrating air traffic in places with greater economic wealth, which would imply a strong association between the use of air transport and its efficiency. Therefore, new regions previously difficult to access are now being exploited, with better connectivity and with new marketing growth and opportunities. This has made it possible to improve integration and cohesion within the European Union, to reduce inequalities between European regions and to promote a better balance between them. Therefore, it can be stated that LCC have contributed strongly to the growth of various sectors of activity and to the economic and social development of regions influenced by airports. Bieger and Wittmer (2006) argue that the attractiveness of tourist destinations result, to a large extent, from the intrinsic nature of their natural resources, such as beauty and local culture, combined with existing support infrastructures within the regions around destinations. These authors present a model of a general system of interactions between air transport and tourism, created from core components. On the one hand, we have destinations that are combinations of environmental conditions, infrastructure attractions and business models and structure. On the other hand, we have air transport that is the combination of airports, airlines and business models (see Figure 2).
Figure 2 - System model of interactions between air transport and tourism
Source: Bieger and Wittmer (2006).
network/alliance environment technical environment economic environment of homemarket regulative environment social environment ecological environment political environment
11
According to the authors, the attractiveness of the destination subsystem stems, to a large extent, from the combination of local attractions, general atmosphere, location, quality of infrastructures, support services and social environment. It is essential to obtain a complete integration of local and natural resources in the entire destination subsystem in order to attract tourists and encourage local economic growth. According to the same authors, local resources and air transport infrastructure in the region influence tourist demand, and the lure of the destination is strongly influenced by the local airport, which in turn may generate multiple effects on air services.The airport infrastructure located in the northern region of Portugal is regarded as one of the best European airports and, according to MEID (2011), it has several features that enhance tourism, such as the existence of a strong corporate sector, a pleasant natural environment, abundant thermal spa resources and a great wealth of hydro-geological, cultural and religious heritage. This region has great potential for business, cultural, religious, natural, health and wellness and gastronomy and wine tourism. The combination of an interesting destination and resources in air transport has allowed tourism in the northern part of Portugal, and specifically the region surrounding OPO Airport, to boost the number of passengers transported on LCC. According to data from MEID (2013), from 2006 to 2011, overnight stays in this northern region increased by 21%, which is an increase from 200,000 to 500,000 in national and international overnight stays.
3. Methodology
Cost-benefit analysis (CBA) is a methodology used to evaluate investments from a socioeconomic point of view, thereby assessing the net economic impact of a project. This analysis evaluates the economic or social effects of a particular investment, allowing an assessment of the viability of public or private investment projects. This is done from the perspective of the social welfare of a country or region through the sum of the monetary values of the cost and benefit to society. A key factor in this methodology is that this evaluation is performed based on monetary values, allowing a measurement of the project’s effects on the economy (Moons, 2002). This methodology had its origins in the theoretical evaluation of infrastructure in France, in the 19th century, and is based on the economic theory of welfare
(Pearce, Atkinson & Mourato, 2006). According to these authors, Pareto (1848-1923) proposed a restricted condition in which social improvement exists only when there is a change in the existing situation, in which at least some people get better and nobody gets any worse. Over the years, new theories emerged, including that of Kaldor and Hicks, who established the principle of compensation based on the concept of hypothetical compensation, according to which the benefit should exceed the cost – a rule guiding decisions about and evaluations of projects. CBA is based on this Kaldor-Hicks principle, taking as a basic criterion the maximisation of benefit over cost and adopting a partial equilibrium approach, in which a project or policy should
generate a positive net welfare (Pearce, Atkinson & Mourato, 2006). The assessment of impact on a regional economy can be subdivided into three effects: direct, indirect and induced (Macário et al., 2007). Direct effects correspond to the increase in employment for activities that are directly related to air transport; indirect effects correspond to employment and economic activity generated in the region by the increased flow of people and, finally, induced effects correspond to the attraction of incoming investment and stimulation of tourism through the spending of income by direct and indirect employees. That is, induced effects include the impact of the multiplier effect of direct and indirect effects, and are induced by the latter (Macário et al. 2007). In order to quantify these three effects on the economy – as driven by LCC operating out of OPO Airport – we adopted this CBA methodology. This model was previously used by Donzelli (2010) with the aim of quantifying the welfare generated by an LCC in southern Italy. According to this author, the LCC segment supported local economic development mainly through the creation of jobs and tourism. Thus, for overall benefits, two perspectives are included: supply and demand. The first approach, through effects on offer by LCC, includes increased income earned by the total employment generated. Whereas the side effects on demand are taken as the increase of turnover in the tourism sector. To calculate the benefit of added employment, we quantified direct, indirect and induced employment generated by an increase in LCC traffic at OPO Airport, according to the following functions: 𝑁𝑇 = 𝑃𝐷𝐿𝐶𝐶× % 𝑁𝑇𝐿𝐶𝐶 (1) 𝐷 = 𝑁𝑇 × 𝑇𝐸𝐿𝐶𝐶 (2) 𝐼 = 𝛾𝐷 (3) 𝑁 = 𝛼(𝐷 + 𝛾𝐷) (4) 𝐸 = 𝐷 + 𝐼 + 𝑁 (5) 𝐸 = 𝐷 + 𝛾𝐷 + 𝛼(𝐷 + 𝛾 𝐷) (6) 𝐸 = (1 + 𝛾 + 𝛼 + 𝛼𝛾)𝐷 (7)
If we assume the term (1 + 𝛾 + 𝛼 + 𝛼𝛾) as:
𝐸 = 𝛽𝐷 (8)
𝑅 = 𝐸 × 𝒲 (9)
With 𝑁𝑇 denoting the new air traffic, 𝑃𝐷𝐿𝐶𝐶 is the passengers
landed by LCC, while %𝑁𝑇𝐿𝐶𝐶 is the percentage of new traffic
generated by LCC. 𝑇𝐸𝐿𝐶𝐶 represents the rate of employment by
LCC operators. 𝐷 is the direct effect on employment, 𝐼 the indirect effect, 𝑁 the induced effect and 𝐸 the total effect on employment. 𝛾 is the multiplier direct effect on employment, and 𝛼 the multiplier induced effect on employment. 𝑅 denotes the income earned by the employment generated. 𝛽 is the multiplier of the liberalisation of air transport, and 𝒲 is the average annual wage.
In turn, to determine the increase of turnover in the tourism sector, we evaluated the amount spent by LCC tourists who landed and stayed, according to the following functions:
12
𝑇 = 𝑃𝐷𝐿𝐶𝐶× %𝑇𝐿𝐶𝐶 (10)
𝑇𝑈𝑅 = 𝑔 × 𝑛 × 𝑇 (11)
𝐵 = 𝑅 + 𝑇𝑈𝑅 (12)
With 𝑇 representing the total of tourists landed by LCC, %𝑇𝐿𝐶𝐶
is the percentage of new traffic generated by LCC motivated by tourism. While 𝑔 is the average spending of tourists per stay, 𝑛 is the number of nights per stay. TUR denotes the effect on tourism, and 𝐵 represents the benefit generated by LCC on the regional economy.
Given that this model quantifies overall economic welfare, the negative externalities produced by air transport are also evaluated, specifically the negative effects of LCC operating at OPO Airport. We consider the following to be negative externalities (C): accidents, air pollution, climate change, noise, upstream and downstream effects, and effects on nature and landscape. Therefore, we applied the following function:
𝐶 = 𝑐(𝑃𝐷𝐿𝐶𝐶× 𝐾𝑚𝐿𝐶𝐶) (13)
where 𝑐 denotes the cost by passengers transported per kilometre and 𝐾𝑚𝐿𝐶𝐶 is the length of a trip on LCC.
Net impacts result from the difference between LCC’s benefit and cost at OPO Airport,
which reflect the social welfare generated by carriers, which in turn translates into the
economic impact on the region influenced by the airport. We considered the following:
𝐵𝐸 = 𝐵 − 𝐶 (14)
with 𝐵𝐸 representing the welfare generated by LCC.
4. Cost-benefit Analysis of LCC Operating at OPO Airport The existence of a good air transport network has special relevance in peripheral countries and in regions where the tourism sector has a strong economic influence (Bråthen, 2011). Portugal presents these two characteristics, insofar as it is located in a peripheral area in relation to European political and economic centres, and tourism is a major industry and strategy for Portugal’s growth. In 2011, this sector contributed €26.2 billion to the Portuguese GDP (15.2% of the GDP) and directly contributed 322,000 jobs (6.6% of total employment) (WTTC, 2012). In the same year, Portuguese air traffic recorded a growth of 236% as compared to 1993, corresponding to 27,578,334 passengers.
OPO Airport is the international airport serving the northern region of Portugal, located in the city of OPO. It handles about 22% of the total number of passengers transported in all Portuguese airports and is the second largest airport in total LCC volume (ANA, 2012a). Traffic volume doubled from 2003 to 2014 from 2.7 million to 6.9 million passengers, increasing this airport’s share of national traffic. In 2013, this airport recorded a total traffic of over six million passengers, of which about 3.6 million passengers travelled on LCC (ANA, 2012a). In 2013, the four LCC operating in this airport performed 21,944 movements – which corresponds to 37% of the airport’s total movement – and transported approximately 57% of regular passenger traffic. In 2012, the four LCC operating in this airport performed 21,944 movements – which corresponds to 37% of the airport’s total movement – and transported approximately 55.4% of regular passenger traffic.
Figure 3 - Traffic evolution at OPO Airport by type of operator from 2002 to 2014 (in thousands)
Source: Adapted from traffic reports from ANA (2003 to 2014). By analysing sources on FSC markets’ traffic, it can be concluded
that, in 2011, LCC passengers arrived mostly from Barcelona, Beauvais (Paris) and Madrid, on Ryanair routes (see Table 1).
Table 1 - Major LCC routes
2005 % 2011 % Palma – S.S. Joan (Air Berlin) 95% Beauvais – Tille, Paris (Ryanair) 100% Frankfurt (Ryanair) 100% Barcelona (Ryanair) 77% Source: INAC (2012).
According to an ATAG (2014) study, about 52% of international tourist’s travel used this means of transportation during the year of 2012. Air transport is, therefore, a vital and indispensable factor within the tourism sector. Almeida and Costa (2013) refer that the role of transportation, mainly the air transport in tourism operations is vital and it can be considered one of the main causes of tourism expansion. Kaul (1985) recognizes the role of the transportation network as an essential component of successful tourism development and states that transport plays an important role in the successful 0 2 000 4 000 6 000 8 000 2002 2003 2004 2005 2006 2007 2008 2009 2010 2011 2012 2013 2014
13
creation and development of new attractions as well as the healthy growth of existing ones. Wheatcroft (1994) argues that air transport and tourism are integral parts of the same travel and tourism industry which is now a major sector of the economies of many countries.OPO Airport is one of Portugal’s infrastructure features that has experienced an exponential growth of LCC, with a current market share of over 50%. In order to quantify the effects of these routes on the local economy, we assessed their net economic impact from the entry of these operators up until 2012 (i.e. from 2005 to 2012). Ryanair has the largest market share among LCC to operate at OPO Airport, having transported about 68% of the passengers who travelled with LCC in 2012,
which corresponds to 37.8% of the airport’s market share. We use Ryanair’s figures as a reference for LCC operators, assuming their weighted average distance for flights through OPO Airport is 1,030 km and the average load factor is 80% (INAC, 2012). In order to calculate the benefit to the local economy, only passengers who use LCC are considered. In this calculation, only the increase in income is taken into account, followed by the creation of employment and increase in revenue in the tourism sector. The number of passengers landing with LCC at OPO Airport grew approximately 922% from 2005 to 2012, surpassing 1.6 million in 2012 (see Table 2).
Table 2 - Cost-benefit analysis of LCC carriers at OPO Airport
Benefit Cost
2005 2012 ∆ % 2005 2012 ∆ %
Increase in
passengers 162,771 1,664,079 922% Accidents €71,388 €1,061,674 1387% Employment
created Air pollution €128,499 €1,911,012 1387%
Direct effect 15 185 1106% Climate change €6,325,002 €94,064,279 1387%
Indirect effect 7 81 1106% Noise €142,777 €2,123,347 1387%
Induced effect 108 1,300 1106% Upstream and
downstream €556,829 €8,281,054 1387% Total number of jobs created 130 1,567 1106% Nature and landscape €85,666 €1,274,008 1387% Increase in
income €1,417,295 €17,053,812 1103% Biodiversity losses €14,278 €212,335 1387%
New traffic 96,035 981,807 922% Tourists 69,169 707,146 922% Average expenditure per day €45.99 €84.20 93% Average overnight stay 8 7 -13% Increase in turnover of tourism €25,447,046 €416,800,296 1538%
Total benefit €26,864,341 €433,854,108 1515% Total cost €7,324,437 €108,927,709 1387%
Economic welfare generated by LCC €19,539,904 €324,926,399 1563%
Economic welfare generated in local economy by each passenger €120.05 €195.26 63% Source: Own calculations.
The impact on employment is divided into direct, indirect and induced effects. We use Ryanair’s employment rate of 0.09 employees per 1000 passengers, in 2005, and 0.11, in 2012, as the direct impact on employment generated by an increase in LCC traffic. As the indirect effect, we assume a multiplier effect of 0.40 and, as the induced effect, a multiplier effect of 7 (these multipliers were estimated in ACI and York Aviation (2004) for Valencia Airport, which is largely similar to OPO Airport in
characteristics, size and traffic). Increased income resulting from this employment is based on average Portuguese earnings (the authors used an average annual earnings of €10,910.40 for 2005 and €13,711.08 for 2012, according to data from GEP/MSSS (2011 and 2013)) applied to the jobs created by LCC service. In order to quantify the impact of LCC in the tourism sector, we considered only 59% of new traffic (ELFAA, 2004), of which 72.03% are passengers travelling for leisure (IPDT, 2012a). The
14
annual proportion of tourists was obtained from the average in the semi-annual data from Instituto de Planeamento e Desenvolvimento do Turismo (IPDT) for 2012 (IPDT 2012a, 2012b, 2012c and 2012d).Given the average number of nights per stay in the region of OPO and the north of Portugal and the average spending of tourists per stay (IPDT, 2009, 2010a, 2010b, 2010c, 2010d, 2011a, 2011b, 2011c, 2011d, 2012a, 2012b, 2012c and 2012d), we obtained the benefit generated within the tourism sector, which was about €416.8 million in 2012, a growth of 1538% as compared with 2005. The total revenue generated by LCC operators resulted from the sum of increased income, followed by employment created with increased tourist expenditure, which we consider equivalent to tourist spending. In 2005, this total revenue was about €26.8 million and, in 2012, it totalled €433.9 million, which corresponds to a growth of 1515%. Throughout our study, we have concluded that the negative effects of LCC flights at OPO Airport increased about 1387%: around €7.3 million in 2005 to €109 million in 2012.
The total net benefit of LCC operating at OPO Airport proved positive and increased throughout the period under review, with benefit in the local economy generated by these carriers. The net benefit generated by each passenger who landed with LCC was €120.05 in 2005 and €195.26 in 2012, reflecting a growth of 63%. Our results differ from Donzelli’s (2010), slightly exceeding the results of that study, which showed an average net impact of €88 generated by passengers carried by LCC in Italy.
5. Conclusion
Tourism is one of the largest industries in terms of employability and economic flows. This sector has evolved exponentially based on various economic factors, leading to an increase of specialised fields. This has caused an increase in the market competitiveness of air transport, in particular LCC that streamlined their accessibility to various populations through lower costs. This has increased free movement within the European community and created new tourist consumption habits.
In this study, we found that LCC operating at OPO Airport generate economic wellbeing in the northern region of Portugal. In 2005, the net economic impact generated was approximately €19.5 million, and, in 2012, this impact reached €325 million. For each passenger transported by LCC, the region received a profit of €120 in 2005 and €195 in 2012. These figures reflect high growth rates that resulted from a strong intake of LCC at OPO Airport, confirming the increased regional economic impact of air transport and showing a positive effect on economic growth. Finally, we conclude that regional growth, through the promotion of the tourism industry, benefits from the creation of new methods, points of tourist attraction and continuing growth in regional traffic.
The growth in OPO Airport’s traffic emerges as an element of attractiveness in the destination system in the northern region of Portugal and as a dynamic factor in regional development. The performance of LCC in this airport has heavily shaped the
region’s tourist profile, as well as the patterns of tourism in the region. Moreover, it has contributed to the internationalisation of OPO Airport and, consequently, to the growth of international tourism in the region.
Nevertheless, the methodology used in the study could be reinforced with other kind of data that could explain the main impacts of LCC in the tourism sector (accommodation, restaurants, other services).
6. Limitations of the study and future work
One of the main limitations of this study was the data available from the OPO airport or even from other entities that provide data concerning the air transport sector.
In a future investigation the authors want to compare other Portuguese airports using this same methodology as well and other international airports in other competitive destinations, mainly the ones located in the Mediterranean region where the low cost flights have also a great number of routes.
References
ACI and York Aviation (2004). The social and economic impact of airports in Europe. Airports Council International and York Aviation. Ginebra, Switzerland: Airports Council International World Headquarters.
Almeida, C. & Costa, C. (2013). Transporte aéreo, Aeroportortos e o desenvolvimento de destinos turísticos. O caso do Algarve. In Almeida, C., Almeida, C. R., Serra, F., Santos, J. e Águas, P. (Eds.). Turismos: Mobilidade e Territórios. TMS Conference Series. Escola Superior de Gestão, Hotelaria e Turismo da Universidade do Algarve, 145-157. ANA (2003). Relatório de Tráfego Dezembro de 2003 – Aeroporto do Porto. Lisboa: ANA Aeroportos de Portugal.
ANA (2004). Relatório de Tráfego Dezembro de 2004 – Aeroporto do Porto. Lisboa: ANA Aeroportos de Portugal.
ANA (2005). Relatório de Tráfego Dezembro de 2005 – Aeroporto do Porto. Lisboa: ANA Aeroportos de Portugal.
ANA (2006). Relatório de Tráfego Dezembro de 2006 – Aeroporto do Porto. Lisboa: ANA Aeroportos de Portugal.
ANA (2007). Relatório de Tráfego Dezembro de 2007 – Aeroporto do Porto. Lisboa: ANA Aeroportos de Portugal.
ANA (2008). Relatório de Tráfego Dezembro de 2008 – Aeroporto do Porto. Lisboa: ANA Aeroportos de Portugal.
ANA (2009). Relatório de Tráfego Dezembro de 2009 – Aeroporto do Porto. Lisboa: ANA Aeroportos de Portugal.
ANA (2010). Relatório de Tráfego Dezembro de 2010 – Aeroporto do Porto. Lisboa: ANA Aeroportos de Portugal.
ANA (2011). Relatório de Tráfego Dezembro de 2011 – Aeroporto do Porto. Lisboa: ANA Aeroportos de Portugal.
ANA (2012a). Relatório anual de estatística de tráfego 2011. Lisboa: ANA Aeroportos de Portugal.
ANA (2012b). Relatório de Tráfego Dezembro de 2012 – Aeroporto do Porto. Lisboa: ANA Aeroportos de Portugal.
ANA (2012c). Perfil dos turistas do Porto e Norte Portugal 2º trimestre de 2012. Porto: Instituto de Planeamento e Desenvolvimento do Turismo. ANA (2013). Relatório de Tráfego Dezembro de 2013 – Aeroporto do Porto. Lisboa: ANA Aeroportos de Portugal.
ANA (2014). Relatório de tráfego Dezembro 2013. Lisboa: ANA Aeroportos de Portugal.
ATAG (2014). Aviation benefits beyond borders. April 2014, Retrieved,
March, 8, 2015 from
http://aviationbenefits.org/media/26786/ATAG__AviationBenefits201 4_FULL_LowRes.pdf.
15
Bieger, T. & Wittmer., A. (2006). Air transport and tourism: Perspectives and challenges for destinations, airlines and governments. Journal of Air Transport Management, 12, 40-46.
Bråthen, S. (2011). Air Transport Services in Remote Regions. Discussion paper 2011-13, International Transport Forum.
Castillo-Manzano, J., López-Valpuesta, L. & Gonzálvez-Laxe, F. (2011). The effects of the LCC boom on the urban tourism fabric: The viewpoint of tourism managers. Tourism Management, 32, 1085–1095. Delft, C., Infras, F.I. (2011). External Costs of Transport in Europe, Update Study. Retrieved May, 8, 2013 from http://www.cedelft.eu/publicatie/external_costs_of_transport_in_eur ope/1258.
Donzelli, M. (2010). The effect of low-cost air transportation on the local economy: Evidence from Southern Italy. Journal of Air Transport Management, 16, 121-126.
ELFAA (2004). Liberalisation of European Air Transport: The Benefits of Low Fares Airlines to Consumers, Airports, Regions and the Environment. European Low Fares Airlines Association, Brussels. ELFAA (2015). Member’s statistics – December 2014. Retrieved March,
9, 2015 from
http://www.elfaa.com/ELFAA_Statistics_December_2014.pdf. Eurocontrol (2007). A Place to Stand: Airports in European Air Network. Trends in Air Traffic, 3.
Forsyth, P. (2006). Martin Kunz Memorial Lecture, Tourism benefits and aviation policy. Journal of Air Transport Management, 11, 3–13. Gábor, D. (2010). Low-cost Airlines in Europe: Network Structures After the Enlargement of the European Union. Geographica Pannonica, 14 (2), 49-58.
GEP/MSSS (2011). Séries Cronológicas Quadros de Pessoal 1999-2009. Lisboa: Gabinete de Estratégia e Planeamento do Ministério da Solidariedade e da Segurança Social. Retrieved, April, 2, 2013 from http://www.gep.msss.gov.pt/estatistica/gerais/serieqp_1999_2009.pdf. GEP/MSSS, 2013. Boletim Estatístico. Lisboa: Gabinete de Estratégia e Planeamento do Ministério da Solidariedade e da Segurança Social.
Retrieved, April, 2, 2013 from
http://www.gep.msss.gov.pt/estatistica/be/bedez2012.pdf.
Graham, A. (2013). Understanding the low cost carrier and airport relationship: A critical analysis of the salient issues. Tourism Management, 36, 66-76.
Huderek, S. (2008). Socio-economic impact of Low-cost carriers on the Central-eastern European market: Exemplification of Poland. Poznan University, Poland.
IATA (2012). Annual Review 2012. International Air Transport Association Economics. Retrieved, April, 1, 2013 from http://www.iata.org/about/Documents/annual-review-2012.pdf. ICAO (2003). The impact of LCC in Europe, International Civil Aviation Organisation. Retrieved, April, 1, 2013 from http://www.icao.int/sustainability/CaseStudies/StatesReplies/Europe_ LowCost_En.pdf.
ICAO (2013). 2013 Safety Report. International Civil Aviation Organisation. Retrieved, April, 2, 2013 from
http://www.icao.int/safety/Documents/ICAO_2013-Safety-Report_FINAL.pdf.
INAC (2012). O Impacto das Transportadoras de Baixo Custo no transporte Aéreo Nacional [1995-2011]. Lisboa: Instituto Nacional de Aviação Civil. IPDT (2009). Perfil dos turistas de Lazer do Porto e Norte Portugal. Porto: Instituto de Planeamento e Desenvolvimento do Turismo.
IPDT (2010a). Perfil dos turistas do Porto e Norte Portugal 1º trimestre de 2010. Porto: Instituto de Planeamento e Desenvolvimento do Turismo. IPDT (2010b). Perfil dos turistas do Porto e Norte Portugal 2º trimestre de 2010. Porto: Instituto de Planeamento e Desenvolvimento do Turismo. IPDT (2010c). Perfil dos turistas do Porto e Norte Portugal 3º trimestre de 2010. Porto: Instituto de Planeamento e Desenvolvimento do Turismo. IPDT (2010d). Perfil dos turistas do Porto e Norte Portugal 4º trimestre de 2010. Porto: Instituto de Planeamento e Desenvolvimento do Turismo.
IPDT (2011a). Perfil dos turistas do Porto e Norte Portugal 1º trimestre de 2011. Porto: Instituto de Planeamento e Desenvolvimento do Turismo. IPDT (2011b). Perfil dos turistas do Porto e Norte Portugal 2º trimestre de 2011. Porto: Instituto de Planeamento e Desenvolvimento do Turismo. IPDT (2011c). Perfil dos turistas do Porto e Norte Portugal 3º trimestre de 2011. Porto: Instituto de Planeamento e Desenvolvimento do Turismo. IPDT (2011d). Perfil dos turistas do Porto e Norte Portugal 4º trimestre de 2011. Porto: Instituto de Planeamento e Desenvolvimento do Turismo. IPDT (2012a). Perfil dos turistas do Porto e Norte Portugal 1º trimestre de 2012. Porto: Instituto de Planeamento e Desenvolvimento do Turismo. IPDT (2012b). Perfil dos turistas do Porto e Norte Portugal 2º trimestre de 2012. Porto: Instituto de Planeamento e Desenvolvimento do Turismo. IPDT (2012c). Perfil dos turistas do Porto e Norte Portugal 3º trimestre de 2012. Porto: Instituto de Planeamento e Desenvolvimento do Turismo. IPDT (2012d). Perfil dos turistas do Porto e Norte Portugal 4º trimestre de 2012. Porto: Instituto de Planeamento e Desenvolvimento do Turismo. Kaul, R. (1985). Dynamics of tourism: A trilogy, 111. New Delhi: Transportation and Marketing.
Macário, R., Reis, V., Viegas, J., Meerman, H., Monteiro, F., Van de Voorde, E. Vanelslander, T., Mackenzie-Williams, P. & Schimidt, H. (2007). The consequences of the growing European low-cost airline sector. CESUR.
MEID (2011). Plano Estratégico Nacional do Turismo. Propostas para Revisão no Horizonte 2015 - Versão 2.0. Lisboa, Portugal: Ministério da Economia, Inovação e Desenvolvimento. Turismo de Portugal. MEID (2013). Plano Estratégico Nacional do Turismo: Horizonte 2013-2015- Relatórios & Documentos estratégicos. Lisboa, Portugal: Ministério da Economia, Inovação e Desenvolvimento. Turismo de Portugal. Moons, E. (2002). Cost-benefit analysis of Location of New Forest Land. Working Paper No. 2002-05 Centre for Economic Studies, Katholike University, Leuven.
OAG Aviation (2012). October Executive Summary. Retrieved, April, 1, 2013 from http://www.oagaviation.com/OAG-FACTS/2012/October-Executive-Summary.
Pearce, D., Atkinson, G. & Mourato, S. (2006). Cost-Benefit Analysis and the Environment: Recent Developments: The Stages of a Practical Cost-benefit Analysis. OECD Publishing.
Reynolds-Feighan, A. & McLay, P. (2006). Accessibility and attractiveness of European airports: A simple small community perspective, Journal of Air Transport Management, 12, 313–323. Warnock-Smith, D., A. & Potter, A. (2005). An exploratory study into airport choice factors for European low-cost airlines. Journal of Air Transport Management, 11(6), 388–392.
Wheatcroft, S. (1994). Aviation and Tourism Policies, London: Routledge/World Tourism Organization.
WTTC (2012). Travel & Tourism Economic Impact 2012 Portugal, World Travel & Tourism Council.
Zwan, J. (2005). Low-Cost Carriers – Europa. PhD thesis, University of Utrecht, Utrecht, Holland.
Received: 28. 11. 2017 Revisions required: 15.02.2018 Accepted: 25.03.2018