UNIVERSIDADE DO ALGARVE
FACULDADE DE CIÊNCIAS E TECNOLOGIA
MULTIBIOMARKER ASSESSMENT OF
CADMIUM-BASED QUANTUM DOTS
EFFECTS IN THE MARINE MUSSEL
MYTILUS GALLOPROVINCIALIS
Thiago Lopes Rocha
Dissertação apresentada na Universidade do Algarve Doutoramento em Ciências do Mar, Terra e Ambiente
Ramo de Ciências e Tecnologias do Ambiente Especialidade Ecotoxicologia
Trabalho efetuado sobre a orientação da
Professora Doutora Maria João da Anunciação Franco Bebianno
Multibiomarker assessment of cadmium-based quantum dots effects in the marine mussel Mytilus galloprovincialis
Declaração de autoria de trabalho
Declaro ser o autor deste trabalho, que é original e inédito. Autores e trabalhos consultados estão devidamente citados no texto e constam da listagem de referências incluída.
---
©Thiago Lopes Rocha
A Universidade do Algarve tem o direito perpétuo e sem limites geográficos, de arquivar e publicitar este trabalho através de exemplares impressos reproduzidos em papel ou de forma digital, ou por qualquer outro meio conhecido ou que venha a ser inventado, de o divulgar através de repositórios científicos e de admitir a sua cópia e distribuição com objetivos educacionais ou de investigação, não comerciais, desde que seja dado crédito ao autor e editor.
This thesis was supported by
National Council for Scientific and Technological Development (CNPq) through the Brazil's Science Without Borders Program (239524/2012-8)
Foundation of Science and Technology (FCT) through the project NANOECOTOX (PTDC/AAC-AMB/121650/2010) and project NANO NF (PTDC/ECM/102244/200)
I
ACKNOWLEDGEMENTS
I wish to thank all the people and institutions that helped me to carry out this Ph.D. Without their support none of this would have been possible.
Professor Maria João Bebianno (Centre for Marine and Environmental Research – CIMA, Faculty of Science and Technology – FCT, University of Algarve - UAlg), supervisor of my Ph.D. thesis, for giving me the opportunity to perform this research work within the “Ecotoxicology and Environmental Chemistry” research group, and for all her support, scientific advice, cordiality and encouragement during these three years. Professor Margarida Ribau and Vânia Sousa (Center for Environmental and Sustainability Research - CENSE, FCT, CIMA, UAlg) for giving me the opportunity and assistance to perform the nanoparticle characterization.
Professor José Paulo Pinheiro (Observatoire Terre et Environnement de Lorraine - OTELo, University of Lorraine) and Luciana Sarabando Rocha (FCT, UAlg) for helping to understand the electrochemical methods and its importance in a nanoecotoxicology context.
Professor Luís Miguel Nunes (Civil Engineering Research and Innovation for Sustainability – CERIS, Instituto Superior Técnico - IST, UAlg) for his support with the statistical analyses and assessment of kinetics models.
Professor Simone Maria Teixeira Sabóia-Morais (Laboratory of Cellular Behavior, Federal University of Goiás - UFG) for giving me the opportunity and assistance to perform the histopathological analysis.
Paulo Zaragoza Pedro (CIMA, UAlg) for this support with the chemical analysis. A special thanks to all the technical and scientific support of UAlg, especially Filomena, João Quintela, Miguel and Zélia, for the daily support.
My friend Tânia Gomes for all the precious support, friendship and encouragement during these years. I would like to thank especially her scientific support in the experimental design and analysis of written articles.
All my friends from the Ecotoxicology and Environmental Chemistry Group (Ambra, Bruna, Cátia, Chiara, Emerson, Francisca, Julie, Luís, Manon, Matilde, Mustafa, Nélia, Tainá) for all assistance, friendship, endearment and laughter during these years.
All my friends from the UAlg, especially Amanda, Catarina, Cris, Flá, Lica, Luciana and Natalyia for all precious moments shared together. A special thanks for all my friends from the “Zumba family” for the affection, healthy and happy times spent together.
My best friend and companion of every day (“neggão”) and my family, especially my parents (João e Rosimeire), brothers (Amanda, Raquel, Renata, Rodrigo, Roger and Taynara), to whom I dedicate this thesis.
II
GENERAL ABSTRACT
Nanotechnology and use of engineered nanomaterials (ENMs) may improve life quality, economic growth and environmental quality, but their environmental risk in the marine environment is scarce. Properties of quantum dots (QDs), namely small size, unique optical and biofunctional properties, allow their use in nanomedicine, biology and electronics, but also confer different toxicity compared to its dissolved counterparts. Accordingly, this thesis assessed the toxicokinetics (TK), mode of action (MoA) and toxicity of CdTe QDs (10 µg Cd L-1) in the marine mussel Mytilus galloprovincialis, compared to dissolved Cd for 21 days followed by 50 days depuration. For this purpose, Cd distribution in different mussel tissues, subcellular fractions and biodeposits were analysed, TK parameters estimated (accumulation and elimination rates, bioconcentration factor and half-life time) and multibiomarkers assessed: immunotoxicity (density, viability and differential cell count of hemocytes), cytotoxicity (lysosomal membrane stability - LMS), genotoxicity (DNA damage and nuclear anomalies), oxidative stress (superoxide dismutase - SOD, catalase - CAT, glutathione peroxidase - GPx and glutatione-S-Transferase - GST), metal exposure (metallothionein - MT), oxidative damage (lipid peroxidation - LPO), tissue-level biomarkers (17 histomorphometric parameters of digestive tubules, inflammatory and histopathological conditions indices) and proteomic responses. Results showed that the digestive gland plays an important role in storage, metabolism and detoxification of QDs, while gills have similar functions for dissolved Cd and the hemolymph in transport, distribution and regulation of QDs. Tissue specific metabolism patterns and nano-specific effects were identified, wherein the MoA and toxicity of QDs in mussels is time dependent and involve oxidative stress, immune response, DNA damage and differential protein expression. Mussels were unable to completely eliminate the QDs (t1/2 > 50 days), highlighting their potential source of toxicity for human health and environment. M. galloprovincialis is a significant target of QDs ecotoxicity and represent a suitable biomonitor for assess their environment risk.
Keywords: Nanoecotoxicity, nanomaterials, CdTe quantum dots, cadmium, biomarkers, oxidative stress, bivalve, Mytilus galloprovincialis.
III
RESUMO GERAL
A nanotecnologia e o uso de nanomateriais manufaturados (NMs) podem melhorar a qualidade de vida, o crescimento económico e a qualidade ambiental. Contudo, o rápido desenvolvimento e uso dos NMs em vários produtos levantam preocupações sobre a sua libertação no ambiente, em especial em águas residuais e no ambiente marinho, ao mesmo tempo em que o conhecimento sobre seu risco ambiental permanece escasso. Dentre os NMs, os pontos quânticos (“quantum dots” - QDs) são nanocristais semicondutores com ampla aplicação na nanomedicina, biologia e eletrónica devido às suas propriedades físico-químicas, tais como tamanho (1 - 10 nm), propriedades ópticas e eletrónicas e capacidade de bioconjugação. Entretanto, as propriedades nano-específicas dos QDs podem também induzir toxicidade diferente da comparada com a sua contraparte dissolvida. Por conseguinte, esta dissertação avaliou a toxicocinética (TK), o modo de ação (MoA) e a toxicidade dos CdTe QDs no mexilhão marinho Mytilus galloprovincialis, em comparação com o Cd dissolvido.
Inicialmente, as características dos QDs, seu comportamento e destino na água do mar foram analisados em termos de forma, tamanho, diâmetro hidrodinâmico, carga superficial (potencial zeta), índice de poli-dispersão, ponto isoelétrico, cinética de agregação/aglomeração, estabilização com diferentes tipos matéria orgânica natural (NOM), taxa de sedimentação e taxa de dissolução. Para análise da toxicocinética dos QDs em comparação com sua parte dissolvida, os mexilhões M. galloprovincialis foram expostos (a uma mesma concentração ambientalmente relevante de Cd, 10 µg Cd L-1) a QDs e a Cd dissolvido durante 21 dias, seguido de um período de depuração de 50 dias, juntamente com um grupo controlo. A cinética de acumulação e eliminação do Cd foi analisada em diferentes tecidos (brânquias, glândula digestiva, hemolinfa e resto), frações subcelulares (fração insolúvel, fração das proteínas de elevado peso molecular e fração das proteínas de baixo peso molecular) e biodepósitos dos mexilhões (fezes e pseudofezes) por espectrometria de absorção atómica com forno de grafite, seguido da estimativa dos parâmetros toxicocinéticos (taxas de acumulação e eliminação, fator de bioconcentração e tempo de meia-vida - t1/2). Para o estudo comparativo do MoA e
toxicidade dos QDs e sua contraparte dissolvida, os mexilhões foram expostos a QDs e a Cd dissolvido (10 µg Cd L-1) durante 14 dias e uma bateria de biomarcadores foi analisada: imunotoxicidade (densidade, viabilidade e contagem diferencial de hemócitos), citotoxicidade (estabilidade da membrana lisossomal - LMS),
IV
genotoxicidade (danos no ADN e anomalias nucleares), estresse oxidativo (superóxido dismutase - SOD, catalase - CAT, glutationa peroxidase - GPx e glutationa-S-transferase - GST), exposição a Cd (metalotioneína - MT), dano oxidativo (peroxidação lipídica - LPO) e biomarcadores a nível tecidual (17 parâmetros histomorfométricos dos túbulos digestivos, condição inflamatória e os índices de condição histopatológica). Além disso, um estudo exploratório para identificar possíveis novos biomarcadores foi realizado na glândula digestiva dos mexilhões expostos a ambas formas de Cd (QDs e Cd dissolvido) (10 µgCd L-1) durante 14 dias através de análise proteómica.
Os CdTe QDs usados neste estudo foram nanopartículas esferóides cobertas com grupos carboxílicos (-COOH) e com tamanho primário de 6 ± 1 nm. Em água do mar, os QDs tendem a formar agregados/aglomerados com diâmetro hidrodinâmico de 1014 ± 187 nm e carga superficial negativa (potencial zeta = -9.4 ± 1.2 mV), reduzindo a sua área superficial total em contato com o meio circundante. A taxa de dissolução dos QDs na água do mar foi de 27.6 % e a sua taxa de sedimentação rápida e lenta foi de 0.88 ± 5 x 10⁻⁴ e 0.009 ± 8.45 x 10⁻⁴, respectivamente, confirmando a sua tendência de agregar/aglomerar e sedimentar nos tanques de exposição, enquanto a estabilização com diferentes tipos de NOM (ácidos húmicos, ácido tânico, ácido salicílico) não foi observada. Uma visão geral dos resultados indica que a especiação do Cd na água do mar durante a exposição dos mexilhões aos CdTe QDs corresponde a 72 % são pequenos e grandes homo-agregados de QDs, 27.6 % são Cd iónico livre (Cd2+) e complexos orgânicos e/ou inorgânicos de Cd devido à libertação de Cd dissolvido dos QDs.
Ambas as formas de Cd estão disponíveis para o mexilhão M. galloprovincialis e são acumuladas dependendo dos tecidos e tempo de exposição. Detectaram-se uma distribuição tecidual semelhante nos mexilhões expostos aos QDs e ao Cd dissolvido (glândula digestiva > brânquias > resto > hemolinfa), mas a cinética de acumulação foi dependente da forma de Cd. Nos mexilhões expostos aos QDs, foi detectada uma acumulação de Cd nas frações contendo mitocôndrias, núcleo e lisossomas, indicando potenciais alvos sub-celulares para a toxicidade dos QDs. Embora os níveis de MTs estejam diretamente associados com ambas as formas de Cd, a distribuição subcelular dos QDs está relacionada ao metal na sua forma biologicamente ativa (BAM), mas sem indução de LPO, enquanto que o Cd dissolvido foi detectado na forma biologicamente detoxificado (BDM), indicando efeitos nano específicos. Os resultados mostraram ainda que a glândula digestiva desempenha um papel fundamental no armazenamento,
V
metabolismo e desintoxicação dos QDs, enquanto as brânquias têm funções semelhantes nos mexilhões expostos ao Cd dissolvido e a hemolinfa atua no transporte, distribuição e regulação dos QDs. Padrões específicos de metabolismo foram observados para ambas as formas de Cd de acordo com os tecidos analisados.
O MoA e a toxicidade dos QDs nos mexilhões são dependentes do tecido e do tempo de exposição e envolvem mudanças na atividade das enzimas antioxidantes, estress oxidativo, resposta imune e danos no ADN. As brânquias são o principal órgão afetado pelo estress oxidativo induzido pelos QDs com efeitos associados ao aumento da atividade da SOD, GST e GPx, enquanto que os efeitos do Cd dissolvido estão relacionados com o aumento da atividade da CAT. Os efeitos dos QDs nos mexilhões classificam-se como imunocitotóxicos e genotóxico, mas não citogenotóxicos. A imunotoxicidade dos QDs nos mexilhões é mediada pela redução da LMS, mudanças na frequência dos tipos de hemócitos e danos no ADN, enquanto os efeitos na densidade e viabilidade dos hemócitos e alterações cromossómicas não foram observados, em oposição aos efeitos observados para o Cd dissolvido.
Os resultados da análise proteómica indicam que os QDs e o Cd dissolvido induzem mudanças na expressão de proteínas na glândula digestiva dos mexilhões de modo dependente da forma de Cd. Foram observadas diferenças significativas (≥ 2 vezes) em 304 proteínas entre os mexilhões expostos a ambas as formas de Cd e aos não expostos, em que 32 e 123 proteínas são específicas para os QDs e o Cd dissolvido, respectivamente, enquanto alterações em 28 proteínas foram observadas somente após a exposição a ambas as formas de Cd. Esses resultados indicam que o MoA e a toxicidade dos QDs não são devidos somente à dissolução dos QDs e libertação de Cd dissolvido (Cd2+), mas também estão relacionados com as suas propriedades nano específicas. Durante o período de depuração, as brânquias dos mexilhões possuem baixa capacidade de eliminação dos QDs, enquanto a glândula digestiva é o principal órgão de acumulação, metabolismo e eliminação de ambas as formas de Cd. Os mexilhões não foram capazes de eliminar completamente os QDs acumulados (t1/2 > 50 dias),
destacando a sua fonte potencial de toxicidade para a saúde humana e ambiental. Além disso, o mexilhão marinho M. galloprovincialis é alvo significativo da ecotoxicidade dos QDs e representa um biomonitor adequado para avaliar o seu risco ambiental. Palavras-chave: Nanoecotoxicologia, nanomateriais, CdTe quantum dots, cádmio, biomarcadores, estresse oxidativo, bivalve, Mytilus galloprovincialis.
i
INDEX
Acknowledgements...………...…... I General abstract...………....…….... II Resumo geral...………... III
Index.….………....……... i
Figure index....………... viii
Table index.……...………..…... xvi
Abbreviations...………...………...…...….. xix
Chapter 1. General introduction.…...………...….….…... 1
1.1. Nanotechnology and nanomaterial...…...….……... 3
1.2. ENMs properties and characterization…………...….……... 4
1.3. Behaviour and fate of ENMs in the aquatic environment... 7
1.4. Bivalve molluscs as a target group of ENMs toxicity... 9
1.4.1. Types of ENMs…………...….……... 10
1.4.2. ENMs ecotoxicity studies with bivalve molluscs... 19
1.4.3. Bivalve species... 19
1.4.4. Experimental design of nanotoxicological studies... 20
1.4.5. Bioaccumulation and tissue distribution... 20
1.4.6. Subcellular localization………...….……... 23
1.4.7. Mode of action (MoA)...….……... 25
1.4.7.1. Oxidative stress………...….……... 25
1.4.7.2. Immunotoxicity………...….……... 27
1.4.7.3. Genotoxicity………...…....……... 28
1.4.7.4. Behavioural changes and neurotoxicity... 29
1.4.7.5. Embryotoxicity………...….……... 30
1.4.8. Interactive effect of ENMs and other stressors... 31
1.5. Proteomic research and identification of new biomarkers... 35
1.6. Ecotoxicity of quantum dots at various trophic levels... 37
1.6.1. Quantum dots....….……... 37
1.6.2. QDs applications and properties....….……... 38
1.6.2.1. Morphology and composition....….……... 39
ii
1.6.3.1. Physicochemical transformations....….……... 42
1.6.3.2. Macromolecular interactions....…....……... 43
1.6.3.3. Biological mediated reactions....…....……... 43
1.6.4. Ecotoxic effects of QDs at various trophic levels...….…... 44
1.6.4.1. Micro-organisms....….……... 44 1.6.4.1.1. Bacteria....….……... 44 1.6.4.1.2. Algae....….……... 46 1.6.4.1.3. Protozoa....….……... 50 1.6.4.1.4. Fungi....….……... 51 1.6.4.2. Invertebrates....….……... 55
1.6.4.2.1. Annelida and platyhelminths....….……... 55
1.6.4.2.2. Nematoda....….……... 55
1.6.4.2.3. Bivalvia....….……... 56
1.6.4.3. Aquatic vertebrates....….……... 57
1.6.4.3.1. Fish....….……... 57
1.6.5. Trophic transfer and biomagnification... 66
1.7. Objectives and outline... 68
1.7.1. General structure of thesis... 71
Chapter 2. Toxicokinetics and tissue distribution of cadmium-based quantum dots in the marine mussel Mytilus galloprovincialis...……...……..…... 75
Graphical abstract 1………...….………... 75
Abstract.………...….………... 77
2.1. Introduction.………...….………... 78
2.2. Materials and methods.………...….………... 49
2.2.1. QDs characterization.………...….………... 49
2.2.2. Aggregation of QDs with NOM.………...….………... 49
2.2.3. Cd speciation.………...….………... 80
2.2.4. Experimental design.………...….……...………... 80
2.2.5. Cd concentrations in seawater and mussel tissues... 81
2.2.6.Condition index.………...….………... 81
2.2.7. Kinetic models.………...……...….………... 81
iii
2.2.9. Statistical analysis.………...……...….………... 82
2.3. Results.………...….………...……... 82
2.3.1. QDs characterization.…………... 82
2.3.2. Aggregation of QDs with NOM.………....……... 83
2.3.3. QDs dissolution and Cd speciation.………...……... 83
2.3.4. Condition Index (CI).…...…... 84
2.3.5. Cd accumulation.………... 85
2.3.6. Cd elimination.………... 88
2.3.7. Production and Cd concentration of biodeposits... 88
2.4. Discussion.………...….………... 89
2.5. Conclusions………...……….. 94
Chapter 3. Subcellular partitioning kinetics, metallothionein response and oxidative damage in the marine mussel Mytilus galloprovincialis exposed to cadmium-based quantum dots... 95
Graphical abstract 2....………..……..… 95
Abstract………..………...…… 97
3.1. Introduction………...…. 98
3.2. Materials and methods………... 100
3.2.1. Experimental design………....……….…. 100
3.2.2. Subcellular partitioning………....………. 100
3.2.3. Cd concentration………....……… 101
3.2.4. Subcellular kinetic models………....………. 102
3.2.5. Net accumulation rates………....………….. 103
3.2.6. Metallothioneins………....….…… 103
3.2.7. Lipid peroxidation………...….…. 103
3.2.8. Total protein concentration………...…… 104
3.2.9. Statistical analysis………...….. 104
3.3. Results and discussion………...… 104
3.3.1. Cd accumulation………..………....………..… 104
3.3.2. Subcellular partitioning strategy………..……….… 105
3.3.2.1. Gills response………...………... 106
iv
3.3.3. Net accumulation rates………...…………. 111
3.3.4. Cd elimination………....………… 111
3.3.5. MTs response………...……….. 114
3.3.6. Oxidative damage………....…….. 118
3.3.7. Tissue specific metabolism patterns………..……...…… 120
3.4. Conclusions………... 121
Chapter 4. Immunocytotoxicity, cytogenotoxicity and genotoxicity of cadmium-based quantum dots in the marine mussel Mytilus galloprovincialis…..……....….... 125
Graphical abstract 3…………...………..………… 125
Abstract.………...………..……. 127
4.1. Introduction.………...………..…… 128
4.2. Materials and methods.………...………..…….. 130
4.2.1. QDs characterization.………...……….………..……….. 130
4.2.1.1. Stock solution.………...………... 130
4.2.1.2. Morphology, size, surface charge and aggregation kinetics... 130
4.2.1.3. Sedimentation rate (SR).………..……….… 130
4.2.1.4. Spectral properties.………..……….… 131
4.2.2. Exposure experiments.………..……….... 131
4.2.3. Cd concentration.………...……… 131
4.2.4. Immunocytotoxicity assessments.………..………... 132
4.2.4.1. Cell viability and hemocyte density.…………..………... 132
4.2.4.2. Lysosomal Membrane Stability.………..………. 132
4.2.4.3. Differential Cell Count, Micronucleus test and Nuclear Abnormalities assay.………... 132 4.2.4.4. Comet assay.………...….. 133 4.2.5. Statistical analysis.………... 134 4.3. Results.………....……..……….…… 134 4.3.1. QDs characterization.………...………... 134 4.3.2. Cd concentration.………...………...………. 137 4.3.3. Immunocytotoxicity.………....……….. 138
4.3.3.1. Hemocyte viability and density.…...……….………… 138
v
4.3.3.3. DCC.………...………. 139
4.3.4. Cytogenotoxicity.………....………... 140
4.3.4.1. Micronucleus Assay and Nuclear Abnormalities... 140
4.3.5. Genotoxicity.………....……….. 142
4.3.5.2. Comet assay.………....………. 142
4.4. Discussion.………..………..………....………... 145
4.5. Conclusions………..……….. 149
Chapter 5. Tissue specific toxicity of cadmium-based quantum dots in the marine mussel Mytilus galloprovincialis... 151
Graphical abstract 4... 151
Abstract... 153
5.1. Introduction... 154
5.2. Materials and methods... 156
5.2.1. QDs characterization... 156
5.2.2. Experimental design... 156
5.2.3. Cd concentration... 157
5.2.4. Antioxidant enzymes... 157
5.2.5. Total protein concentration... 158
5.2.6. Statistical analysis... 158
5.3. Results and discussion... 159
5.3.1. Characterization and behaviour of QDs in seawater... 159
5.3.2. Cd accumulation... 159
5.3.3. Antioxidant responses... 160
5.3.4. Tissue specific antioxidant patterns... 165
5.4. Conclusions... 168
Chapter 6. Histopathological assessment and inflammatory response in the digestive gland of marine mussel Mytilus galloprovincialis exposed to cadmium-based quantum dots... 171
Graphical abstract 5... 171
Abstract... 173
vi
6.2. Materials and methods... 176
6.2.1. Experimental design... 176
6.2.2. Cd concentrations... 177
6.2.3. Histopathological assessment... 177
6.2.3.1. Histomorphometry... 178
6.2.4. Inflammatory response... 178
6.2.5. Histopathological condition indices... 178
6.2.6. Statistical analysis... 179
6.3. Results and discussion... 180
6.3.1. Characterization of QDs in seawater and bioaccumulation... 180
6.3.2. Histomorphometry... 181
6.3.2.1. Morphological phases of digestive tubules... 181
6.3.2.2. Digestive tubule status... 183
6.3.2.3. Cell-type replacement... 184
6.3.3. Inflammatory response... 187
6.3.4. Histopathological condition indices... 189
6.3.5. Principal component analysis... 190
6.4. Conclusions... 193
Chapter 7. Differential proteomic response to cadmium-based quantum dots in the marine mussel Mytilus galloprovincialis... 194
Graphical abstract 6... 194
Abstract... 196
7.1. Introduction... 197
7.2. Materials and methods... 199
7.2.1. QDs characterization... 199
7.2.2. Experimental design... 199
7.2.3. Cd accumulation... 200
7.2.4. Protein extraction and two-dimensional electrophoresis (2-DE)... 200
7.2.5. Image analysis... 201
7.3. Results and discussion... 201
7.3.1. QDs behaviour in seawater and bioaccumulation... 201
vii
7.4. Conclusions... 208
Chapter 8. General discussion, conclusions and future perspectives... 217
8.1. General discussion... 218
8.1.1. Nanomaterials... 218
8.1.2. Nanoecotoxicology... 218
8.1.3. Behaviour and fate of QDs in the aquatic environment... 219
8.1.4. Uptake, accumulation and tissue distribution... 221
8.1.5. Subcellular partitioning and metabolism... 222
8.1.6. Mode of action and toxicity... 223
8.2. Conclusions... 227
8.3. Future perspectives... 229
viii
FIGURE INDEX
Chapter 1 General Introduction
Figure 1.1. Scheme illustrating the potential behaviour and fate of engineered nanomaterials (ENMs) in the aquatic environment and associated biological processes with bivalve molluscs... 7 Figure 1.2. Timeline of the number (■) and cumulative number (□) of papers
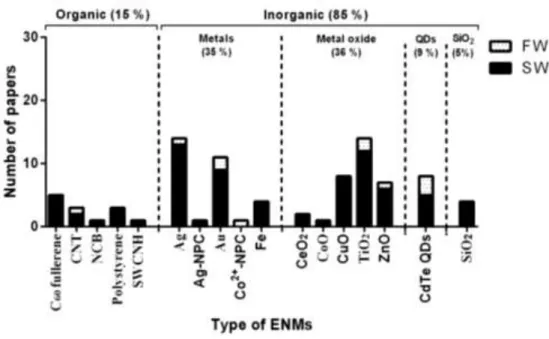
published per year related to ecotoxicity of engineered nanomaterials (ENMs) in bivalve molluscs until December, 2014... 11 Figure 1.3. Number of papers per year related to type of engineered nanomaterials
(ENMs) until December, 2014... 12 Figure 1.4. Number of papers related to ecotoxicity of engineered nanomaterials
(ENMs) according to species of bivalve molluscs until December, 2014... 12 Figure 1.5. General scheme illustrating the potential toxicokinetics of engineered
nanomaterials (ENMs) in bivalve molluscs (e. g. clams)... 22 Figure 1.6. General scheme of subcellular localization of engineered nanomaterials
(ENMs) in the bivalve mollusc cells………... 24 Figure 1.7. General scheme illustrating the mode of action (MoA) of metal-based
ENMs in bivalve molluscs... 26 Figure 1.8. Anatomy and optical properties of quantum dots (QDs)... 40 Figure 1.9. General scheme illustrating the behaviour and transformation of quantum
dots (QDs) in the aquatic environment... 41 Figure 1.10. General scheme illustrating the mode of action (MoA) of quantum dots
(QDs) in bacteria, using the gram-negative bacteria Escherichia coli as model system... 45 Figure 1.11 Representative scheme of different approaches used to study the toxicity
of quantum dots (QDs) in fish species, using zebrafish Danio rerio as model system... 62 Figure 1.12. Scheme illustrating the trophic transfer of quantum dots (QDs)... 67 Figure 1.13. Analytical techniques used for characterization of CdTe quantum dots
(QDs)... 71 Figure 1.14. Multibiomarker approaches used to assess the MoA and toxicity of
quantum dots (QDs) in the marine mussel M. galloprovincialis…….…... 72 Figure 1.15. The marine mussel Mytilus galloprovincialis used in this study. A. The
ix
shell as seen from the right site B. The internal structure of mussels: posterior retractor muscle (1), byssus (2), gills (3), digestive gland (4),
foot (5) and shell (6)………. 73
Figure 1.16. Map showing the collection site (red circle), located in the Ria Formosa Lagoon, Southeast of Portugal (37°06'59.4"N, 7°37'45.0"W)... 74
Chapter 2 Toxicokinetics and tissue distribution of cadmium-based quantum dots in the marine mussel Mytilus galloprovincialis
Figure 2.1. Transmission Electron Microscopy (TEM) image of CdTe quantum dots (QDs) (A) and hydrodynamic diameter histogram of QDs suspended in seawater at pH 8.0 (B)... 83 Figure 2.2. Hydrodynamic diameter (mean ± std nm) (A) and zeta potential (mean ±
std mV) (B) of CdTe quantum dots (QDs) suspended in Milli-Q water (MQ) and seawater (SW) with three types of natural organic matter (NOM): salicylic acid (SA), tannic acid (TA) and humic acid (HA) at pH 8.0... 84 Figure 2.3. Cd concentration (mean ± std M) in water after exposure to CdTe
quantum dots (QDs) and to dissolved cadmium (Cd) for 24 h (A) during accumulation (21 days) and depuration (50 days) periods (B)... 85 Figure 2.4. Cd concentration (mean ± std µg g-1 d. w. tissue) and first-order kinetic
model (Km) of Cd accumulation (A-E) and elimination (F-J) in the whole soft tissues (A,F), gills (B,G), hemolymph (C,H), digestive gland (D,I) and remaining tissues (E,J) of mussels M. galloprovincialis from controls (C), exposed to CdTe quantum dots (QDs) and to dissolved cadmium (Cd) during the accumulation period (21 days) (A-E) and the depuration period (50 days) (F-J)...………...……… 87
Chapter 3 Effects of cadmium-based quantum dots on subcellular partitioning, metallothionein response and oxidative damage on the marine mussel
Mytilus galloprovincialis
Figure 3.1. Analytical procedure for subcellular fractionation of mussel tissues by differential centrifugation... 102 Figure 3.2. Cd distribution (%) in the subcellular fractions of the gills (A-C) and
x
digestive gland (D-F) of mussels M. galloprovincialis from control (A,D), exposed to CdTe quantum dots (QDs) (B,E) and to dissolved Cd (C,F) during the exposure period (21 days). Cd concentration was analysed in the total homogenate (Ht) and in three subcellular fractions: insoluble (IF), high-molecular-weight proteins (HMW) and low-molecular-weight proteins (LMW) fractions... 107 Figure 3.3. Cd concentration (mean ± std µg g-1 d. w.) and first-order kinetic model
(KM) of the Cd accumulated in the biologically active (BAM) and
detoxified (BDM) form in the gills (A) and digestive gland (B) from mussels M. galloprovincialis exposed to CdTe quantum dots (QDs) and to dissolved Cd during the exposure period (21 days)... 110 Figure 3.4. Net accumulation rates for total accumulated Cd (Cd-total), biologically
active metal (BAM) or biologically detoxified metal (BDM) in the gills (A-C) and digestive gland (D-E) from mussels M. galloprovincialis exposed to CdTe quantum dots (QDs) and to dissolved Cd during the exposure period (21 days)... 112 Figure 3.5. Cd concentration (mean ± std µg g-1 d. w. tissue) and first-order kinetic
model (KM) of the Cd accumulated in the biologically active (BAM) and detoxified (BDM) forms in the gills (A) and digestive gland (B) from mussels M. galloprovincialis exposed to CdTe quantum dots (QDs) and to dissolved Cd during the depuration periods (50 days)... 113 Figure 3.6. Cd distribution (%) in the subcellular fractions of the gills (A-C) and
digestive gland (D-F) of mussels M. galloprovincialis from control (A,D), exposed to CdTe quantum dots (QDs) (B,E) and to dissolved Cd (C,F) during the depuration period (50 days). Cd concentration was analysed in the total homogenate (Ht) and three subcellular fractions: insoluble (IF), high-molecular-weight protein (HMW) and low-molecular-weight protein fractions (LMW)... 114 Figure 3.7. MTs concentration (mean ± std µg g-1 w. w. tissue) in the gills (A,B) and
digestive gland (C,D) of mussel M. galloprovincialis from controls (C), exposed to CdTe quantum dots (QDs) and to dissolved Cd (Cd) during the exposure period (21 days) (A,C) and depuration (50 days) periods (B,D)... 115
xi
Figure 3.8. LPO levels (mean ± std MDA + 4-HNE nmol g-1 w. w. tissue) in the gills (A,B) and digestive gland (C,D) of mussel M. galloprovincialis from controls (C), exposed to CdTe quantum dots (QDs) and to dissolved Cd (Cd) during the exposure period (21 days) (A,C) and depuration periods (50 days) (B,D)... 120 Figure 3.9. PCA analysis between total Cd concentration and in different subcellular
fractions (IF, HMW, LMW), MTs and LPO levels in the gills (A-B) and digestive gland (C-D) of mussels M. galloprovincialis from controls (C), exposed to CdTe quantum dots (QDs) and to dissolved cadmium (Cd) during 21 days of exposure (A-D) and after 50 days of depuration (E-H).. 123
Chapter 4 Immunocytotoxicity, cytogenotoxicity and genotoxicity of cadmium-based quantum dots in the marine mussel Mytilus galloprovincialis Figure 4.1. Transmission Electron Microscopy (TEM) image of CdTe quantum dots
(QDs) in Milli-Q water (A) and particle size histogram of QDs obtained from TEM images (B)... 135 Figure 4.2. ζ-potential (A) and hydrodynamic diameter (B) of CdTe quantum dots
(QDs) suspended in Milli-Q water and natural seawater at pH between 1.7 and 12... 136 Figure 4.3. Hydrodynamic diameter (A), polydispersity index (B), turbidity (C) and
sedimentation rate (D) of CdTe quantum dots (QDs) suspended in Milli-Q water and natural seawater at pH 8.0 over time... 137 Figure 4.4. Cd accumulation in whole soft tissue (A) and hemolymph (B) of mussels
M. galloprovincialis (µg g-1 d. w. tissue) from controls (C), exposed to CdTe quantum dots (QDs) and dissolved Cd (Cd2+) for 14 days (mean ± std)... 138 Figure 4.5. Lysosomal membrane stability (LMS) (mean ± std) in mussels
M. galloprovincialis from controls (C), exposed to CdTe quantum dots
(QDs) and dissolved Cd (Cd2+) for 14 days... 140 Figure 4.6. Light microscopic image of hemocytes in mussels M. galloprovincialis
from controls (C), exposed to CdTe quantum dots (QDs) and dissolved Cd (Cd2+) and for 14 days... 141
xii M. galloprovincialis from controls (C), exposed to CdTe quantum dots
(QDs) and dissolved cadmium (Cd2+) at 14 days expressed as Eosinophils % (A), Basophils % (B), Hyalinocytes % (C) and hemocytes aggregates % (D)... 142 Figure 4.8. Genotoxic effects of CdTe quantum dots (QDs) and dissolved Cd (Cd2+)
in mussels M. galloprovincialis exposed for 14 days. (A). Frequency of nuclear abnormalities (mean ± std) expressed as frequency of binucleated cells (BN), micronucleus (MN) and Bud. (B). DNA damage (mean ± SEM) expressed as tail DNA %... 143 Figure 4.9. Comet assay images of hemocytes in mussels M. galloprovincialis from
controls (C), exposed to CdTe quantum dots (QDs) and dissolved Cd (Cd2+) and for 14 days (total magnification 400x). H2O2 was the positive
control………... 144
Chapter 5 Tissue specific toxicity of cadmium-based quantum dots in the marine mussel Mytilus galloprovincialis
Figure 5.1. Superoxide dismutase (SOD) (A-B), catalase (CAT) (C-D), total glutathione peroxidase (Total GPx) (E-F) and glutathione-S-transferase (GST) (G-H) activities in the gills and digestive gland of mussels M.
galloprovincialis from controls (C), exposed to CdTe quantum dots
(QDs) and to dissolved cadmium (Cd) for 14 days (mean ± std)... 162 Figure 5.2. independent glutathione peroxidase (I GPx) (A-B) and
Se-dependent glutathione peroxidase (Se-D GPx) (C-D) activities in the gills (A, C) and digestive gland (B, D) of mussels M. galloprovincialis from controls (C), exposed to CdTe quantum dots (QDs) and to dissolved cadmium (Cd) for 14 days (mean ± std)... 164 Figure 5.3. Principal component analysis (PCA) of Cd accumulation and of a battery
of biomarkers (SOD, CAT, total GPx, Se-I GPx, Se-D GPx and GST activities) in the gills (A-B) and digestive gland (C-D) of mussels M.
galloprovincialis from controls (C), exposed to CdTe quantum dots
(QDs) and to dissolved cadmium (Cd) for 14 days... 167 Figure 5.4. General scheme illustrating the tissue specific response in the gills (A)
xiii
quantum dots (QDs) and to dissolved cadmium (Cd) for 14 days... 169
Chapter 6 Histopathological assessment and inflammatory response in the digestive gland of marine mussel Mytilus galloprovincialis exposed to cadmium-based quantum dots
Figure 6.1. Scheme of the procedure used to measure the histomorphometric parameters of digestive tubules in mussels M. galloprovincialis (adapted from Marigómez et al. 1990)... 179 Figure 6.2. Digestive tubule types (%) in mussels M. galloprovincialis from control
(C), exposed to CdTe quantum dots (QDs) and to dissolved Cd (Cd) for 14 days... 182 Figure 6.3. Photomicrographs of the digestive gland of mussels M. galloprovincialis
from control (A-B), exposed to CdTe quantum dots (QDs) (C-D) and to dissolved Cd (E-F) for 14 days... 183 Figure 6.4. Histomorphometric parameters (mean ± std) of digestive tubules in
mussels M. galloprovincialis from control (C), exposed to CdTe quantum dots (QDs) and to dissolved Cd (Cd) for 14 days: tubule perimeter (P0)
(A), lumen perimeter (Pi) (B), epithelial layer area (S0) (C), lumen area
(Si) (D), mean epithelial thickness (h) (E) and circularity (F)... 185
Figure 6.5. Cell type composition (mean ± std) of the digestive tubule epithelium in mussels M. galloprovincialis from control (C), exposed to CdTe quantum dots (QDs) and to dissolved Cd (Cd) for 14 days: basophilic cell frequency (%) (A), digestive cell frequency (%) (B), rate between both digestive tubule cell types (RBas/Dig) (C), hemocyte frequency (%) (D),
total cell number per digestive tubule (E) and per epithelial layer area (S0) (F)... 188
Figure 6.6. Inflammatory response (mean ± std) in the digestive gland of mussels
M. galloprovincialis from control (C), exposed to CdTe quantum dots
(QDs) and to dissolved Cd (Cd) for 14 days: intensity of the haemocytic infiltration (A) and haemocytic aggregates (B)... 189 Figure 6.7. Frequency of the haemocytic infiltration (%) (A - C) and haemocytic
aggregates (%) (D - F) distributed by grade of the inflammatory response in the digestive gland of mussels M. galloprovincialis from control (C)
xiv
(A and D), exposed to CdTe quantum dots (QDs) (B and E) and to dissolved Cd (Cd) (C and F) for 14 days... 190 Figure 6.8. Histopathological condition indices (Ih) (mean ± std) of the digestive
gland in mussels M. galloprovincialis from control (C), exposed to CdTe quantum dots (QDs) and to dissolved Cd (Cd) for 14 days: tubular alteration index (Ih1) (A), intertubular alteration index (Ih2) (B) and total
histopathological index (Ihtotal) (C)... 192
Figure 6.9. Principal component analysis (PCA) of Cd concentration and of a battery of tissue-level biomarkers (histomorphometric parameters of the digestive tubule epithelium and lumen, digestive tubule cell type composition and histopathological indices) and inflammatory response (haemocytic infiltration and aggregation intensities) in the digestive gland of mussels M. galloprovincialis from controls (C), exposed to CdTe quantum dots (QDs) and to dissolved cadmium (Cd) during 14 days of exposure (A-B)... 193
Chapter 7 Differential proteomic response to cadmium-based quantum dots in the marine mussel Mytilus galloprovincialis
Figure 7.1. Master gel (A) constructed combining the information from the 2-DE gels of the digestive gland of M. galloprovincialis from control (B), exposed to CdTe quantum dots (QDs) (C) and to dissolved cadmium (Cd)
(D) for 14 days……… 203
Figure 7.2. Venn diagrams comparing the number of differential expressed proteins in the digestive gland of unexposed mussels and exposed to CdTe quantum dot (QDs) and dissolved Cd...………...… 204 Figure 7.3. Sets of protein spots differently expressed in the digestive gland of
mussels exposed to CdTe quantum dot (QDs) and dissolved Cd compared to unexposed ones... 206 Figure 7.4. Sets of protein spots observed only in the digestive gland of mussels
exposed to both Cd forms (QDs vs dissolved Cd) compared to unexposed ones... 207 Figure 7.5. Sets of protein spots differently expressed only in the digestive gland of
xv
unexposed ones.………...… 208
Chapter 8 General discussion, conclusions and future perspectives
Figure 8.1. General scheme illustrating routes for uptake, tissue distribution and elimination of quantum dots (QDs) and its dissolved counterpart in the marine mussel M. galloprovincialis... 222 Figure 8.2. General scheme illustrating the mode of action (MoA) and toxicity of
xvi
TABLE INDEX
Chapter 1 General Introduction
Table 1.1. Ecotoxicological impact of engineered nanomaterials (ENMs) in marine and freshwater bivalve molluscs………....………...… 13 Table 1.2. Interactive effects of nanomaterials (NMs) with other pollutants in marine
organisms……….………...…. 33
Table 1.3. Ecotoxicity of quantum dots (QDs) to bacteria... 47 Table 1.4. Ecotoxicity of quantum dots (QDs) to different micro-organisms (algae,
protozoa, rotifera and fungi)………... 52 Table 1.5. Ecotoxicity of quantum dots (QDs) to different invertebrates (crustacean,
annelid, platyhelminths, nematode and bivalve)……...…...…. 58 Table 1.6. Ecotoxicity of quantum dots (QDs) to different fish species... 63
Chapter 2 Toxicokinetics and tissue distribution of cadmium-based quantum dots in the marine mussel Mytilus galloprovincialis
Table 2.1. Accumulation rate (Ka), loss rate (Kl), elimination rate (Ke), half-life (t1/2)
and bioconcentration factor (BCF) in M. galloprovincialis tissues from controls (C), exposed to CdTe quantum dots (QDs) and to dissolved cadmium (Cd) during the accumulation (21 days) and depuration (50 days) periods... 88 Table 2.2. Production rate (mean ± std mg g-1 d. w. tissue per day) and Cd
concentration in biodeposits (mean ± std µg g-1 d. w.) of mussel
M. galloprovincialis from controls (C), exposed to CdTe quantum dots
(QDs) and to dissolved cadmium (Cd) during the accumulation (21 days) and depuration periods (50 days)... 89
Chapter 3 Effects of cadmium-based quantum dots on subcellular partitioning, metallothionein response and oxidative damage on the marine mussel
Mytilus galloprovincialis
Table 3.1. Characterization of CdTe quantum dots (QDs) in aqueous medium using different analytical techniques... 105 Table 3.2. Accumulation rate (Ka), loss rate (Kl), elimination rate (Ke), half-life (t1/2)
xvii
mussels M. galloprovincialis from controls (C), exposed to CdTe quantum dots (QDs) and to dissolved Cd (Cd) during the exposure (21 days) and the depuration (50 days) periods... 109 Table 3.3. Accumulation rate (Ka), loss rate (Kl), elimination rate (Ke) and half-life
(t1/2) of MTs and LPO in the gills and digestive gland of mussels M.
galloprovincialis from controls (C), exposed to CdTe quantum dots (QDs)
and to dissolved Cd (Cd) during the exposure (21 days) and the depuration (50 days) periods... 117
Chapter 4 Immunocytotoxicity, cytogenotoxicity and genotoxicity of cadmium-based quantum dots in the marine mussel Mytilus galloprovincialis Table 4.1. Cell viability and hemocyte density in mussels M. galloprovincialis from
controls (C), exposed to CdTe quantum dots (QDs) and dissolved cadmium (Cd2+) for 14 days (mean ± std)... 139 Table 4.2. Frequency of hemocytes (%) distributed by grade of DNA damage in
M. galloprovincialis from controls (C), exposed to CdTe quantum dots
(QDs) and dissolved cadmium (Cd2+) for 14 days... 144
Chapter 5 Tissue specific toxicity of cadmium-based quantum dots in the marine mussel Mytilus galloprovincialis
Table 5.1 Characterization of CdTe quantum dots (QDs) in aqueous medium using different analytical techniques………... 160
Chapter 6 Histopathological assessment and inflammatory response in the digestive gland of marine mussel Mytilus galloprovincialis exposed to cadmium-based quantum dots
Table 6.1. Histopathologies in the digestive gland of mussel M. galloprovincialis and their importance weight (w)... 180
Chapter 7 Differential proteomic response to cadmium-based quantum dots in the marine mussel Mytilus galloprovincialis
Table 7.1. Number of differentially expressed proteins (≥ 2 fold) in the digestive gland of mussels Mytilus galloprovincialis exposed to quantum dots (QDs)
xviii
and dissolved Cd (Cd) compared with unexposed mussels (C)... 206 Table 7.2. List of protein spots observed in the digestive gland of mussels exposed
only to quantum dots (QDs)…………...………...…….……… 210 Table 7.3. List of protein spots differently expressed in the digestive gland of mussels
exposed to quantum dot (QDs) compared to controls and dissolved Cd-exposed mussels………..………...…… 211 Table 7.4. List of protein spots observed in the digestive gland of mussels exposed to
dissolved Cd………...……… 211 Table 7.5. List of protein spots differently expressed only in the digestive gland of
mussels exposed to dissolved Cd compared to controls and QDs-exposed
mussels………...……… 214
Table 7.6. List of protein spots observed only in the digestive gland of mussels exposed to both Cd forms (QDs and dissolved Cd)……..…………....…… 215 Table 7.7. List of protein spots differently expressed only in the digestive gland of
mussels exposed to both Cd form (QDs and dissolved Cd)….……….. 216 Table 7.8. List of spots only observed in the digestive gland of unexposed mussels
xix
ABBREVIATIONS
1-DE One dimension electrophoresis, 2-DE Two-dimensional gel electrophoresis
2D-PAGE Two-dimensional polyacrylamide gel electrophoresis 4-HNE 4-hydroxyalkenals
AAS Atomic absorption spectrometry AChE Acetylcholinesterase
ACP Acid phosphatase
AFM Atomic force microscopy
AGNES Absence of gradients and Nernstian equilibrium stripping
AMP Adenosine monophosphate
APP Amphiphyllic polymers like modified polyacrylic acid BAM Biologically active metal
BCF Bioconcentration factor BDM Biologically detoxified metal
BDs Biodeposits
BMs Biomarkers
BN Binucleated cell
BSA Bovine serum albumin
CAS Caspase
CAT Catalase
Cb Carbonylation
cb Conduction band
CB Cd concentration in the subcellular fraction CB0 Initial Cd concentration
Cd Cadmium
CDNB 1-chloro 2,4 dinitrobenzene CFU Colony-forming unit
CI Condition index
CNPq National council for scientific and technological development
CNT Carbon nanotubes
Co-NC Co2+-containing nanoscale polymeric complex
xx
CW Cd concentration in seawater DAPI 4,6-diamidino-2-phenylindole DCC Differential cell counts
DG Digestive gland
dh Hydrodynamic diameter
DHLA Dihydrolipoic acid
DIGE Difference gel electrophoresis DLS Dynamic light scattering
DNA Deoxyribonucleic acid
DOC Dissolved organic carbon
DOPC 1,2-DiOleoyl-sn-glycéro-3-PhosphoCholine
E2 17β-estradiol
EC50 Half maximal effective concentration EDTA Ethylenediaminetetraacetic acid ELS Electrophoretic light scattering ENMs Engineered nanomaterials ENPs Engineered nanoparticles
EPA US Environmental Protection Agency EPF Extrapallial fluid
EPS Extracellular polymeric substances ERKs Extracellular signal regulating kinase FTIR Fourier transform infrared spectroscopy
FW Freshwater Go Gonad GPx Glutathione peroxidase GR Glutathione reductase GSH Glutathione GSH-t Total glutathione GSSG Glutathione disulphide GSSH Oxidized glutathione GST Glutatione-S-transferase
h Mean epithelial thickness
xxi
HMW High molecular weight HRG Histidine-rich glycoprotein
HSA Human serum albumin
HSP Heat shock proteins
Ht Whole tissue homogenate
IARC International agency for research on cancer IC50 Half maximal inhibitory concentration IEF Isoelectric focusing
IF Insoluble fraction
Ih Histopathological condition indices
iTRAQ Isobaric tags for relative and absolute quantitation
Ka Accumulation rate
Ke Elimination rate
Kl Loss rate
LC50 Median lethal concentration
LDH Lactate dehydrogenase
LMA Low melting point agarose LMS Lysosomal membrane stability
LMW Low molecular weight
LPO Lipid peroxidation
LOD Limit of detection limit LOQ Limit of quantification MAA Mercaptoacetic acid
MAPKs Mitogen-activated protein kinase MAS Mercaptosuccinic acid
MDA Malondialdehyde
MEA 2-mercaptoethylamine
MN Micronucleus
MoA Modes of action
MPA Mercaptopropionic acid
MPEG-SH Thiol-terminated methyl polyethylene glycol
MQ Milli-Q water
xxii
MT Metallothionein
MT-SH Metallothionein related thiols MxR Multixenobiotic resistance NAC N-acetyl-L-cysteine NCB Nano-sized carbon Black NER Nucleotide excision repair NMA Normal melting point agarose
NO Nitric oxide
NOM Natural organic matter
NPs Nanoparticles
n-Ps Nanopolystyrene
NR Neutral red
NRRT Neutral red retention time NTA Nanoparticle tracking analysis
OECD Organization for economic co-operation and development
Ox Oxidation
P0 Tubule perimeter
PAHs Polycyclic aromatic hydrocarbons
PAA Poly(acrylic acid)-octylamine copolymer
PC Phytochelatins
PCA Principal component analysis
PEG Polyethylene glycol
PEPs Protein expression profiles
Pf Pseudofeces
Phe Phenanthrene
Pi Lumen perimeter
Pk Proportion of each digestive tubule type
PMF Peptide mass fingerprinting
PO Phenoloxidase
PSH Protein thiol
PSMA Amphiphilic polymer poly(styrene-co-maleic anhydride) terminated with cumene
xxiii RBas/Dig Rate between number of basophilic and digestive cells
RNS Reactive nitrogen species ROS Reactive oxygen species
RT Remaining tissues
S0 Epithelial layer area
SA Salicylic acid
SAA Sulfhydryl acetic acid
SCP Stripping chronopotentiometry Se-D GPx Se-dependent glutathione peroxidase Se-I GPx Se-independent glutathione peroxidase SEM Scanning electron microscopy
Si Digestive tubule lumen area
SOD Superoxide dismutase
SPM Suspended particulate matter
SR Sedimentation rate
SW Seawater
SWCNHs Single walled carbon nanohorns
t1/2 Half-life time
TA Tannic acid
TBARS Tiobarbituric acid reactive substances TCA Trichloroacetic acid
TCDD 2,3,7,8-tetrachlorodibenzo-p-dioxins TEM Transmission electron microscopy
TGA Thioglycolic acid
THR Turbidimeter of high resolution
TK Toxicokinetics
TLR Toll-like receptor TOPO Tri-n-octylphosphine TrxR Thioredoxin reductase TTF Trophic transfer factor
Ub Ubiquitination
vb Valence band
xxiv
VvBAS Basophilic cell volume density
w Importance weight
WAF Water accommodated fraction WGA Wheat germ agglutinin
XRD X-ray diffraction
ZFL Zebrafish liver
ZVI Zero-valent nanoiron
1
CHAPTER I
2
Part of this Chapter was published in:
Rocha, T.L., Gomes, T., Sousa, V.S., Mestre, N.C., Bebianno, M.J., 2015a. Ecotoxicological impact of engineered nanomaterials in bivalve molluscs: an overview. Marine Environmental Research. 111, 74-88. doi:10.1016/j.marenvres.2015.06.013
Part of this Chapter is being prepared for submission to:
Rocha, T.L., Mestre, N.C., Bebianno, M.J. Ecotoxicity of quantum dots at various trophic levels: an overview. Science of the Total Environment.
3
1.1. Nanotechnology and nanomaterial
Nanotechnology is a key enabling technology (KET) and provides the basis for innovation in a wide range of products across all industrial sectors. This technology is defined by the European Committee for standardization (CEN) as “design,
characterization, production, and application of structures, devices, and systems by controlling shape and size at the atomic scale” (CEN, 2016). Additionally, the
Environmental Protection Agency (EPA) defines nanotechnology as “research and
technology development at the atomic, molecular, or macromolecular levels using a length scale of approximately one to one hundred nanometers in any dimension; the creation and use of structures, devices and systems that have novel properties and functions because of their small size; and the ability to control or manipulate matter on an atomic scale” (EPA100/B-07/001:2007), while the U.S. National Nanotechnology
Initiative (NNI) describes nanotechnology as “the understanding and control of matter
at dimensions between approximately 1 and 100 nm, where this unique phenomena enable novel applications” (NNI, 2010). Nanotechnology has been considered as
research priority in several countries, including member states of the European Union, USA, Japan, China and Russia, wherein nanotechnological innovations may improve the quality of life, economic growth and competitiveness of the industry (Savolainen et al., 2015), as well as environmental quality. In the Latin America, Brazil has been recognized as a leader in nanotechnology research, where started in the early 1990s, but its impacts on health and environment risks are still in its infancy (Kay and Shapira, 2009).
Nanoparticles (NPs) occur naturally in the environment (e. g. colloids, volcanic eruptions, forest fires). However the rapid development of nanotechnology has led to the production of engineered nanomaterials (ENMs) designed with specific characteristics to be used in a broad range of consumer products. Global production of ENMs are projected to grow to half a million tons with the number of ENMs-containing consumer products reaching 3400 by 2020 (www.nanoproject.org). This fast expansion will inevitably drive the release of ENMs into the aquatic environment directly (sewage, effluents, river influx) or indirectly (aerial deposition, dumping and run-off) (Moore, 2006; Baker et al., 2014) and reach different compartments (water, sediments, etc.). However, data about the concentration range at which different ENMs can actually be
4
detected in the environment is limited, especially due to methodological restrictions and scarce information about their fate in the aquatic environment (Minetto et al., 2014).
ENMs released into the aquatic systems may interact with aquatic organisms and induce toxic effects at different levels of biological organization. These potential ecotoxicological risks of ENMs to aquatic organisms have recently been reviewed (Lapresta-Fernández et al., 2012; Matranga and Corsi, 2012; Misra et al., 2012; Ma and Lin, 2013; Maurer-Jones et al., 2013; Baker et al., 2014; Corsi et al., 2014; Minetto et al., 2014; Grillo et al., 2015) but their mode of action (MoA) and biological risk remain unclear. Despite the emerging literature on the toxicity of ENMs in bivalve molluscs in recent years, their MoA and specific biomarkers for monitoring water pollution needs further clarification.
1.2. ENMs properties and characterization
ENMs can be classified as organic and inorganic. Fullerenes and carbon nanotubes (CNT) are carbon-based ENMs, while metals and metals oxides NPs, quantum dots (QDs) and SiO2 NPs are defined as inorganic (Fadeel and Garcia-Bennett, 2010). ENMs exhibit specific physico-chemical properties that differ from their bulk material, which can be tailored due to the amount of atoms lying on the surface of the material (Casals et al., 2008). In bulk material there is a very low ratio between the number of atoms on the surface and those in the bulk, while at the nanoscale range the ratio between the surface area and volume is higher (Cupaioli et al., 2014). These properties are affected by ENMs small size and determine their behaviour, biological effects and consequently their toxicity. In addition, some ENMs are coated or capped with slight amounts of oxides or other chemical compounds to increase several chemical properties such as dispersibility and conductivity, as well as to prevent aggregation/agglomeration (Peralta-Videa et al., 2011).
In order to determine ENMs intrinsic properties it is critical to perform an appropriate physical and chemical characterization. Particle size, surface chemistry and charge, crystallinity, phase purity, solubility and shape are essential to explain the homogeneity, stability, reactivity, bioavailability and application potential of ENMs in different media (Kahru and Dubourguier, 2010). Particle size is one of the most important physico-chemical properties of ENMs which can be related with their
5
behaviour. It is also one of the main factors that affect bioavailability, distribution and retention of the ENMs in target tissues (Peralta-Videa et al., 2011; Cho et al., 2013).
Microscopic techniques provide an accurate assessment of the size and shape of ENMs, creating surface images by scanning the ENMs using a physical probe (López-Serrano et al., 2014). Scanning and Transmission Electron Microscopy (SEM and TEM) also allow the identification of structure and morphology of ENMs (Karlsson et al., 2009). However, it often requires complicated sample preparation, which could lead to imaging artefacts due to previous sample treatment and also to vacuum conditions. Atomic Force Microscopy (AFM) provides quantitative and qualitative data on physical properties such as size, morphology, surface texture and roughness (López-Serrano et al., 2014). This technique is based on van der Waals forces and could be applied in liquid media (Ju-Nam and Lead, 2008). However ENMs dimensions could be overestimated in some conditions.
Dynamic Light Scattering (DLS) is commonly used for ENMs size determination since it provides a simple and fast estimate of particle size. It is also very valuable to determine the size and aggregation/agglomeration conditions in nanotoxicological tests. According to their size, ENMs and aggregates acquire different mobility, which is referred as hydrodynamic diameter (dh). In DLS, the Brownian
movement of ENMs suspended in a liquid is measured (Pelley and Tufenkji, 2008). Despite DLS being frequently used to establish the size and dh of ENMs in solution
(Karlsson et al., 2009), several studies suggest inherent limitations of this technique, often associated with signal loss by smaller particles due to the signal intensity of bigger ones, i. e., the scattering intensity of small particles tends to be masked by the larger ones (Hoo et al., 2008).
Other technique widely used for ENMs size determination is X-ray diffraction (XRD), which also provides information on surface properties and coatings, crystallographic structure or elemental composition (Ju-Nam and Lead, 2008). XRD applies the Scherrer method to calculate particle size, but the accuracy of such method is poor (Calvin et al., 2005). An innovative system for ENMs sizing is nanoparticle tracking analysis (NTA), a single particle tracking technique based on dark field or fluorescence microscopy and automatic imaging analysis. NTA is an advantageous method since it tracks individual ENMs and provides a high resolution for multimodal samples and aggregation/agglomeration (Saveyn et al., 2010).
6
Electrophoretic light scattering (ELS) is a common technique in surface charge determination, expressed as zeta potential (ζ-potential). Applying an electric field, the electrophoretic mobility of suspended ENMs in the medium is evaluated (Ju-Nam and Lead, 2008). Generally, if the ζ-potential is more positive than +30 mV or more negative than -30 mV the ENMs have colloidal stability maintained by electrostatic repulsion. Similar to DLS, in bimodal samples ζ-potential of larger particles dominates the scattering signal of smaller ones (Murdock et al., 2008). ζ-potential of different ENMs is affected by ionic strength and pH of solutions, as for example, variations according to pH of ENMs suspended in freshwater in comparison to seawater, as seen for CdTe QDs (Rocha et al., 2014).
Techniques like UV-Vis and Fourier transform infrared spectroscopy (FTIR) are spectroscopic methods usually employed in fullerenes and derivatives characterization particularly in aquatic environments (Pérez et al., 2009). Elemental composition and chemical state of ENMs can be assessed by X-ray photoelectron spectroscopy (Chae et al., 2009). Secondary ion mass spectroscopy is another technique used to verify ENMs elemental composition by ionization and sputtering of the surface atoms (Putnam et al 2008). It is well known that an appropriate characterization is needed. The most applied and useful techniques for characterizing ENMs were described, however a detailed explanation about each one is beyond the scope of this review.
Since all these techniques depend on different sample preparation and physical principles, the results of ENMs characterization in ecotoxicological tests differ according to the method used (Mahl et al., 2011). For example, based on different methods and types of reports, namely intensity, number or volume, silver (70 nm) and gold (15 nm) NPs were measured in the range of 40 - 124 nm and 11 - 52 nm, respectively (Mahl et al., 2011). In addition, even applying the same method, size determination depends on sample preparation. Bath sonication or vortex mixing is normally used to ensure ENMs dispersion for DLS measurements. Therefore, it is often observed that increasing sonication duration ultimately promotes agglomeration after initial dispersion (Murdock et al., 2008). In this context, no standardized methods for preparation of ENMs are used in ecotoxicological tests with marine and freshwater species, making a direct comparison between studies difficult. This concern was also raised recently in the experimental conditions with n-TiO2 using different taxa of seawater organisms (Minetto et al., 2014).
7
1.3. Behaviour and fate of ENMs in the aquatic environment
Once released into the environment, ENMs will interact with each other and with their surrounding environment (Wiesner et al. 2009). In Figure 1.1 the possible interactions of ENMs in the aquatic environment are described. In the aquatic environment, ENMs behaviour and fate is dependent on nano-specific properties such as size, shape, chemical composition, surface charge, coating and particles state (free or matrix incorporated).
Figure 1.1. Scheme illustrating the potential behaviour and fate of engineered nanomaterials (ENMs) in the aquatic environment and associated biological processes with bivalve molluscs. NOM: Natural Organic Matter.
Environmental conditions, such as pH, temperature, ionic strength, composition and concentration of natural organic matter (NOM) and suspended particulate matter (SPM) also play an important role on ENMs behaviour, interacting to affect their aggregation/agglomeration or stabilisation (Fabrega et al., 2011; Sousa and Teixeira, 2013; Corsi et al., 2014). Identifying ENMs interactions under different conditions is essential to predict their fate and behaviour in the aquatic environment and thus estimate exposure scenarios as well as their potential ecotoxicity (Blinova et al., 2010; Keller et al., 2010). Accordingly, species can interact with different states of ENMs in the aquatic environment: (i) individual; (ii) small and larger homo-aggregates (NaCl-induced
8
aggregation/agglomeration); (iii) individual ENMs stabilized by NOM or SPM; (iv) small and larger hetero-aggregates (NOM-stabilization); (v) ion metal released from ENMs; (vi) metal-complex formed after metal release from ENMs; (vii) ENMs adsorbed to algae; (viii) ENMs adsorbed to other pollutants (Trojan horse effect) (Fig. 1.1).
Environmental impact is determined by the extent of aggregation/agglomeration, stabilisation and settling of ENMs when entering aquatic systems, as well as by the characteristics of the environmental matrix itself (Maurer-Jones et al., 2013; Sousa and Teixeira, 2013; Rocha et al., 2014). However, individual or small aggregates of ENMs may remain dispersed as colloids in solution (Brar et al., 2010). The rate of ENMs aggregation/agglomeration and sedimentation depend upon concentration, surface area and forces involved in collision, but variations in NOM, pH, ionic strength and surfactant present in fresh and marine waters will have a substantial influence on these phenomena (Peralta-Videa et al., 2011). On the other hand, when ENMs mobility increase, prolonged suspension in aquatic systems could lead to the horizontal transport of these materials over substantial distances (Baalousha et al., 2008). In the case of ENMs sedimentation, horizontal transport in the water column is reduced while local exposure to ENMs can increase. After sedimentation, benthic bivalve species are important targets for accumulation and toxicity of ENMs, as observed for the clam
Scrobicularia plana exposed to CuO (10 - 100 nm; 10 g L-1; 16 d), 67ZnO (21 - 34 nm; 3 mg Kg-1 sediment; 16 d) and Ag NPs (40 - 50 nm; 10 µg L-1; 14 h) (Buffet et al., 2012, 2013b; Mouneyrac et al., 2014). Furthermore, bioturbation and resuspension in the sediment can lead to an increase of ENMs concentration in the sediment-water interface, promoting particle exchange between the sediment and water column, potentially enhancing the bioaccumulation and impact of ENMs (Fig. 1.1).
The marine environment is generally more alkaline and has high ionic strength. Therefore, seawater has a more pronounced effect in the surface charge of ENMs causing more particle collisions and consequently more aggregation/agglomeration and further sedimentation, than freshwater. NOM can increase ENMs stability extending their residence time in the water column and consequently increasing the exposure of aquatic biota, including benthic organisms (Mohd Omar et al., 2014). NOM can stabilize ENMs by the formation of a coating, which can involve a complex combination of electrostatic forces and steric effects between NOM and ENMs surface (Baalousha and Lead, 2013). The majority of authors reported that NOM increase