Effects of cerium dioxide nanoparticles in
Oncorhynchus
mykiss
gills after an acute exposure: assessment of oxidative
stress, genotoxicity and histological alterations
University Fernando Pessoa, Master in Pharmaceutical Sciences Faculty of Health Sciences
Effects of cerium dioxide nanoparticles in
Oncorhynchus
mykiss
gills after an acute exposure: assessment of oxidative
stress, genotoxicity and histological alterations
University Fernando Pessoa, Master in Pharmaceutical Sciences Faculty of Health Sciences
IV
Effects of cerium dioxide nanoparticles in
Oncorhynchus
mykiss
gills after an acute exposure: assessment of oxidative
stress, genotoxicity and histological alterations
I hereby declare that the work carried out in this thesis is entirely original. It was carried out by me and all the resource materials were properly referenced.
Maria Inês Alves Ribeiro
(Signature)
Post-graduate work/dissertation presented to the University Fernando Pessoa as part of
the requirements in order to get the Master degree in Pharmaceutical Sciences, under the
supervision of Prof. Alberto Teodorico Correia (PhD) and co-supervision of Prof. Sara
Antunes (PhD)
University Fernando Pessoa, Master in Pharmaceutical Sciences Faculty of Health Sciences
V
VI
Resumo
Atualmente, o estudo de nanopartículas (NPs) metálicas é cada vez mais comum dentro da comunidade científica. Contudo, os dados sobre ecotoxicologia relativos as NPs de dióxido de cério (CeO2)é escassa. Este trabalho é um estudo experimental sobre
os possíveis efeitos toxicológicos das NPs de CeO2 nas brânquias de Oncorhynchus
mykiss (truta arco-íris). Uma exposição aguda semi-contínua foi realizada e os espécimes da truta arco-íris foram expostas a três concentrações de NPs de CeO2 (0.25,
2.50, ou 25.00 mg/L), incluindo um grupo controlo (não exposto) durante 96 horas. A exposição a NPs de CeO2 causou determinadas patologias nas brânquias, incluindo
aneurismas, elevação epitelial e hiperplasia. A percentagem de lamelas secundárias disponíveis para a troca gasosa (PAGE), não evidenciou diferenças significativas. A exposição a NPs de CeO2 causou diferenças estatísticas na catalase (CAT) que mostram
um aumento da atividade enzimática nas concentrações 2.50 e 25.00 mg/L. No que diz respeito ao teste as substâncias reactivas ao ácido tiobarbitúrico (TBARS), estas apresentaram uma diminuição do valor nas duas concentrações mais elevadas e um aumento na concentração mais baixa. Atividade da Glutationa S-transferase (GST) exibiu um aumento nas duas concentrações mais elevadas e uma diminuição no menor. Nenhuma diferença significativa foi observada na atividade da Na+/K+-ATPase. Por sua vez, os resultados do ensaio dos cometas revelou uma tendência crescente com diferenças significativas. Declaro que os resultados sugerem que as NPs de CeO2
VII
Abstract
At present the study of metallic nanoparticles (NPs) is increasingly common within the scientific community. However ecotoxicology data about cerium dioxide (CeO2) NPs is scarce. This work is an experimental study about the possible
toxicological effects of the CeO2 NPs in the gills of Oncorhynchus mykiss (rainbow
trout). A semi-continuous acute test was conducted and rainbow trout individuals were exposed to three CeO2 NPs concentrations (0.25, 2.50, or 25.00 mg/L), including a
control (unexposed) group for 96 hours. Exposure to CeO2 NPs caused some gill
pathologies including aneurisms, epithelial lifting and hyperplasia. The percentage of secondary lamellae available for gas exchange (PAGE) revealed however no significant differences. Exposure to CeO2 NPs caused statistical differences in the catalase (CAT)
showing an increase of the enzymatic activity in the 2.50 and 25.00 mg/L concentrations. With regard to thiobarbituric acid reactive substances (TBARS) test, showed a decrease value at the two higher concentrations, and an increase at the lowest concentration. Glutathione S-transferase activity (GST) exhibited an increase at the two higher concentrations and a decrease at the lowest. No significant differences were observed in Na+/K+-ATPase activity. In turn, comets assay results revealed an increasing trend with significant differences. The hereby results suggest that CeO2 NP
caused genetic damage, tissue alterations and enhances CAT activity on gills in a dose-effect manner.
VIII
Acknowledgements
O espaço limitado desta secção de agradecimentos, seguramente, não me permite agradecer, como devia, a todas as pessoas que, ao longo do meu Mestrado integrado em Ciências Farmacêuticas me ajudaram, direta ou indiretamente, a cumprir todos os meus objetivos e a finalizar mais esta etapa da minha formação académica.
Desta forma, deixo algumas palavras sentidas e profundas, agradecendo e reconhecendo toda a ajuda recebida.
Ao meu Orientador Prof. Doutor Alberto Teodorico Correia, agradeço desde já pelo privilégio que foi ter efetuado a minha tese no CIIMAR (Centro Interdisciplinar de Investigação Marinha e Ambiental). Pela orientação e apoio incondicionais que muito elevaram os meus conhecimentos científicos e, sem dúvida me ajudaram a ultrapassar todas as dificuldades. Agradeço por esta oportunidade, por ter acreditado na minha palavra que iria cumprir os prazos e tudo o que me propôs assim como pela responsabilidade incutida em mim em todas as fases da tese. Agradeço também pela amabilidade, amizade e boa disposição em todos os momentos. Agradeço pela oportunidade de ter trabalhado lado a lado com os alunos que o Professor auxiliava, Diogo Martins e Cláudia Moreira, obrigada a todos.
À minha Co-Orientadora Prof. Doutora Sara Antunes o meu sincero agradecimento pela co-orientação nesta tese. Muito obrigada pela disponibilidade, e profissionalismo demonstrado. Agradeço também pela amabilidade, amizade e boa disposição em todos os momentos. Um agradecimento e reconhecimento sincero da sua ajuda e pela disponibilidade da Faculdade de Ciências do Porto, que contribuiu para realização desta tese
Como não posso deixar de referir, um obrigada muito especial e sincero para a aluna de doutoramento Sara Rodrigues, que foi incansável em todas as minhas dúvidas, com uma total disponibilidade para comigo. Obrigada Sara, o teu apoio foi determinante para a conclusão desta tese.
IX
da minha vida. Um obrigado especial à minha avó e ao meu padrinho porque sempre me ajudaram quando necessitei. Não posso deixar de agradecer à Márcia, a minha segunda mãe, que sempre me disse o que precisava ouvir, e não o que queria ouvir. Obrigada a todos por todas as vezes que estava cansada e foram a minha almofada, obrigada por me ajudarem a completar esta fase. Obrigada por estarem presentes quando estive doente mas acima de tudo por se manterem na saúde. Espero que esta etapa, que agora termino, possa, de alguma forma, retribuir e compensar todo o carinho, apoio e dedicação que me ofereceram constantemente. A vocês, dedico todo este trabalho.
Segundo Albert Einstein “A ciência sem a religião é manca, a religião sem a ciência é cega” por isso agradeço a Deus porque a Ele devo tudo o que sou, tudo o que tenho e tudo o que um dia terei.
X
CONTENTS
Resumo ... VI Abstract ... VII Acknowledgements ... VIII LIST OF TABLES ... XII LIST OF FIGURES ... XII LIST OF ABBREVIATIONS AND ACRONYMS ... XIII
1. INTRODUCTION ... 1
2. MATERIALS AND METHODS ... 8
2.1. Fish acquisition and quarantine ... 8
2.1.1. Study organism: Oncorhynchus mykiss... 8
2.1.2. Nanoparticle characterization ... 8
2.1.3. Experimental design: Acute exposure ... 8
2.1.4. Tissues homogenization ... 9
2.2. Biochemical assessments: ... 10
2.2.1. Na+/K+- ATPase activity ... 10
2.2.2. Glutathione S-transferase activity ... 11
2.2.3. Catalase activity... 12
2.2.4. Thiobarbituric Acid Reaction Substance quantifications ... 12
2.3. Genotoxicity evaluation: Comet assay ... 13
2.4. Histological assessment ... 15
2.4.1. Gills Semi-Qualitative Assessment ... 16
2.4.2. Gills Quantitative Assessment ... 17
2.5. Statistical analysis ... 17
3. RESULTS ... 18
3.1. Biomarkers evaluation ... 18
3.1.1. Na+ K+- ATPase activity ... 18
3.1.2. Glutathione S-transferase activity ... 18
3.1.3. Catalase activity... 19
3.1.4. TBARS quantifications ... 20
4. Genotoxicity ... 20
5. Histological alterations ... 21
XI
5.2. Gills Quantitative Assessment ... 22
6. DISCUSSION ... 26
6.1. Biomarkers evaluation ... 26
6.1.1. Na+/K+-ATPase activity ... 26
6.1.2. Glutathione S-transferase ... 26
6.1.3. Catalase activity... 27
6.1.4. TBARS quantification ... 27
6.2. Genotoxicity evaluation ... 27
6.3. Histological alterations ... 28
7. CONCLUSIONS ... 30
XII
LIST OF TABLES
Table 1: Importance factor to the histological evaluation ... 5
LIST OF FIGURES
Figure 1: Blades with the minigels ... 14 Figure 2: Classes of the comets obtained by the SSGE. They represent classes 0-4 as used for visual scoring ... 15 Figure 3: Rainbow Trout Gill from fish 1 CC 1; 20.02.2015; HE x40; 50µm) SLL (secondary lamellar length); SLW (secondary lamellar width); ID (interlamellar
distance) and BET (basal epithelial thickness) ... 17 Figure 4: Na+/K+-ATPase activity (µmol/mg protein-1/h-1). CC (Control
concentration); 0.25 (Low Concentration (LC)), 2.50 (Medium Concentration (MC)), 25.0 (High Concentration (HC)). ... 18 Figure 6: CAT activity (μmol.min-1.mg-1 protein). CC (Control concentration); 0.25 (Low Concentration (LC)), 2.50 (Medium Concentration (MC)), 25.0 (High
Concentration (HC)). ... 19 Figure 7: TBARS quantification (nmol mg protein-1). CC (Control concentration); 0.25 (Low Concentration (LC)), 2.50 (Medium Concentration (MC)), 25.0 (High
Concentration (HC)). ... 20 Figure 9: Gills Semi-Qualitative Assessment. CC (Control concentration); 0.25 (Low Concentration (LC)), 2.50 (Medium Concentration (MC)), 25.0 (High Concentration (HC)). ... 22 Figure 10: Gills quantative assessment (BET, ID, SLL and SLW). CC (Control
concentration); 0.25 (Low Concentration (LC)), 2.50 (Medium Concentration (MC)), 25.0 (High Concentration (HC)). ... 23 Figure 13: Aneurysm (black arrow) and hyperplasia of the epithelium (white arrow) from High Concentration 1; Hematoxylin-Gil; x40 magnification; ... 24 Figure 12: Aneurysm (white arrow) from Low Concentration 2; Hematoxylin-Gill; x40 magnification ... 24 Figure 15: Capillary dilatation and Lamellar fusion (circle), Hyperplasia of the mucosal cells (black arrow) and Hyperplasia of the Epithelium (white arrow from High
XIII
LIST OF ABBREVIATIONS AND ACRONYMS
ADP Adenosine diphosphate
ATP Adenosine triphosphate
BET Basal Epithelial Thickness
CAT Catalase
CDNB 1-Chloro-2,4-dinitrobenzene
Ce O2 Cerium dioxide
CeO2 NPs Cerium dioxide Nanoparticles
CuO Copper oxide
CuSO4 Copper sulphate
DNA Deoxyribonucleic Acid
EC50 Effective Concentrations
EtBr Ethidium bromide
GDI Genetic Damage Index
GPI Gills Pathology Index
GST Glutathione S-Transferase
H2O2 Hydrogen Peroxide
HC Higher Concentration
HLA Human Leukocyte Antigen
IB Imidazole Buffer
ID Interlamellar Distance
LC Low Concentration
LC50 Lethal Concentrations
LDH Lactic Dehydrogenase
LDH Lactate Dehydrogenase
LMPA Loop-mediated isothermal amplification
MC Medium Concentration
NADH Nicotinamide Adenine Dinucleotide
NAT2 Arylamine N-acetyltransferase
NPs Nanoparticles
PAGE Secondary lamellae available for Gas Exchange
PEP Phosphoenolpyruvate
PK Pyruvate Kinase
SiO2 Silicon dioxide
SLL Secondary Lamellar Length
SLW Secondary Lamellar Width
SSGE Single cell alkaline gel electrophoresis TBARS Thiobarbituric Acid Reactive Substances
1
1.
INTRODUCTION
Nanotechnology is defined as the production and application of structures,
devices and systems by controlling shape and size at the nanometer scale (Park et al., 2007). Due to their small size, less than 100 nm, nanoparticles (NPs) display greater specific surface areas and energies; quantum related effects and generally increased surface reactivity comparatively to the corresponding conventional forms, leading to immeasurably different properties and applications (Park et al., 2007; Gaiser et al., 2009). Is one of the fastest-growing fields today and it will represent a projected 20-30 billion dollar market by 2015 (Arnold et al., 2013). The nanotechnology industry has experienced a rapid growth, and its applications include products such as paints, cosmetics, medicines, foods, sunscreens, catalysts. The general public is already exposed to a variety of consumer products containing NPs like sunscreens and cosmetic products containing TiO2 (titanium dioxide), electronic devices, medical diagnosis
devices (Park et al., 2007; Tiede et al., 2009) and even food (Tiede et al., 2009; Sekhon, 2010).
Metal oxide nanoparticles, in particular, have multiple applications in different fields such as industrial, electrical, pharmaceutical, and biomedical ones because of their exceptional physicochemical properties paralleled to bulk chemicals (Nel et al., 2009). The cerium dioxide metal nanoparticles (CeO2 NPs) or nanoceria, are one of the
2
elements through oxidation, forming CeO2, because of its distinctive stability in
tetravalent state (Winkler, 2002).
It is important to address the issues regarding the NPs potential impacts on human and environmental health, as the nanotechnology industry grows. The increasing world-wide use of CeO2 NPs, leads to the necessity of conducting ecotoxicological
studies to assess the potential harmful of these nanoparticles in the environment, namely in the aquatic compartiment (Van Hoecke et al., 2009). CeO2 NPs can be released into
the waste waters and to the atmosphere being distributed broadly in the aquatic environment and causing damages to the living organisms (Gaiser et al., 2009). Currently the CeO2 NPs are on the list of the substances that the Organization for
Economic Co-operation and Development (OECD) consider to be priority to test (OECD, 2010).
At present there is limited information about the toxicity of CeO2 NPs in vivo
systems. A few organisms, namely crustaceans and fish, have been experimentally exposed to sub-lethal concentrations of CeO2 NPs. Pseudokirchneriella subcapitata, a
unicellular alga, revealed chronic toxicity and with 10% of the population showed algal growth inhibition effects at the concentrations of 2.6-5.4 mg/L CeO2. However no
toxicity was observed in Danio rerio embryos following an acute exposure to CeO2 NPs
up to test concentrations of 1000, 5000, and 200 mg/L (Van Hoecke et al., 2009). Exposed D. rerio adults to CeO2NPs via water and diet resulted in significant CeO2 NPs
uptake in the liver of the D. rerio exposed to the contaminant and it is likely that this resulted in limited bioavailability of the unmodified metal oxide NPs in fish (Johnston et al., 2010). The toxic potential of CeO2 NPs were investigated in two in vivo systems, D.
rerio and C. elegans, employing both wild type and genetically deficient C. elegans strains to explore the role of oxidative stress in CeO2 NP toxicity in vivo (Das et al.
2007). Exposed Caenorhabditis elegans to CeO2 NPs at the concentrations of 2.5, 5.0,
12.5, 25.0, 62.5 and 93.8 mg/L for three days exhibited a decreased growth in wild-types nematodes at all dosing levels (Arnold et al., 2013). Jun et al. (2013) tested multiple biomarkers in Carassius auratus, freshwater fish, at the concentrations of 20, 40, 80, 160, and 320 mg/L of copper oxide (CuO), zinc oxide (ZnO) and CeO2 NPs in 4
3
The chemical water pollution plays a primary role in destroying ecosystems (Ayas et al., 2007). The environment is continuously overloaded with foreign organic chemicals (xenobiotics). The presence of a xenobiotic compound on the aquatic ecosystem alone does not indicate distressing effects. However, conjoint external levels of exposure, internal levels of tissue contamination and early adverse effects dictates the end result (Oost et al., 2003). Water pollution can cause different changes in fish, ranging from biochemical alterations in single cells up to changes in whole populations. Thus, the presence of those changes is a suitable indicator of the environmental pollution (Bernet et al., 1999; Ayas et al., 2007). It is possible to monitor pollutant concentrations in the tissues of the exposed organisms and to record the biological responses induced by xenobiotics using biomarkers (Oost et al., 2003; Ayas et al., 2007). The concept of biomarkers or ´bioindicator` and ´ecological indicator` was established in the 1990s (Bernet et al., 1999; Oost et al., 2003). They are defined as the measurements in body fluids, cells or tissues indicating biochemical or cellular modifications due to the incidence and magnitude of toxicants, or of host response (NRC, 1987). Biomarkers raise the possibility of determining where an organism is affected and offer a warning sign, making early detection of diseases possible.
According to Oost et al. (2003) and NRC (1987), the term biomarker may be divided into: biomarker of exposure; response or toxic effect; and susceptibility. The biomarkers assessment only includes the biomarkers of exposure defined was the detection and measurement of an exogenous substance, its metabolite or the product of an interaction between a xenobiotic agent and some target molecule or cell that is measured in a compartment within an organism [examples: Glutathione S-transferase (GST), CAT, deoxyribonucleic acid (DNA)]. They should be quantitative, sensitive, non-invasive, specific, and easily measurable, relate to the biochemical mechanism and work at realistic doses (Depledge, 1994; Timbrell, 1998).
Na+/K+- ATPase activity is a biomarker that can be evaluate the effects on the osmoregulation. The basic reaction of the assay is as follows:
ATP ADP + Pi Na+/K+- ATPase
4
Pyruvate + NADH lactate + NAD Lactate dehydrogenase
Thus, the production of ADP in the presence of Na+/K+- ATPase results in an equimolar disappearance of NADH. To obtain the µmoles ADP/mg protein/hour on each sample, it is necessary to calculate the total protein and subtract.
The glutathione transferases are a group of related enzymes which catalyze the conjugation of glutathione with various electrophilic compounds.Catalase is an intracellular enzyme that has two functions. Firstly, the decomposition of the H2O2 (hydrogen peroxide) and the oxidation of the hydrogen donor (methanol, formic acid and phenols) and secondly, the peroxide consumption (peroxidic activity).
The hydrogen peroxide enzymatic decomposition occurs according to a 1st reaction (2 H2O2 2H2O + O2), and its speed is proportional to the amount of peroxide present. However, the kinetics of catalase do not follow a normal pattern. On the one hand, it is not possible to saturate the enzyme with the substrate within the possible concentrations (up to 5M H2O2) and on the other hand a rapid inactivation of catalase H2O2 concentrations up to 0.1 M occurs when the complex I active enzyme H2O2 is converted into inactive complexes II or III (Bradford, 1976).
The extent of lipid peroxidation was measured in gills by the quantification of thiobarbituric acid reactive substances (TBARS).
Tissue alterations have/present different consequences to the fish's health. Each reaction pattern can induce several modifications and consequences to the organ's functioning or to its different sections. The classification of the following alterations was performed according to Bernet et al. (1999).
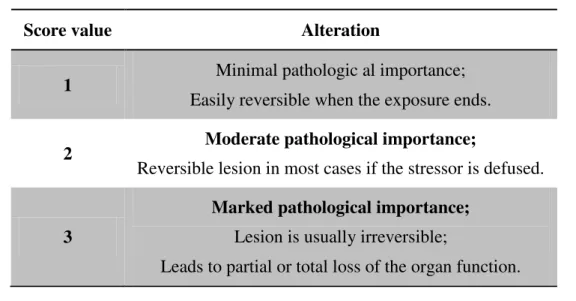
Histological evaluation of elements in the fish after exposure to xenobiotics was conducted according the flowing correlation (Table 1) (Bernet, 1999). An importance factor and a score value (1, 2 or 3) were attributed to each alteration observed and the index was calculated using those values.
5
Table 1: Importance factor to the histological evaluation
Score value Alteration
1 Minimal pathologic al importance; Easily reversible when the exposure ends.
2 Moderate pathological importance;
Reversible lesion in most cases if the stressor is defused.
3
Marked pathological importance; Lesion is usually irreversible;
Leads to partial or total loss of the organ function.
6
processes. Representative lesions are: Hypertrophy (1) or Hyperplasia (2) of the epithelium, chloride cells, pillar cells or mucosal cells. Hypertrophy is an increase in the organ or tissue's volume due to the enlargement of its component cells, which grow in size not in number. Hyperplasia consists in tissue or organ amplification by a superior number of cells but without change in the cells' volume. The inflammation process is frequently associated with belonging to other reactions (e.g. edema). As a result, it is difficult to characterize inflammatory changes taking only one reaction pattern into account. Inflammatory reactions are divided in Exudate (1) (e.g. proteins) and Infiltration (2). Exudate is a large aggregate of cellular debris inclosing a high protein concentration. Infiltration is characterized by the penetration of leucocytes in the blood vessels walls and eventually infiltrating the adjoining tissue. Neoplastic or tumors are an uncontrolled multiplication of cells and tissue. Tumors are divided in two classes, benign (2) or malignant (3).
The score value used on each sample to evaluate the lesions was: 0 no observed changes; 2 mild occurrences; 4 moderate occurrences and 6 severe occurrences. Each alteration's incidence was calculated in all the samples. Total Pathology Index (TPI) represents a quantification/quantitative analysis of the general health status based on the histological lesions. (Bernet, 1999; Raskovic, 2010).
Rainbow trout (Oncorhynchus mykiss) is a native fish from the Pacific drainages of North America and belongs to the family of Salmonidae (Walbaum, 1792). It is a greatly adaptable species distributed worldwide (Fornshell, 2002). O. mykiss is a robust fish that is easy to breed; it has a fast development; it is highly tolerant to a varied range of environments and it can be artificially fed (Walbaum, 1792). This species requires a continuous administration of good quality water with high levels of oxygen, and it is sensitive to higher levels of ammonia (NH3), carbon dioxide (CO2), pH and to the
7
Concerning temperature, it influences the dissolved oxygen and ammonia concentrations and the decomposition level of the fecal material accumulated on the bottom of the tank. The adequate water temperature for the rainbow trout is around 9-17°C (Holliman, 2000; Martínez, 2009). With relation to the pH, the trout prefers water with a pH level of 7-7.5.
According to previous information presented, this work aimed to assess the ecotoxicological effects of CeO2 NPs in gills of freshwater fish Oncorhynchus mykiss.
8
2.
MATERIALS AND METHODS
2.1.Fish acquisition and quarantine
2.1.1. Study organism:Oncorhynchus mykiss
O. mykiss juvenile diploid individuals were acquired at a mountain range aquaculture facility (Posto Aquícola do Torno—Marão) in northern Portugal, with the initial size of 6-7 cm. The specimens were transported in oxygen filled plastic bags with cold freshwater until arrival at the laboratory facilities. In the laboratory animals kept in quarantine for 2 months in 500 L tanks, with dechlorinated tap water with continuous aeration, controlled temperature (16 ± 2°C) and the photoperiod was of 12h in the light,
12h in the dark. Fish were fed “ad-libitum” every 48h with commercial pellets. During the quarantine period dead or diseased animals were discarded.
2.1.2. Nanoparticle characterization
The nanoparticle used in this study [Cerium (IV) Oxide (CeO2)] was obtained from Sigma-Aldrich (Schnelldorf, Germany). It is a nanopowder with a cubic crystal structure, particle size of <50 nm, 99.95% trace rare earth metals basis, surface area of 30m2/g (BET), density of 7.13 g/mL at 25°C, bulk density of 0.53 g/cm3. Is a water-insoluble nanoparticle (Gehlhaus et al., 2009) and the toxic concentrations (EC50 and LC50, respectively) tested in bacteria, algae, crustaceans and soil enzymes are >100 mg/L according to Velzeboer et al. (2008).
2.1.3. Experimental design: Acute exposure
A total of 60 individuals of O. mykiss were used in the acute assay. The experimental design was five fish per tank, with three replicates per concentration, including the control (non-exposed) group. Tanks were randomly distributed in the exposure room. Test concentrations used in acute exposure were all sub lethal: 0.25; 2.50 and 25.0 mg/L of cerium dioxide nanoparticles. These concentrations of CeO2 NPs
9
(Hedrick, 2004; Gaiser, et al., 2009) and values already detected in the environment (Tiede, et al., 2009; Felix, et al., 2013 and Dahle, and Arai, 2015).
The fish were exposed to the nanoparticle CeO2 for 96 hours (acute exposure)
according to OECD guidelines (OECD, 1992), using a semi-continuous exposure regime (when 80% water change in the third day and a re-dosing after the change). Each tank had a circulating water pump (water-insoluble nanoparticle) to re-suspend the nanopowder in the water (treatments 0.25; 2.50 and 25.0 mg/L) on the days of the contaminant exposure.
For monitoring water quality along of the exposure period, water samples were collected regularly for analysis (total ammonia and nitrites). In situ, physical and chemical parameters (dissolved oxygen, pH and temperature) were also measured using the Multi Probe System YSI 556 MPS. Total ammonia and total nitrites were measured using the Palintest Photometer YSI (520 nm for the total nitrites and 640 nm for the total ammonia). Mean values during the exposure values were (means ± S.E.): pH, 6.12±0.03; total ammonia, 0.96±0.06 mg/L; dissolved oxygen, 14.23±0.84 mg/L; total nitrites, 0.20±0.04 mg/L and temperature 14.89±0.35 °C.
After the exposure period (96h) the fish were immediately anesthetized with by immersion in an ice-cold (4°C) water bath and sacrificed (Wilson et al., 2009), collected the gills.
2.1.4. Tissues homogenization
10 2.2.Biochemical assessments:
The stored aliquots of gills were analyzed regarding Na+/K+-ATPase activity, thiobarbituric acid reactive substances (TBARS), Glutathione S-Transferase (GST) and Catalase activity (CAT). For biochemical analysis (GST, CAT and TBARS) gills were homogenized in 2 mL of homogenization buffer (200 mM, pH = 7.0 with Triton X-100 0.1%) and centrifuged at 14000 g for 10 min at 4ºC
2.2.1. Na+/K+- ATPase activity
The Na+/K+-ATPase activity test was performed according to the microplate method of McCormick (1993) and absorbance was read at 340 nm (Gen5 2.00).
The salt solution (Imidazole 50 mM, NaCl 189 mM, MgCl2 10.5 mM, KCl 42
mm at pH 7.5 adjusted with HCl) should be made prior to the onset of tissue homogenization and may be stored at 4°C. The assay mixture reagents are: Imidazole
Buffer (IB) 50 mM at pH 7.5 adjusted with HCl, Phosphoenolpyruvate (PEP) 2.8 mM, Nicotinamide Adenine Dinucleotide (NADH) 0.22 mM, Adenosine triphosphate (ATP) 0.7 mM, Lactic Dehydrogenase (LDH) 4 U/mL, Pyruvate Kinase (PK) 5 U/mL, Adenosine diphosphate (ADP) 4 mM and Oubain 0.7 mM. The enzymes (PK and LDH) were spun for 8 minutes at 12000 g at 4°C to obtain a distinctive pellet.
11
mixtures, two wells with Oubain and two with the non-Oubain assay mixture per sample. These solution mixtures were brought to the assay at the temperature of 25°C (because of most teolosts' thermal limits) with a water bath just prior to use. The enzymatic activity was determined by measuring the absorbance at 340 nm at 25ºC in thirty seconds intervals for 10 minutes using a microplate reader (BioTek Synergy HT). When first setting up the assay, run and NADH standard curve. The slope should be approximately 20 mOD units/nmole. The Bicinchoninic Acid Assay or BCA Protein Assay is an endpoint assay that determines the total concentration of protein in a solution at a wavelength of 550 nm. The assay was made by pipetting, 10 µL of each standard in quadruplicate (25%, 50%, 75% and 100% of BCA), sample (in triplicate) and blank solution was added to the proper wells. Afterwards, 300 µL of Bradford reagent were added to each well. Mix samples for 10 minutes.
2.2.2. Glutathione S-transferase activity
Glutathione S-transferase (GST) activity is an enzymatic assay and it was conducted according to the method from Habig et al., (1974) and Ezeji et al., (2012) adapted to microplate with a wavelength of 340 nm. GST catalyzes the conjugation reaction of the glutathione with the 1-Chloro-2,4-dinitrobenzene (CDNB) substrate, forming a thioether (= 9,6 mM-1cm-1) which can be monitored by the increase in the absorbance at 340 nm using a microplate reader (Thermo Scientific, model Multiskan GO, version 1.00.40, with Skanlt Software 3.2). The reaction solution containing phosphate buffer (0.1 M K2HPO4, K2HPO4.12H2O, pH 6.5), glutathione solution
12 2.2.3. Catalase activity
Catalase activity is determined using a method that monitors the H2O2 decomposition at 240 nm using a microplate reader (Thermo Scientific, model Multiskan GO, version 1.00.40, with Skanlt Software 3.2) according to Góth (1991) (ε 240 = 0.00394 ± 0.0002 liters mmol-1 mm-1). The difference in absorbance (Δ 240) per time unit is a measure of catalase activity. First an initial dilution 1:50 of the centrifuged sample was made with 20 µL sample + 980 µL Phosphate Buffer (50 mM KH2PO4 and K2HPO4 in ultrapure water, pH 7.0). To perform the enzymatic assay, 200 µL of H2O2 solution and 400 µL of supernatant (diluted and centrifuged) were added. The blank (e.g. water) contained 200 µL of phosphate buffer and 400 µL of supernatant. The enzymatic assay was assessed/evaluated by the decrease in the absorbance at 240nm for 5 minutes. The CAT activity was expressed in μmol.min-1.mg-1 protein.
2.2.4. Thiobarbituric Acid Reaction Substance quantifications
Thiobarbituric Acid Reactive Substance (TBARS) was determined by lipid peroxidation according to Camejo et al., (1998) and Bouskill et al., (2006). This
methodology is based on the reaction of compounds such as malondialdehyde (formed by degradation of membrane lipids by free radical attack) with thiobarbituric acid (TBA) (Buege and Aust 1978).The assay involves adding 200 µL of centrifuged sample/blank (Phosphate Buffer 50 mM, pH 7.0) (5minutes) and 400 µL of trichloroacetic acid solution 10%. Centrifuge at 10000 g for 20 seconds. To 500 µL of supernatant add 500 µL of thiobarbituric acid 1%. Place in boiling bath for 10 minutes. Let it cool down and read the absorbance at 535 nm on a microplate reader (Thermo Scientific, model Multiskan GO, version 1.00.40, with Skanlt Software 3.2). All data from the assay were normalized per nmol/mg protein. The calculations were performed according to the following equation:
A = ε * b * C (A abs = 535 nm, b = 1 cm and C the concentration in M)
13 2.2.5 Protein content
The final quantification of total proteins was performed by the Bradford method (Bradford, 1976). This method involves the binding of a dye (Bradford reagent – Bradford Biorad) to the total proteins, yielding a colored and stable complex that can be quantified at 595 nm.
2.3.Genotoxicity evaluation: Comet assay
The whole procedure to evaluate the genotoxicity of the rainbow trout gills was adapted from the protocol described in Collins, 2004 and Lorenzo, 2013. This methodology evaluates the index of genotoxic damage - GDI. The GDI is calculated through a visual assessment and classification of the comets (Collins, 2004). The procedure should be made without light influence (preferably in the dark) and at 4°C. The sample preparation and the positive control are made through a cell suspension, using the second gill arch and washing with phosphate buffer solution - PBS (2,7 mM KCl, 1,5 mM KH2PO4, 0,14 M NaCl, 8,18 g 2 mM Na2HPO4.12H2O). To prepare the
samples, place the tissue in a Petri dish with 2 mL of PBS and make 4 or 5 cuts to obtain a cell suspension. Place 1.5 mL in an eppendorf, centrifuge at 200 g during 5 min at 4°C. Discard the supernatant and make up the eppendorf with 1 mL of PBS. Centrifuge again at 200 g during 5 min at 4°C. Discard ~980µL of supernatant and add to the remaining 20µL, 140µL of loop-mediated isothermal amplification (LMPA) at 37°C. The positive control is made with H2O2 using a suspension of gill cells. In an
eppendorf put 991.3µL of PBS with the suspension of gills cells and add 5.7 µL H2O2
14
The next procedure is cell lysis. Place the slides in a lysis solution (0.2 M NaOH, 100 mM Na2.EDTA.2H2O, 100 mM, 10 mM TRIS, 2.5 M NaCl and on the day
add 1% Triton X-100 and 10 % DMSO), for 1h-24h at 4°C. Following this step is the alkaline incubation (strand break). Place the slides in an electrophoresis solution (0.3M NAOH, 1 Mm Na2.EDTA; pH>13) for 20 minutes at 4°C and keep it in the dark. The
electrophoresis is carried out at 0.8V/cm, 300MA for 30 minutes at 4°C. After electrophoresis, slides were neutralized and washed 3 times with PBS, to obtain a neutral pH. Then they were washed with distilled water for 15 minutes each. (PBS 15 min and 15 min H2O). The dehydration of the minigels was made by adding 10 minutes
in 70% alcohol and then 10 minutes in 100% ethanol. Keep in the dark during the dehydration. Wash the slides with cold water for 10 minutes. To color the slides, place them in a box with a grid and stained with 0.01 mg/ml ethidium bromide (EtBr) for 20 minutes, using a Pasteur pipette, fully covering the mini-gels. Proceed to washing with cold distilled water for 10 minutes. Leave to dry at room temperature, but protected from light (box).
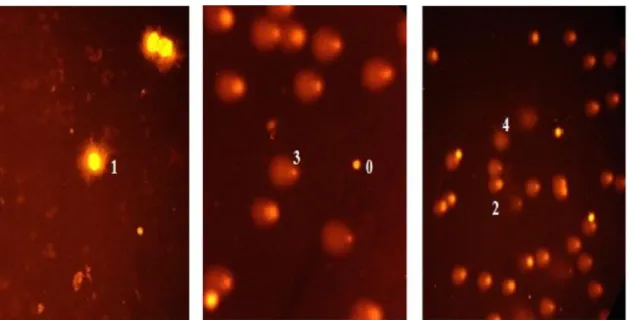
On the day of the analysis, place 1 drop of distilled water on top of each slide, and cover with a coverslip. The analysis of the slides was made using the LAS Advanced Florescence with a color camera DFC340FX and the LAS-AF software. The fluorescence microscope is equipped with an excitation filter of 510-560 nm and a barrier filter of 590 nm. For each sample 100 comets were analyzed (50 comets by minigel), based on a visual assessment system and on the 5 recognizable comet classes. Class 0 (no damage, no visible tail) to class 4 (almost the entire DNA is in the tail and insignificant in the head) (Illustrated in the Fig. 2). Each comet is given a value according to the class in which it is placed (Collins, 2004).
15
The interpretation of the results is made by calculating the Genetic Damage Index (GDI). The score ranges from 0 to 400 arbitrary units.
2.4.Histological assessment
The chemical fixation of gills was performed with a Bouin Solution for 24 hours. In this process the biological tissues are preserved from decomposition or unwanted change, and any biochemical reaction stops. Then the decalcification process in the mineralized structures was executed, using a decalcification solution for 24 hours. The next step was dehydration. Before the inclusion of the material in the paraffin, all the water content should be removed. This process is carried out by immersing the tissue blocks in increasing concentrations of ethanol: 70% ethanol (1h), 80% ethanol (1h), 90% ethanol (1h) and 100% ethanol (1h). This way tissue retraction or irreversible cell structural damage can be avoided. Diaphanization constitutes the infiltration of the tissue by a solvent which is paraffin. Paraffin does not mix with water or ethanol, therefore these should be completely removed, using xylene I (1h) and then xylene II
Genetic damage index (GDI) = (percentage of cells in class 0 x 0) + (percentage of cells in class 1 x 1) + (percentage of cells in class 2 x 2) + (percentage of cells in
class 3 x 3) + (percentage of cells in class 4 x 4)
0
16
(1h), so that the paraffin can effectively penetrate into the tissue on the next step. The impregnation in paraffin's purpose is to completely eliminate the xylene contained in the biological material and the complete penetration of the paraffin in the voids left by the water and fat that existed in the tissues. This process is essential to prepare the material for the cuts. First the tissue blocks are placed in Paraffin I (56-58°C for 1h), then Paraffin II (56-58°C for 1h), and Paraffin III (56-58°C left overnight). On the next day the tissue blocks are incorporated in a metal container with Paraffin IV (56-58°C). When the Paraffin solidifies it forms a block, containing the biological tissue ready to cut using a Microtome Reichert-Jung 2030 (5-8µm of thickness). After this process it is possible to obtain slices with the biological material ready to be analyzed. The slice is fixed with distilled water to a histology slide and stays overnight in an oven at 37°C.
Prior to the coloration process (Fig. 8) the deparaffinization with xylene (10 minutes) is carried out to remove the paraffin from the cuts. After that comes the rehydration in 100% ethanol (2 minutes), 90% ethanol (2 minutes), 80% ethanol (2 minutes), 70% ethanol (2 minutes) and distillated water (5 minutes). The coloration process starts with Hematoxylin-Gill (2 minutes), HCL 0.1% (2 seconds), Eosin 1% (2 minutes), Running water (10 minutes) 70% ethanol (2 seconds), 80% ethanol (1 minute), 90% ethanol (1 minute), 100% ethanol (1 minute) and xylene (5 minutes). The assembling was carried out with DPX (room temperature) and the drying took place overnight.
2.4.1. Gills Semi-Qualitative Assessment
17 2.4.2. Gills Quantitative Assessment
Photomicrographs of the gills tissues were taken arbitrarily under the magnification (40) (Olympus CX41) for the five individual gills per block. Each individual's filaments appearing in the photomicrograph (Fig. 3) were measured for: secondary lamellar length (SLL) and width (SLW), interlamellar distance (ID), and basal epithelial thickness (BET). The secondary lamellar length is essential to the gas exchanges in fish gills. The measurings were made in three zones: central, distal and proximal. The percentage of secondary lamellae available for gas exchange (PAGE) was averaged for each filament of an individual and calculated according to the following equation (Nero, et al., 2006):
( ) ( )( )
Figure 3: Rainbow Trout Gill from Control concentration 1; Hematoxylin-Gill; x40 magnification) SLL (secondary lamellar length); SLW (secondary lamellar width); ID (interlamellar distance) and BET (basal epithelial thickness)
2.5.Statistical analysis
After testing for normality and homogeneity of variances, data were compared by one-way analysis of variance, followed (if needed) by a Dunnett multi-comparison test to discriminate differences of treatments in relation to the control treatments. The
18 0,100 0,200 0,300 0,400 0,500 0,600 0,700 0,800 0,900 1,000 1,100 1,200
CC 0.25 2.50 25.0
N a+ /K + A TPas e (µ m o l/ m g p ro te in -1/h -1)
CeO2 concentrations (mg/L)
standard error. Statistical analyses were performed with the software SPSS IBM Statistics v.19.0 (Systal Software).
3.
RESULTS
3.1. Biomarkers evaluation 3.1.1. Na+ K+- ATPase activity
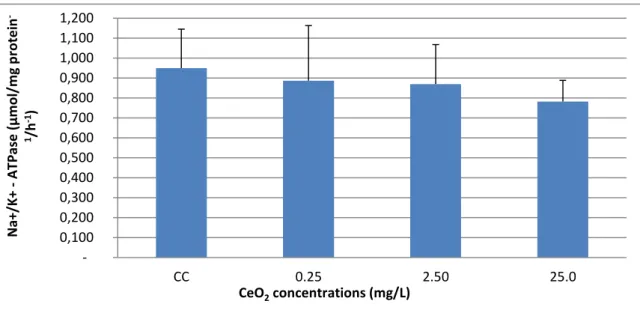
Na+/K+-ATPase activity values are presented at the figure 4. There are no significant differences in the activities between experimental groups (F [3, 45] = 0.157;
p<0.925).
Figure 4: Na+/K+-ATPase activity (µmol/mg protein-1/h-1). CC (Control concentration); 0.25 (Low Concentration (LC)), 2.50 (Medium Concentration (MC)), 25.0 (High Concentration (HC)).
3.1.2. Glutathione S-transferase activity
The GST activity values are presented at figure 5. There are no significant differences in the GST values between experimental groups and control (F [3, 45] = 4.064;
19 0,0000 0,0002 0,0004 0,0006 0,0008 0,0010 0,0012 0,0014 0,0016
CC 0.25 2.50 25.0
To ta l g lu ta th io n e ( μ m o l. m in -1.m g
-1 p
ro
te
in
)
CeO2 concentrations (mg/L
)
Figure 5: Total glutathione (μmol.min-1.mg-1 protein). CC (Control concentration); 0.25 (Low Concentration (LC)), 2.50 (Medium Concentration (MC)), 25.0 (High Concentration (HC)).
3.1.3. Catalase activity
The CAT activity values are shown at figure 6. A significant increase of CAT activity was observed only for the highest concentration tested (25.0 mg/L of CeO2) (F
[3, 45] = 30.673; p<0.001).
Figure 6: CAT activity (μmol.min-1.mg-1 protein). CC (Control concentration); 0.25 (Low Concentration (LC)), 2.50 (Medium Concentration (MC)), 25.0 (High Concentration (HC)).
20 0,0000
0,1000 0,2000 0,3000 0,4000 0,5000 0,6000 0,7000 0,8000 0,9000
CC 0.25 2.50 25.0
T
B
ARS
(nm
o
l
m
g
pro
tein
-1)
CeO2 concentrations (mg/L) 3.1.4. TBARS quantifications
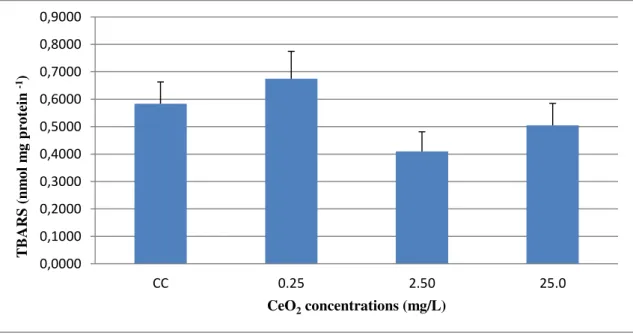
The TBARS quantification values are presented at figure 7. There are no significant differences in the TBARS values between experimental groups and control
(F [3, 56] = 1.834; p<0.151).
Figure 7: TBARS quantification (nmol mg protein-1). CC (Control concentration); 0.25 (Low Concentration
(LC)), 2.50 (Medium Concentration (MC)), 25.0 (High Concentration (HC)).
4.
GenotoxicityThe GDI values are shown at the figure 8. For all the concentrations tested (0.25; 2.50; 25.00 mg/L of CeO2 NPs) a significant increase of GDI was observed (F [3, 56] =
21
Figure 8: Genetic Damage Index. CC (Control concentration); 0.25 (Low Concentration (LC)), 2.50 (Medium Concentration (MC)), 25.0 (High Concentration (HC)).
5.
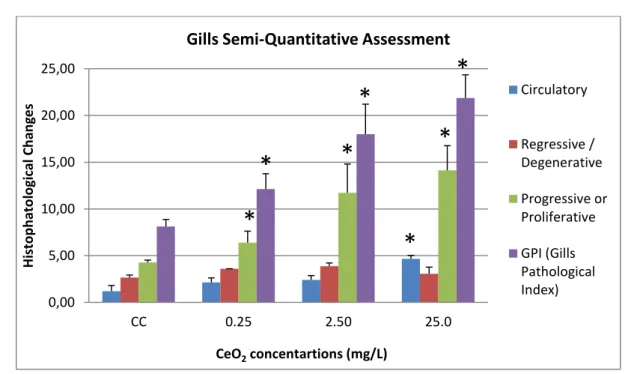
Histological alterations5.1.Gills Semi-Qualitative Assessment
Histopathological semi-qualitative changes of the O. mykiss gills were observed
on 0.25; 2.50 and 25.0 mg/L treatment in all studied parameters (Fig. 9). A significant differences of histological alterations were recorded, namely circulatory (for the highest concentration - 25 mg/L CeO2; F [3, 56] =16.898; p<0.001), progressive or proliferative changes (for all concentrations tested; F[3, 56]=31.997; p<0.001), and Gills Pathological Index (for all concentrations tesed; F[3, 56]=35.999; p<0.001) (Fig. 9).
0 20 40 60 80 100 120 140 160 180 200
Ctl 0,25 2,50 25,0
G
DI
v
a
lues
(
a
rbit
ra
ry
un
it
s)
CeO2 concentrations (mg/l)
*
*
22
Figure 9: Gills Semi-Qualitative Assessment. CC (Control concentration); 0.25 (Low Concentration (LC)), 2.50 (Medium Concentration (MC)), 25.0 (High Concentration (HC)).
5.2.Gills Quantitative Assessment
The values of all the measures acquired are exhibited in the figure 10. There are a significant decrease in BET (F [3, 56] =4.356; p<0.008) values for the concentration of
2.5 mg/L CeO2. Significant decrease was observed in ID values (F [3, 56] = 8.475;
p<0.001), for all concentrations tested. In terms of SLL values a significant decrease
was observed in the last two concentrations tested (F [3, 56] =5.369; p<0.003). No
significant alterations were recorded for SLW parameter (F [3, 56] =0.499; p<0.684).
0,00 5,00 10,00 15,00 20,00 25,00
CC 0.25 2.50 25.0
H isto p h ato lo g ic al Ch an g e s
CeO2 concentartions (mg/L)
Gills Semi-Quantitative Assessment
23
Figure 10: Gills quantative assessment (BET, ID, SLL and SLW). CC (Control concentration); 0.25 (Low Concentration (LC)), 2.50 (Medium Concentration (MC)), 25.0 (High Concentration (HC)).
PAGE's measures (%) acquired from the measures of the mean of the BET and SLL. No significant differences in the PAGE values were observed between groups and control treatment (F [3, 56] =2.620; p<0.060) (Fig. 11).
Figure 11: Gills Quantitative Assessment (PAGE %). CC (Control concentration); 0.25 (Low Concentration (LC)), 2.50 (Medium Concentration (MC)), 25.0 (High Concentration (HC)).
0,00 10,00 20,00 30,00 40,00 50,00 60,00 70,00
CC 0.25 2.50 25.0
P
AG
E
(
%)
CeO2 concentartions (mg/L)
Gills Quantitative Assessment PAGE
*
*
*
24
At the control group circulatory changes were minimal. The circulatory changes increase at the 25.0 mg/L concentration in every treatment. It was possible to observe capillary dilatation (Fig. 14) and aneurysms (Fig. 12, 13). Intercellular edema (Fig. 15) was found in all treatments but with a lower incidence in the 0.25 and 2.5 mg/L and a higher incidence in the 25 mg/L CeO2. Regressive changes, as lamellar fusion (Fig. 14) were constant in all treatments however, epithelial lifting (Fig. 17) was observed at the 0.25 and 2.50 mg/L concentrations. Progressive or Proliferative changes were observed in every treatment, but with a higher incidence at the highest concentrations of CeO2. Epithelial Hyperplasia (Fig. 13, 14) appears in all the fish CeO2 exposure but in different score values. At the 0.25 mg/L concentration it is possible to observe mucous cells Hyperplasia (Fig. 14); Chloride cells Hyperplasia (Fig. 16) is visible at the concentrations of 2.50 mg/L and 25.0 mg/L.
Figure 13: Aneurysm (white arrow) from Low Concentration 2; Hematoxylin-Gill; x40 magnification
Figure 12: Aneurysm (black arrow) and hyperplasia of the epithelium (white arrow) from High Concentration 1; Hematoxylin-Gil; x40 magnification;
Figure 15: Intercellular Edema (Circle) from High Concentration 2; Hematoxylin-Gill; x40 magnification
25 Figure 17: Lifting of the Epithelium (circle) from Low Concentration 3; Hematoxylin-Gill; x40 magnification
26
6.
DISCUSSION
6.1.Biomarkers evaluation
6.1.1. Na+/K+-ATPase activity
In terms of Na+/K+-ATPase activity there were no significant differences between experimental groups. Gill Na+/K+-ATPase is a membrane-bound enzyme that catalyzes the active Na+ and K+ transport in animals, providing a dynamic force in the gill epithelium (Torre et al., 2007). Despite some inhibition of brachial Na+/K+-ATPase activity, there were no major disturbances in osmotic and ionic balance. Jun, et al., 2013 tested multiple biomarkers in Carassius auratus using concentrations of 20, 40, 80, 160, and 320 mg/L of CuO, ZnO and CeO2 NPs, after 4 days of exposure. In this study it was
possible to observe a significant increase of Na+/K+-ATPase activity in gills of C. auratus at concentration of copper oxide, zinc oxide and cerium dioxide NPs at 80 mg/L. Ramsden, et al., 2009 tested Na+/K+-ATPase activities in the gill and intestine and conclude that were unaffected by TiO2 exposure. Shrimpton and McCormick
(1999) tested in vitro gill of juvenile O. mykiss and conclude that Na+/K+-ATPase
activity was significantly affected by cortisol concentration in the incubation medium
(p<0.001).
6.1.2. Glutathione S-transferase
The conjugation of electrophilic compounds (or phase I metabolites) with GSH is catalyzed by the glutathione S-transferase (GST), a multigene superfamily of dimeric, multifunctional, primarily soluble enzymes. Separately from their essential functions in intracellular transport (heme, bilirubin and bile acids) and the biosynthesis of
leukotriene’s and prostaglandins, an important role for GSTs is obviously defense
against oxidative damage and peroxidative products of DNA and lipids. Based on the results obtained it was not possible to conclude that O. mykiss gills were significantly affected at the GST levels. Ramsden, et al., 2009 used 10, or 100 mg kg-1 TiO2 NPs
diets for 8 weeks and tested total glutathione (GSH) levels in the gill, intestine, liver and
27 6.1.3. Catalase activity
Catalase is an intracellular enzyme that decomposition of the H2O2 (hydrogen
peroxide) and is responsible for the oxidation of the hydrogen donor (methanol, formic acid and phenols) or the peroxide consumption (peroxidic activity) (Habig, et al.1974, Jun, et al. 2013). CAT is primarily located in the peroxisomes. Sideways with glutathione peroxidase, is accountable for the reduction of H2O2 produced from the
metabolism of long chain fatty acids in peroximes (Jun, et al., 2013). CAT activity exhibits a significant increase after acute exposure at 25 mg/L CeO2. These results
demonstrate that CeO2 possibly induce an activation of the anti-oxidant response in the
gills by altering the levels of CAT. In the work of Jun, et al., 2013 using Carassius auratus at the concentrations of 20, 40, 80, 160, and 320 mg/L of CuO, ZnO and CeO2
NPs, after 4 days of exposure, metal oxide NPs did not significantly alter liver CAT activity at the lowest concentrations compared to the controls. Exposures of CuO, CuO and ZnO NPs (≥40 mg/L), and CeO2 (≥160 mg/L) significantly inhibited CAT activity,
and the inhibition rates increased in a concentration-dependent manner.
6.1.4. TBARS quantification
The measurement of lipid peroxidation offers another value to compare the potential oxidative stress damage in the gills caused by CeO2 (Oost et al. 2003).
Ramsden, et al., 2009 used 10, or 100 mg kg-1 TiO2 NPs diets for 8 weeks and the O.
mykiss exposed to TiO2 NPs generally showed a decrease in TBARS compared to
controls at the end of the experiment. Significant differences were seen in the gills and intestine of TiO2NP exposed fish at week 8 with maximum decreases of 49% (gill) and
50% (intestine) in the 100 mg kg-1 TiO2 NP treatment compared to the control.
6.2.Genotoxicity evaluation
28
damage are detected in this assay. DNA base composition, oncogene activation, cytogenetic effects also have the potential to be used as biomarkers (Oost et al. 2003). Exposure to CeO2 caused a significant exponential increase of the Genetic Damage
Index (GDI) along concentrations showing a concentration-dependent in brachial GDI. It means that CeO2 caused genotoxic changes i.e., DNA damage in the exposed rainbow
trout’s. Genetic damage can lead to mutations and diseases that can change the future
one species ultimately affecting humans because of the phenomenon of bioaccumulation and biomagnification exposed to this nanoparticle. Lopez-Moreno et al. 2010 tested ZnO and CeO2 NPs on Glycine max, they amplified polymorphic DNA assay and
applied to detect DNA damage and mutations caused by NPs. Results obtained from the exposure of Glycine max to CeO2 NPs show the appearance of four new bands at 2000 mg/L-1 and three new bands at 4000 mg/L-1 treatment. In this study was possible to
demonstrate genotoxic effects from the exposure of Glycine max to CeO2 NPs. Lee et
al. 2009 assess genotoxic and ecotoxic effects of CeO2, silicon dioxide (SiO2) and TiO2
NPs test solutions in freshwater crustacean, D. magna and the larva, Chironomus riparius. CeO2 may have genotoxic effects on D. magna and C. riparius, given that
the DNA strand breaks increased in both species.
6.3.Histological alterations
Histological changes are likely to appear even in sub-lethal doses, in various tissues and organs (Johnson, et al., 1992). The here-obtained results show that exposure at CeO2 caused aneurysms, intercellular edema and capillary dilatation, suggesting some
degree of vascular wall injury in the braquial capillary bed or interruptions of capillary flow. Regressive changes as lamellar fusion and, epithelial lifting were observed the 0.25 and 2.5 mg/L concentrations. Progressive or proliferative changes were observed in every treatment, but with a higher incidence as the CeO2 NP concentration increased.
Epithelial hyperplasia, mucous cells hyperplasia and chloride cells hyperplasia were visible at all concentrations. The decrease in surface area reduces xenobiotic entrance, nonetheless can compromise organ function.
The evaluation of lesions on the rainbow trout gills are biomarkers of environmental contamination affected by the CeO2 NPs (Depledge, 1994). Bairuty et al.
29
(CuSO4) on the O. mykiss organs with the concentration of 20 or 100 µ g/L-1. This study
30
7.
CONCLUSIONS
CeO2 NPs is by far one of the most used cerium compounds, with applications in
various areas as electronics, automotive industry, solar panels for energy, etc. Moreover, this study provides one of the first overviews of organ integrity and physiological effects of CeO2 NPs in rainbow trout. However, little is known about the possible ecotoxicological effects of CeO2 NPs, its bioaccumulation in the environment and the
potential effects on human health.
The low acute toxicity of dispersed CeO2 NPs does not mean that there are no
toxicological concerns. In fact, this study reports an assortment of important sub-lethal effects in rainbow trout subjected to acute exposition inducing lesions in the gills, biochemical disturbances (CAT increase activity) and genotoxicity. The gills are organs responsible for vital functions such as breathing, excretion and accumulation/biotransformation of xenobiotics, therefore, lesions in this organ can dramatically affect the organism survival.
The evaluation of potential impacts of the nanoparticles on human and environmental health has high priority because of its increasing use. In this study, it was possible to demonstrate that the CeO2 NP´s is a nanoparticle that leads to histological,
31
8.
REFERENCES
Arnold, M. C., Badireddy, A. R., Wiesner, M. R., Di Giulio, R. T., Meyer, J. N. (2013). Cerium nanoparticles are more toxic than equimolar bulk cerium oxide in Caenorhabditis elegans. Archival Environmental Contamination Toxicology, 65, pp. 224-233.
Âthova, E. et al. (2004). DNA damage and repair measured in different genomic regions using the comet assay with fluorescent in situ hybridization. Mutagenesis. Volume 19 no. 4, pp. 269-276.
Ayas, Z., Ekmekce, G., Ozmen, M., Yerli, S. V. (2007). Histopathological changes in the livers and kidneys of fish in Sariyar Reservoir, Turkey. Environmental Toxicology and Pharmacology 23, pp. 242-249.
Azqueta, A. (2011). The influence of scoring method on variability in results obtained with the comet assay. UK, Oxford University Press.
Bernet, D., Schmidt, H., Meier, W., Burkhardt-holm, P., Wahli, T. (1999). Histopathology in fish: proposal for a protocol to acess aquatic pollution. Journal of Fish Diseases 22, pp. 25-34.
Bradford, M. M. (1976). A rapid and sensitive method for the quantitation of microgram quantities of protein utilizing the principle of protein-dye binding. Analytical Biochemistry 72, pp. 248-254.
Buege, J. A., Aust, S. D. (1978) Microsomal lipid peroxidation. Methods Enzymol, 52, pp. 302–310.
Bullock, G., Blazer, V., Tsukuda, S., Summerfelt, S. (2000). Toxicity of acidified chitosan for cultured rainbow trout (Oncorhynchus mykiss). Aquaculture 185, pp. 273-280.
Camejo, G., Wallin, B., Enojärvi, M. (1998). Analysis of oxidation and antioxidants using microtiter plates. Free radical ad antioxidant protocols. Methods Molecular Biology, pp. 377-87.
Collins, R. (2004). The comet assay for DNA damage and repair. Molecular Biotechnology Review, Volume 26, pp. 249-261.
32
Das, M., Patil, S., Bhargavaa, N., Kanga, J. F., Riedela, L. M., Sealb, S. et al. (2007) Auto-catalytic ceria nanoparticles offer neuroprotection to adult rat spinal cord neurons. Biomaterials 28(10), pp.1918–1925.
de la Torre, F. C., Salibián, A., Ferrari, L. (2007). Assessment of the pollution impacto n biomarkers of effect of a freshwater fish. Chemosphere. Pp. 1582-1590.
Depledge, M. H., Fossi, M. C. (1994). The role of biomarkers in environmental assessment (2). Invertebrates. Ecotoxicology 3, pp. 161-172.
Eom, H. J., Choi, J. (2009). Oxidative stress of CeO2 nanoparticles via p38–Nrf–2
signaling pathway in human bronchial epithelial cell, Beas-2B. Toxicology Letters, 187(2), pp. 77–83.
Ezeji, E., Anyaloghu, E., Ezejiofor, T., Udensi, U. (2012). Determination of reduced glutathione and glutathione S-transferase of poultry birds exposed to permethrin insecticide. American Journal of Biochemistry 2(3), pp. 21-24.
Federici, G. (2007). Toxicity of titanium dioxide nanoparticles to rainbow trout (Oncorhnynhus mykiss): gill injury, oxidative stress, and other physiological effects. Aquatic Toxicology, 84, pp. 415-430.
Felix, L. et al. (2013). Physicochemical characteristics of polymer-coated metal-oxide nanoparticles and their toxicological effects on zebrafish (Danio rerio) development. Environmental Science and Technology, 47, pp. 6589-6596.
Fornshell, G. (2002). Rainbow trout – Challenges and solutions. Fisheries Science, 10(3, 4), pp. 545-557.
Franke, C., Studinger, G., Berger, G., Bo ¨hling, S., Bruckmann, U., Cohors-Fresenborg, D., Jo ¨hncke, U. (1994). The assessment of bioaccumulation. Chemosphere 29.
Gaiser, B. et al. (2009). Assessing exposure, uptake and toxicity of silver and cerium dioxide nanoparticles from contaminated environments. Environmental Health, 8:S2. Gehlhaus, M. et al. (2009). Toxicology review of cerium oxide and cerium compounds.
U.S. Environmental Protection Agency, CAS no. 1306-38-3.
Góth, L. (1991). A simple method for determination of serum catalase activity and revision of reference range. Clinica Chimica Acta, 196, pp. 143-152.
33
Heckert, EG., Karakoti, AS., Seal, S., Self, WT. (2008). The role of cerium redox state in the SOD mimetic activity of nanoceria. Biomaterials, 29(18), pp. 2705–2709. Hedrick, JB. (2004). Rare earths. Minerals yearbook, Volume 1, Metals and minerals.
US geological survey. US department of the interior, Reston. VA. Available online at: http://minerals.usgs.gov/minerals/pubs/commodity/myb/. [Consulted at 07/02/2015].
Hinton, D.E. (1994). Cells, cellular responses, and their markers in chronic toxicity of
fishes. Aquatic Toxicology; Molecular, Biochemical and Cellular Perspectives.
Lewis Publishers CRC press, pp. 207/240.
Hinton, D.E., Baumann, P.C., Gardner, G.C., Hawkins, W.E., Hendricks, J.D., Murchelano, R.A., Okihiro, M.S. (1992). Histopathologic biomarkers. Biomarkers: Biochemical, Physiological and Histological Markers of Anthropogenic Stress. Lewis Publishers, pp. 155/210.
Holliman, A. (2000). Enfoque veterinário de la cría de la trucha. Acuicultura para veterinarios: producción y clínica de peces. Brown, L. (Ed.), Saragoça: Editorial
Acribia.
Hughes, D. M., Perry, S. F. (1979). Morphometric study of trout gills: a light-microscopic method suitable for the evaluation of pollutant action. The Journal of Experimental Biology, 64, pp. 447-460.
Johnson, L. L. et al. (1992). Chemical contaminants and hepatic lesions in winter flounder (Pleuronects americanus) from the Northeast Coast of the United States. Environmental Science and Technology, 27, pp. 2759-2771.
Johnston, B. D., Scown, T. M., Moger, J., Cumberland, S. A., Linge, K., Van Aerle, R., Jarvis, K., Lead, J. R., Tyler, C. R. (2010). Bioavailability of nanoscale metal oxides TiO2, CeO2, and ZnO to fish. Environmental Science Technology, 44, pp. 1144-1151.
Jun, X., Hai, Z., and Hua, LU. (2013). Effects of selected metal oxide nanoparticles on multiple biomarkers in Carassius auratus. Biomedicine Environmental Science, 26(9), pp. 742-749.
Kiernan, J. A. (2008). Histological and histochemical methods: theory and practice. Histological and histochemical methods. 4th ed. Bloxham.
Kilbourn, BT. (2003). Cerium and cerium compounds. Kirk-Othmer encyclopedia of chemical technology. New York. Available online at:
34
List of manufactured nanomaterials and list of endpoints for phase one of the sponsorship programme for the testing of manufactured nanomaterials: revision. (2010). Organization for Economic Co-operation and Development. Paris. No. 27. Lorenzo, Y. et al. (2013). The comet assay, DNA damage, DNA repair and cytotoxicity:
hedgehogs are note always dead. UK, Oxford University Press.
Martínez, G. A. (2009). Manual básico para el cultivo de trucha Arco Iris (Oncorhynchus mykiss). Manual de capacitación para la participación comunitaria GEMTIES Cuencas Sanas y Modos de Vida Sustentable.
McCormick, S. D. (1993). Methods for non-lethal gill biopsy and measurement of Na+, K+-ATPase activity. Canadian Journal of Fisheries and Aquatic Sciences.
Murray, EP., Tsai, T., Barnett, SA. (1999). A direct-methane fuel cell with a ceria-based anode. Nature, 400(6745), pp. 649-650.
Nel, A. E., Madler, L., Velegol, D., Xia, T., Hoek, E. M., Somasundaran, P., Klaessing, F., Castranova, V., Thompson, M, (20009). Understanding biophycochemical interactions at the nano-bio interface. Nature Mater 8, pp. 543-557.
Nero, V., Farwell, A., Lister, A., Van Der Kraak, G., Lee, L. E. J., Van Meer, T. MacKinnon, M. D., Dixon, D. G. (2006). Gill and liver histopathological changes in yellow perch (Perca flavescens) and goldfish (Carassius auratus) exposed to oil sands process-affected water. Ecotoxicology and Environmental Safety 63, pp. 365-377. NRC: Committee on Biological Markers of the National Research Council. (1987).
Biological markers in environmental health research. Environmental Health Perspectives 74, pp. 3-9.
OECD. (1992). OECD Guidelines for the testing of chemicals. Fish Acute Toxicity Test.
Oncorhynchus mykiss (Walbaum, 1792). Fisheries and Aquaculture Department. Cultured Aquatic Species Information Programme. Food and Agriculture Organization of the United Nations. Available online at:
http://www.fao.org/fishery/culturedspecies/Oncorhynchus_mykiss/en. [Consulted at 03/03/2015].
35
Park, B. et al. (2007). Initial in vitro screening approach to investigate the potential health and environmental hazards of envirox TM – a nanoparticulate cerium oxide diesel fuel additive. Particle and Fibre Toxicology Journal, 4, pp. 12.
Park, EJ., Choi, J., Park, Y-K., Park, K. (2008b). Oxidative stress induced by cerium oxide nanoparticles in cultured BEAS-2B cells. Toxicology, 245(1–2), pp. 90–100. Poleksic, V., Mitrovic-Tutundzic, V. (1994). Fish gills as a monitor of sublethal and
chronic effects of pollution. In: Sublethal and chronic effects of pollutants on freshwater fish. (Ed. By Muller, R., Lloyd, R.). Oxford, pp. 339-352.
Raskovic, B., Poleksic, V., Zivic, I. and Spasic, M. (2010). Histology of carp (Cyprinus Carpio, L.) gills and pond water quatity in semiintensive production. Bulgarian Journal of Agricultural Science, 16(3), pp. 253-262.
Sekhon, B. S. (2010). Food nanotechology – an overview. Nanotechnology, Science and Applications 3, pp. 1-15.
Smith, C., Shaw, B., Handy, R. (2007). Toxicity of single walled carbon nanotubes to rainbow trout, (Oncorhynchus mykiss): Respiratory toxicity, organ pathologies, and other physiological effects. Aquatic Toxicology, 82, pp. 94-109.
Stineman, C. H., Massaro, E. J., Lown, B. A. et al., (1978). Cerium tissue/organ distribution and alterations in open field and exploratory behavior following acute exposure of the mouse to cerium (citrate). Journal of Environmental Pathology, Toxicology and Oncology, 2(2), pp. 553–570.
Tiede, K., Hassellöv, M., Breitbarth, E., Chaudhry, Q,m Boxall, A. (2009). Considerations for environmental fate and ecotoxicity testing to support environmental risk assessments for engineered nanoparticles. Journal of Chromatography A, 1216, pp. 503-509.
Van Hoecke, K. et al. (2009). Fate and effects of ceO2 nanoparticles in aquatic
ecotoxicity tests. Environmental Science and Technology, 43(12), pp. 4537-4546. Velzeboer, I., Hendriks, A. J., Ragas, MJ., Van de Meent, D. (2008). Aquatic
ecotoxicity testes of some nanomaterials. Environmental Toxicity and Chemistry, Vol. 27, No. 9, pp. 1942-1947.
Wang, R., Crozier, PA., Sharma, R., Adams, JB., (2008). Measuring the redox activity of individual catalytic nanoparticles in cerium based oxides. NanoLetters ACS Publications, 8(3), pp. 962–967.
Wilson, J. M, Bunte, R. M, Anthony., J, Carty, A. J. (2009) Evaluation of rapid cooling