IN ST IT U T O D E C IÊ N C IA S B IO M ÉD IC A S A B EL S A LA Z A R FA C U LD A D E D E C IÊ N C IA S
R
afa
ela A
le
xa
nd
ra P
er
dig
ão M
en
de
s. Bio
re
m
ed
iat
io
n fo
r
m
itig
ati
on a
nd r
ec
ov
ery f
ro
m o
il s
pil
l i
nc
id
en
ts
Bio
re
m
ed
iat
io
n f
or m
itig
ati
on a
nd r
ec
ov
ery f
ro
m
oil
spi
ll i
nc
iden
ts
Raf
ae
la
Al
ex
an
dr
a P
erdi
gã
o M
en
de
s
Bioremediation for mitigation and
recovery from oil spill incidents
Rafaela Alexandra Perdigão Mendes
M
2017M
.ICBAS
2017
SE D E AD M IN IS TR AT IV A DISSERTAÇÃO DE MESTRADORAFAELA ALEXANDRA PERDIGÃO MENDES
BIOREMEDIATION FOR MITIGATION AND RECOVERY FROM OIL
SPILL INCIDENTS
Dissertação de Candidatura ao grau de
Mestre em Toxicologia e Contaminação
Ambientais submetida ao Instituto de
Ciências Biomédicas de Abel Salazar da
Universidade do Porto.
Orientador – Doutora Ana Paula Mucha
Categoria – Investigadora auxiliar
Afiliação – Centro Interdisciplinar de
Investigação Marinha e Ambiental (CIIMAR)
Co-orientador – Doutora C. Marisa R.
Almeida
Categoria – Investigadora
Afiliação – Centro Interdisciplinar de
Acknowledgments
First, I would like to thank my supervisor, Ana Paula Mucha, for all the time and dedication given throughout this past year, following every step of the way and being accessible to discuss all my questions and doubts. I also thank for this opportunity to work in petroleum bioremediation at EcoBioTec laboratory.
I would also like to thanks Marisa Almeida for all the help and guidance throughout this work.
To Fátima Carvalho for the availability to help me and elucidate me in some questions of this work. With the guidance of these 3 researchers, this past year’s work allowed me to obtain more knowledge in the area of bioremediation and grow professionally.
I would like to thank my colleagues from EcoBioTec lab, specially to Diogo, Filipa, Inês and Joana, for their help and support given this past year, for always being present to answer some of my doubts, but also for all the sympathy, patience, laughs, craziness and good vibes, throughout this year. I couldn’t have asked for better lab partners, myself.
To my best friend, Mafalda Coutinho, who has been by my side for several years, in the good and bad moments, for her friendship, support, laughter and crazy moments shared throughout these years.
To my parents and sisters, for all the love, support and encouragement in my decisions, who have shaped me to become the person I am today. A special thanks to my father, who passed me his love for nature, during my childhood, which helped to form my love for nature, inspired me to follow biology and aspire to work in environmental protection.
This research was partially supported by the research project SpilLess-First line response to oil spills based on native microorganisms cooperation (EASME/EMFF/2016/1.2.1.4/010) supported by the Executive Agency for Small and Medium-sized Enterprises (EASME) delegated by the European Commission, by the structured Program of R&D&I INNOVMAR - Innovation and Sustainability in the Management and Exploitation of Marine Resources (NORTE-01-0145-FEDER-000035), within the R&D Institution CIIMAR (Interdisciplinary Centre of Marine and Environmental Research), supported by the Northern Regional Operational Programme (NORTE2020), through ERDF, and by the Strategic Funding UID/Multi/04423/2013 through national funds provided by FCT – Foundation for Science and Technology and European Regional Development Fund (ERDF), in the framework of the programme PT2020.
Resumo
Derrames de petróleo provenientes de fontes antropogénicas, representam uma grave ameaça para ambientes marinhos, requerendo, por isso, medidas próprias de mitigação. Há, portanto, uma necessidade de se desenvolver técnicas de remediação mais ecológicas e eficientes para o combate a derrames de petróleo. A biorremediação tem sido considerada uma técnica ecológica e promissora, nomeadamente recorrendo ao uso de microrganismos autóctones.
Tendo isto em conta, o presente trabalho tem como objetivos desenvolver consórcios de estirpes bacterianas autóctones degradadoras de petróleo, otimizar a sua fase de enriquecimento com adição de 4 fontes distintas de carbono e testar a eficiência dos consórcios na degradação de hidrocarbonetos de petróleo em estudos de microcosmos, sob tratamentos de biorremediação diferentes com a possibilidade de serem usados para a remediação de derrames de petróleo.
Para tal, 2 consórcios diferentes foram preparados, cada um constituído por uma mistura de 5 estirpes bacterianas, previamente isoladas de um sedimento intertidal de uma praia (Cabo do Mundo) da costa Noroeste Portuguesa, cultivados em meio Bushnell – Haas (BH) e expostas a petróleo. Estes consórcios foram enriquecidos na presença de diferentes fontes de carbono (petróleo e acetato de sódio). Estas fontes de carbono foram selecionadas em testes de enriquecimento com acetato de sódio, petróleo, uma mistura de hidrocarbonetos aromáticos policíclicos (PAHs) e uma mistura de acetato de sódio com PAHs.
Depois, realizam-se experiências de microcosmos em frascos contendo meio BH e petróleo durante 15 dias, sob 4 tratamentos diferentes: atenuação natural, bioestimulação (com adição dos nutrientes N e P), e uma combinação de bioestimulação com bioaumento autóctone usando consórcios enriquecidos tanto com acetato de sódio como com petróleo. No início e fim da experiência, foram retiradas amostras para estimar a abundância de microrganismos degradadores de petróleo através de um método adaptado do número mais provável e para avaliar a degradação de hidrocarbonetos através da análise das concentrações de hidrocarbonetos totais (TPHs) (por espectrometria de FT/IR). Foi também realizado o isolamento e identificação de estirpes bacterianas degradadoras de hidrocarbonetos, no final da experiência.
O tratamento com o consórcio enriquecido com acetato de sódio provou ser o melhor na degradação de hidrocarbonetos, com abundância elevada de degradadores de hidrocarbonetos e elevada percentagem de remoção de TPHs, tendo sido detetada a
presença no meio das estirpes bacterianas introduzidas do consórcio, no final da experiência.
Este estudo dá uma noção da capacidade natural das comunidades para degradar hidrocarbonetos e da sua aplicabilidade em técnicas de biorremediação que podem ser adotadas em futuros planos de contingência nacionais. Desta forma, será possível atuar local e ecologicamente em resposta a um eventual incidente de derrame de petróleo.
Palavras-chave: Biorremediação, derrames de petróleo, bioaumento autóctone,
Abstract
Oil spills from anthropogenic sources pose a serious threat to marine ecosystems, requiring prompt mitigation measures. There is thus a need for the development of cleaner and more efficient remediation techniques. Bioremediation has proven to be an eco-friendly and promising remediation technique, especially when using autochthonous microorganisms. In this line, we aimed to develop consortia of autochthonous hydrocarbon-degrading bacterial strains, optimize their enrichment process with 4 different carbon sources, and test the efficiency of the consortia to degrade petroleum hydrocarbons in a microcosm experiment under different bioremediation treatments, which could be used for the bioremediation of oil spills.
Thus, two different consortia were prepared, each constituted by a mixture of 5 bacterial strains previously isolated from a sandy beach (Cabo do Mundo) intertidal sediment in the NW Portuguese coast, cultivated in Bushnell – Haas broth (BH) and exposed to petroleum. These consortia were enriched in the presence of two different sources of carbon (petroleum and sodium acetate). These carbon source were selected from previous enrichment tests with sodium acetate, petroleum, a mixture of the polycyclic aromatic hydrocarbons (PAHs) and a mixture of sodium acetate and the PAHs.
Then, microcosm experiments were performed in flasks containing BH medium and petroleum, for 15 days, under four different treatments: natural attenuation, biostimulation (with addition of N and P nutrients), and combination of biostimulation and autochthonous bioaugmentation with consortia either enriched with sodium acetate or with petroleum. Samples were taken at the beginning and end of the experiment to assess hydrocarbon degrading microorganisms through an adapted most probable number method and for analysis of total hydrocarbons (TPHs) concentrations (by FT/IR spectrometry), to evaluate hydrocarbons degradation at the end of the experiment. Isolation and identification of hydrocarbon-degrading bacterial stains was also carried out at the end of the experiment. The treatment with the consortium enriched with sodium acetate performed better for hydrocarbons degradation, with high hydrocarbon-degraders abundance, high TPHs removal percentage and the presence of the introduced bacterial strains consortium in the medium at the end of the experiments.
This study provides an insight into the natural community capacity to degrade hydrocarbons and its potential application in bioremediation techniques that can be adopted in the future in national contingency plans. In this way, it is possible to act locally and ecologically facing an eventual oil spill incident.
Keywords: Bioremediation, oil spills, autochthonous bioaugmentation, bacterial consortia,
Table of contents
Figures and tables index ... i
Chapter 1 ... 1
1. General introduction ... 2
1.1. Oil pollution in marine environments ... 2
1.2. Degradation of hydrocarbons by marine microorganisms ... 5
1.3. Remediation technologies (clean-up) ... 9
1.3.1. Mechanical recovery ... 9
1.3.2. Chemical dispersants ...10
1.3.3. Bioremediation as a promising remediation technology ...10
1.4. Current Portuguese national contingency plan ...12
1.5. Objectives ...13
Chapter 2 ...15
2. Materials and Methods ...16
2.1. Selection of an autochthonous hydrocarbons-degrading bacteria consortium ...16
2.1.1. Sampling site of the bacterial strains and hydrocarbons contamination history 16 2.1.2. Growth of isolated bacterial strains ...17
2.1.3. Preparation of a hydrocarbons-degrading bacterial consortium ...18
2.1.4. Enrichment experiments with 4 different carbon sources ...18
2.1.5. Abundance of hydrocarbons degraders by the Most Probable Number Method 19 2.2. Microcosm bioremediation study ...20
2.2.1. Microbial growth rate optimization ...20
2.2.2. Enriched 5 bacterial strains mixture consortium ...21
2.2.3. Microcosms experiment ...21
2.2.4. Abundance of hydrocarbon degraders by the most probable number method 23 2.2.5. Total petroleum hydrocarbons concentrations ...23
2.2.6. Colony-forming units (CFU) and isolation of bacterial strains ...24
2.2.7. Phylogenetic analysis of the bacterial strains ...25
2.2.7.1. DNA extraction and quantification ...25
2.2.7.2. PCR analysis and electrophoresis gel ...26
2.3. Data and statistical analyses ...26
Chapter 3 ...28
3. Results ...29
3.1. Hydrocarbons-degrading bacterial consortium ...29
3.2. Enrichment experiments with 4 different carbon sources ...30
3.3. Microbial growth rate optimization ...31
3.4. Microcosm experiments ...31
3.4.1. Visual aspect ...31
3.4.2. Abundance of hydrocarbons-degrading bacteria ...32
3.4.3. Hydrocarbons removal ...33
3.4.4. Bacterial strains identification and CFUs ...34
Chapter 4 ...37
4. Discussion and conclusions ...38
4.1. Discussion ...38
4.2. Conclusions and Future Perspectives ...46
Chapter 5 ...47
i
Figures and tables index
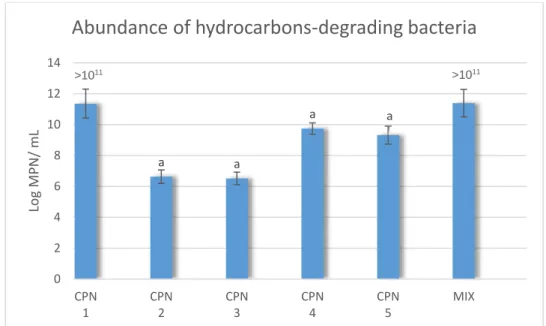
Figure 1 - (a) Routes of all cargo ships bigger than 10 000 GT during the year of 2007, where the color scale indicates the number of journeys along each route (adapted from (Kaluza et al., 2010); (b) Oil spill incidents that have occurred in the Galicia and Portugal shore (adapted from http://wwz.cedre.fr/en/Our-resources/Spills/Spill-map). ... 2 Figure 2 - A representation of some of the molecular structures of alkane hydrocarbons, aromatic hydrocarbons, resins and asphaltenes. Structures were drawn in the program ACD/ChemSketch (Freeware) 2016.2.2. ... 5 Figure 3 - Principles of the degradation of hydrocarbons by aerobic and anaerobic pathways in a scheme, adapted from Sierra-Garcia & de Oliveira, 2013. ... 7 Figure 4 - Aerobic degradation pathways of aliphatic and aromatic hydrocarbons, alkane and benzene molecules, adapted from Hassanshahian & Capello, 2013. TCA – tricarboxylic acid cycle. ... 8 Figure 5 - Location of beach “Cabo do Mundo” from which CPN samples were isolated, the oil refinery “Petrogal”, marked in red in the map and the Leixões harbour (from Google Maps). ...17 Figure 6 - (a) Schematic representation of a MPN 96-well plate, where the tenfold dilutions are applied (line A); (b) Example of a MPN plate after 15 days of incubation and coloration with INT. ...20 Figure 7 - Scheme of microcosm experiment with the different treatments: natural attenuation (N), biostimulation (BS), combination of biostimulation and autochthonous bioaugmentation with consortium enriched with sodium acetate (BS+ABA (EA)) or with petroleum (BS+ABA (EP). ...22 Figure 8 - Example of a CFU counting plate, from the ABA treatments, one with the EA inoculum (on the left) and another with the EP inoculum (on the right), where different morphological colonies were selected for streaking methods, and further identification. ..25 Figure 9 - Abundance of hydrocarbons--degrading bacteria for each of the isolated bacterial strains, (CPN 1, 2, 3, 4, 5) and for the mixture of the 5 bacterial strains (MIX) (mean values, standard deviations, n=3) evaluated by the most-probable number (MPN) method. a - represents significant differences comparing with the MIX (p≤0.05). ...29 Figure 10 - Abundance of hydrocarbons degraders for the bacterial strains mixture (mean values, standard deviations, n=3) when different carbon sources were supplied: Petroleum
ii (P), Sodium acetate (A), a mixture of polycyclic aromatic hydrocarbons (PAHs) and a combination of sodium acetate with the mixture of PAHs (A + PAHs), evaluated by the most-probable number (MPN) method. a – significant differences comparing with the P treatment; b - significant differences comparing with the A treatment. ...30 Figure 11 - Microbial growth rate of the mixture of 5 isolated bacterial strains, when sodium acetate was added to the flasks daily (A) and twice a week (B) (mean values, standard deviation, n=2). ...31 Figure 12 - Visual aspect of the microcosm flasks at the beginning (a) and after 15 days (b) of the experiment, in which different treatments were applied: Natural attenuation (N), Biostimulation (BS), a combination of Biostimulation and Bioaugmentation with a consortium enriched with sodium acetate (BS + ABA (EA)) and a combination of Biostimulation and Bioaugmentation with a consortium enriched with petroleum (BS + ABA (EP)). ...31 Figure 13 - Abundance hydrocarbons degraders at the beginning (T0) and after 15 days (T15) of the microcosm experiment (mean values, standard deviations, n=3) in which different treatments were applied: Natural attenuation (N), Biostimulation (BS), a combination of Biostimulation and Bioaugmentation with a consortium enriched with sodium acetate (BS + ABA (EA) and a combination of Biostimulation and Bioaugmentation with a consortium enriched with petroleum (BS + ABA (EP)), evaluated by the most-probable number (MPN) method. a - significant differences between T0 and T15; b- significant differences comparing all treatments with N in T0; c- significant differences comparing all treatments with N in T15; d- significant differences comparing BS with the ABA treatments in T0. ...32 Figure 14 - Removal percentage of total petroleum hydrocarbons (TPHs), (mean values, standard deviations, n=3) within the microcosm treatments: Natural attenuation (N), Biostimulation (BS), a combination of Biostimulation and Bioaugmentation with a consortium enriched with sodium acetate (BS + ABA (EA) and a combination of Biostimulation and Bioaugmentation with a consortium enriched with petroleum (BS + ABA (EP)), accessed by the Fourier Infrared spectroscopy method (FT/IR). a – significant differences comparing all treatments with N. ...33
iii Table 1 – Top 10 of the biggest oil spills in history, including year, location and amount of oil spilled (in tons). Information collected from the ITOPF Oil Tanker Spill Statistics 2016 [http://www.itopf.com/knowledge-resources/data-statistics/statistics/] and CEDRE oil spills database [online_ http://wwz.cedre.fr/en/Our-resources/Spills]. ... 4 Table 2 - Composition of the standard solutions used in total petroleum hydrocarbons (TPHs) determination. ...24 Table 3 - Taxonomic identification of the isolates (CPN1, 2, 3, 4 and 5) used for the enriched consortia which were applied in the microcosms. ...34 Table 4 - Values of Colony-forming units (CFUs) of each microcosms treatment at the end of the experiment: Natural attenuation (N), Biostimulation (BS), a combination of Biostimulation and Bioaugmentation with a consortium enriched with sodium acetate (BS + ABA (EA) and a combination of Biostimulation and Bioaugmentation with a consortium enriched with petroleum (BS + ABA (EP)). ...34 Table 5 - Taxonomic identification of bacterial strains isolated at the end of the microcosms experiment for the different treatments: Natural attenuation (N), Biostimulation (BS), a combination of Biostimulation and Bioaugmentation with a consortium enriched with sodium acetate (EA) and a combination of Biostimulation and Bioaugmentation with a consortium enriched with petroleum (EP). Species identification were determined with a % of similarity higher than 99% ...35
iv
Abbreviations
A + PAHs Combination of sodium acetate and polycyclic aromatic hydrocarbons
A Sodium acetate
ABA Autochthonous bioaugmentation
BA Bioaugmentation
BH Bushnell–Haas
BS Biostimulation
BS + ABA (EA) Combination of biostimulation and bioaugmentation with a consortium enriched with sodium acetate
BS + ABA (EP) Combination of biostimulation and bioaugmentation with a consortium enriched with petroleum
C/N/P Ratio of carbon, nitrogen and phosphorous CFUs Colony-forming units
CO2 Carbon dioxide
DNA Deoxyribonucleic acid
EA Enrichment with sodium acetate EP Enrichment with petroleum
FT/IR Fourier transformed infrared spectroscopy
HC Hydrocarbon
Int Iodonitrotetrazolium Violet
KH2PO4 Potassium di-hydrogen phosphate
KNO3 Potassium nitrate
MPN Most probable number N Natural attenuation NaCL Sodium chloride OD Optical density
v
P Petroleum
PAHs Polycyclic aromatic hydrocarbons PCA Plate count agar
rRNA Ribosomal ribonucleic acid
SW Seawater
TAE Tris-acetate-ethylenediamine tetraacetic acid TCA Tricarboxylic acid cycle
1
Chapter 1
General introduction
2
1. General introduction
1.1. Oil pollution in marine environments
In present days, society is still dependent on fossil fuels for energy production, transports and industry, which demands for a continuous exploitation and transport of petroleum and its derivatives on the sea.
Marine environments are very sensitive to contamination and are constantly targets of petroleum hydrocarbons (HC) pollution, whether is from large-scale oil spills, or smaller ones (less than 7 tons). Oil spills represent an acute form of pollution and can be originated from storage, exploitation in offshore platforms and transportation of petroleum and its products (Brooijmans et al., 2009; Das & Chandran, 2011)
Maritime shipping and transport of petroleum in oil tankers is made across the oceans within a network of routes, which intensifies its frequency of passage and quantities of crude oil transported in near-shore areas (figure 1). Therefore, coastal habitats are at risk and frequently affected by oil spill incidents. The European Atlantic area represents a hotspot for oil tankers routes (Acosta-González et al., 2015; Vieites et al., 2004). Portugal is a susceptible country to oil spills, giving its geographical position and closeness to the previous hotspot trade routes (figure 1).
Figure 1 - (a) Routes of all cargo ships bigger than 10 000 GT during the year of 2007, where the color scale
indicates the number of journeys along each route (adapted from (Kaluza et al., 2010); (b) Oil spill incidents that have occurred in the Galicia and Portugal shore (adapted from http://wwz.cedre.fr/en/Our-resources/Spills/Spill-map).
(a)
3 Although oil spills have a huge negative impact on the environment, they only represent less than 10% of the total petroleum HC input in the environment (Ivshina et al., 2015). The major source of petroleum HC pollution at sea is not derived from oil spill accidents, but from chronic pollution (along time) originated from natural seeps, leaking ships and illegal cleaning of the ship’s bilges (Henkel et al., 2014).
These type of contamination is more difficult to control and monitor, leading to a continuous increase of HC pollution in the marine environments (Henkel et al., 2014).
Nevertheless, the amount and concentration of the toxic chemicals after an oil spill are present in such high rates that must be taken seriously.
Oil spills are known to cause severe toxicity and health problems to the living organisms and in many cases, can cause death of marine fauna and flora. Besides, at the sea surface, an oil slick could form, blocking UV radiation as well as the aeration of the ocean, affecting all the life below the polluted water column (Xue et al., 2015). All the prior effects lead to changes in the microbial communities function and structure (Acosta-González et al., 2015) along with negative outcomes on trophic chains. Economy is also affected, as it interferes with fisheries, tourism and recreational activities.
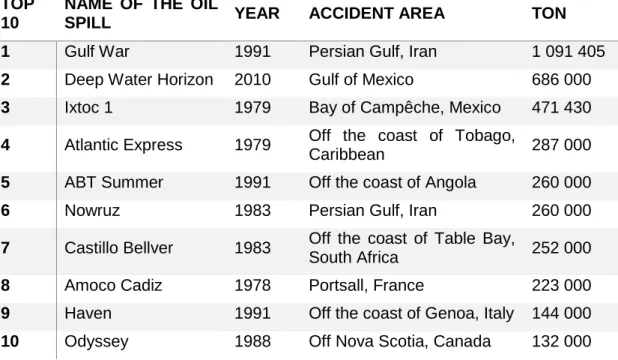
Along the decades we have seen some oil spill disasters and witness its devastating consequences and repercussions until today. The Deepwater Horizon (2010), the Prestige (2002) and the Exxon Valdez (1989) oil spills are some examples that have marked History for their high negative impact on the environment and marine wildlife. In table 1 are represented the 10 biggest oil spills in History.
The spillage of the “Prestige” oil tanker, in November 2002, about 30 miles away from the Galician coast, reached the shore and affected more than 600 beaches. The damages of the spill also reached some parts of Northern Portugal coast (Acosta-González et al., 2015; Medina‐Bellver et al., 2005; Morales-Caselles et al., 2008).
4
Table 1 – Top 10 of the biggest oil spills in history, including year, location and amount of oil spilled (in tons). Information collected from the ITOPF Oil Tanker Spill Statistics 2016 [http://www.itopf.com/knowledge-resources/data-statistics/statistics/] and CEDRE oil spills database [online_ http://wwz.cedre.fr/en/Our-resources/Spills].
Once the oil reaches the sea, it can have different behaviors and fates depending on the climatic conditions, hydrodynamics and location where the spillage occurred (Ivshina et al., 2015; Shetaia et al., 2016) in addition to its mass, composition and chemical properties. The bioavailability of HC for degradation in the sea changes as the oil is at its dispersed, floating or settled form (Boglaienko & Tansel, 2016).
The oil undergoes several weathering processes like evaporation, dissolution, dispersion, sedimentation, photo-oxidation and biodegradation (Acosta-González et al., 2015; Gong et al., 2014; Mishra & Kumar, 2015). These processes will have an impact on the success of remediation techniques facing an oil spill.
The composition and type of the oil will also have an influence in the process of degradation. Crude oil is a complex mixture of petroleum HC including 4 groups of chemicals: alkanes, aromatic HC, resins and asphaltenes (Das & Chandran, 2011), represented in the figure 2. Alkanes are linear and cyclic hydrocarbons only constituted by single carbon bonds. Aromatic HC are constituted by one or more benzene rings, being divided into monocyclic and polycyclic aromatic hydrocarbons (PAHs). Resins and asphaltenes, on the other hand, are polar compounds, with complex structures composed by carbon and hydrogen, with the addition of elements like nitrogen, sulfur and oxygen (Varjani & Upasani, 2016).
TOP 10
NAME OF THE OIL
SPILL YEAR ACCIDENT AREA TON
1 Gulf War 1991 Persian Gulf, Iran 1 091 405
2 Deep Water Horizon 2010 Gulf of Mexico 686 000
3 Ixtoc 1 1979 Bay of Campêche, Mexico 471 430
4 Atlantic Express 1979 Off the coast of Tobago,
Caribbean 287 000
5 ABT Summer 1991 Off the coast of Angola 260 000
6 Nowruz 1983 Persian Gulf, Iran 260 000
7 Castillo Bellver 1983 Off the coast of Table Bay,
South Africa 252 000
8 Amoco Cadiz 1978 Portsall, France 223 000
9 Haven 1991 Off the coast of Genoa, Italy 144 000
5 Crude oil can be classified into light, medium and heavy oil, accordingly to the proportion of the different components. A light oil has high content of alkanes and aromatic HC and lower concentrations of resins and asphaltenes. In opposite, heavy oil has higher proportion of resins and asphaltenes (Hassanshahian & Cappello, 2013).
Some oil components, like high-molecular weight PAHs and resins, are recalcitrant and extremely toxic to marine organisms, and could persist in the environment for decades (Hassanshahian & Cappello, 2013; Leahy & Colwell, 1990).
Figure 2 - A representation of some of the molecular structures of alkane hydrocarbons, aromatic hydrocarbons,
resins and asphaltenes. Structures were drawn in the program ACD/ChemSketch (Freeware) 2016.2.2.
Despite of the weathering processes and physic-chemical changes of the oil, an important part of oil degradation in the environment is carried by microorganisms capable of degrading petroleum HC.
1.2. Degradation of hydrocarbons by marine microorganisms
Some marine microorganisms such as fungi, yeasts and bacteria are capable of degrading petroleum HC. In marine environments bacteria is thought to be the key oil-degrading organisms within microbial communities (Leahy & Colwell, 1990).
When in an oil-contaminated environment, the microbial community suffers an adaptation process, occurring the activation of enzymes, selective pressure, alterations in the genes by gene transfers and mutations linked to the oil-degrading metabolism (Leahy & Colwell, 1990).
These organisms use the carbon from the oil as a source of energy, breaking its compounds into others with lower molecular weight (Guo-liang et al., 2005). The HC degradation usually
6 starts from low-molecular weight HCs (linear alkanes) to higher ones (cyclic alkanes or aromatic HC) and from simple structures to more complex ones (Leahy & Colwell, 1990; Li et al., 2016; Varjani & Upasani, 2017).
The number and weight of the atoms determines the molecular weight of a compound. Considering the HC structure, linear, branched, cyclic or aromatic, the susceptibility of the HC for biodegradation will change (Das & Chandran, 2010). Like n- alkanes, aromatic HC with low molecular weight, such as toluene and benzene, can be easily degraded by microorganisms. For n-alkanes, a wide bacterial species can degrade it, but, the more complex a HC molecular structure is, in general, the more difficult is for the microorganisms to degrade, and so, fewer species can degrade them (Atlas, 1995; Varjani, 2017). It is difficult to find species that can degrade all HC.
So, given the complexity of the crude oil, and since different bacterial strains can degrade a specific group of HCs, a diverse microbial community will be able to degrade a much larger set of HCs, thus delivering a better performance in the crude oil degradation (Dell'Anno et al., 2012; Hassanshahian & Cappello, 2013).
In the degradation process, the bioavailability of HC is very important, since many times bacteria cannot have access to the hydrophobic part of the oil. So, to work around that some bacterial strains can produce and secrete extracellular enzymes that act as natural surfactants (biosurfactants), such as glycolipids, phospholipids, lipopeptides and lipoproteins (Fuentes et al., 2014; Kleindienst et al., 2015; Marti et al., 2014).
These biosurfactants reduce the water-oil tension, disperses the oil into small droplets and increases the oil surface area, increasing, therefore, HC availability to the organisms (Das & Chandran, 2011; Paul et al., 2005). Another method that some bacterial strains adopt is the adhesion to the oil-water interface, that allows an easier uptake of the HCs by the cells (Abbasnezhad et al., 2011).
For the degradation of the compounds, bacteria require a certain amount of nutrients, specially nitrogen and phosphorous, that lacks in the marine environment in the proportion needed after an oil spill (Hassanshahian & Cappello, 2013; Ron & Rosenberg, 2014). The Redfield ratio of C/N/P in the oceans defines values of 106:16:1, meanwhile in bioremediation studies a ratio of 100:10:1 (C/N/P) is used for the optimization of nutrients in the assays (Almeida et al., 2013; Nikolopoulou, et al., 2013).
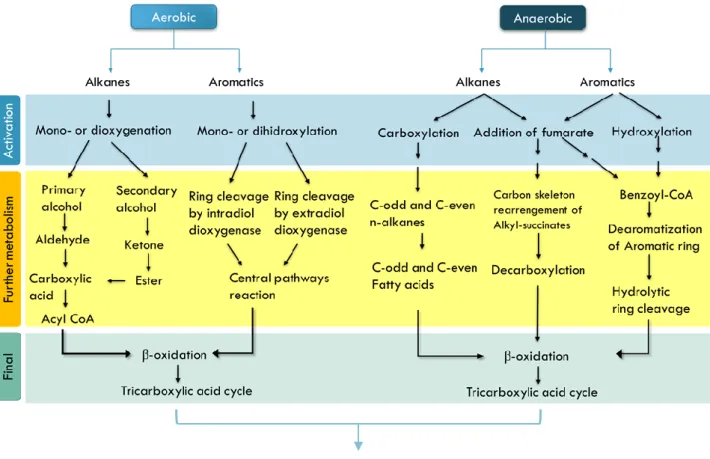
Once the cells uptake HC, they could be metabolized either in aerobiose or anaerobiose pathway (figure 3). An ideal degradation process of the HC degradation by microorganisms ends with the release of CO2 (mineralization of HC), biomass and other non-toxic
7 In aerobiose pathways, the first step is the activation of the HC substrate by oxigenases, with the conversion to alkanols, in the case of alkanes, and catechols, in case of aromatic HC degradation. Further metabolism with β-oxidation and intermediates entering the tricarboxylic acid cycle produces energy, biomass and releases CO2 (Atlas, 1995; Das &
Chandran, 2011; Hassanshahian & Cappello, 2013; Varjani, 2017; Varjani & Upasani, 2017). As for the anaerobic pathway, not much is yet known, but a first activation phase with addition of fumarate, carboxylation for both aliphatic and aromatics occurs, with further metabolism, like decarboxylation, ring cleavage and β-oxidation (Foght, 2008; Hassanshahian & Cappello, 2013; Sierra-Garcia & de Oliveira, 2013).
Figure 3 - Principles of the degradation of hydrocarbons by aerobic and anaerobic pathways in a scheme,
adapted from Sierra-Garcia & de Oliveira, 2013.
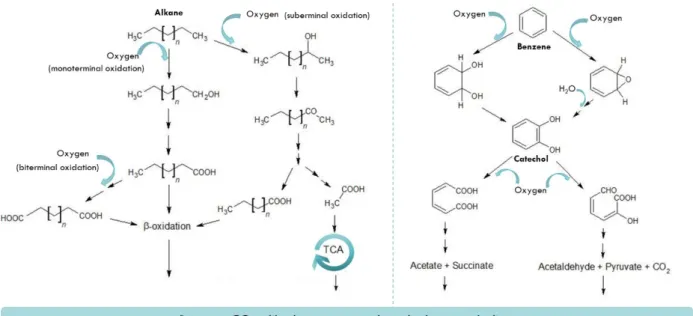
Aerobic conditions are considered the most efficient form of HC degradation, since it has a faster degradation pathway (figure 4) and facilitates the action of oxygenases in the compounds, strong oil-degrading enzymes (Fuentes et al., 2014; Venosa & Zhu, 2003). Degradation of petroleum HC in anaerobiose, has been considered not significant in the process, but recently is thought to be an important part in the degradation of some aromatic HC, under certain conditions (such as sediments and in lower zones of the water column) (Leahy & Colwell, 1990; Venosa & Zhu, 2003). This process can happen in sulfate-reducing conditions and methanogenic conditions (Berdugo-Clavijo & Gieg, 2014; Foght, 2008).
8
Figure 4 - Aerobic degradation pathways of aliphatic and aromatic hydrocarbons, alkane and benzene
molecules, adapted from Hassanshahian & Capello, 2013. TCA – tricarboxylic acid cycle.
Yakimov et al. (2007) distinguishes the crucial part of “obligate hydrocarbonoclastic bacteria” (OHCB), known for their exclusive feeding on hydrocarbons, in the cleaning process of HC polluted sites.
Alcanivorax borkumensis is an example of such OHCBs, with a genome rich in oil-degrading enzyme genes and pili that allows the attachment to the water-oil surface area and facilitates the HC degradation (Brooijmans et al., 2009). Kasai et al. (2002) notice the predominance of the genus Alcanivorax within the microbial community in studies with water contaminated with crude oil in the presence of phosphorous and nitrogen. Within the OHCB,we can find organisms from the genera Oleispira, Thalassolituus and Cycloclasticus (Yakimov et al., 2007).
Associated with PAHs degradation there are organisms from the genera Arthrobacter, Sphingomonas, Pseudomonas, and Rhodococcus (Brooijmans et al., 2009).
Rhodococcus erythropolis has been continuously linked with the degradation of petroleum HC in several studies (de Carvalho & da Fonseca, 2005; Martinkova et al., 2009). The genera Rhodococcus is known to have mycolic acids in the composition of its external cell layer, which allows the adhesion of the cell to the water-oil interface and a variety of oil degrading enzymes with wide biodegradation capacities (Fuentes et al., 2014; Larkin et al., 2005; Martinkova et al., 2009).
9 Rhodococcus erythropolis, Pseudomonas aeruginosa, Bacillus subtilis and Micrococcus luteus are some of the biosurfactants producing species, their surfactants having the potential to be applied in oil biodegradation processes (Makkar et al., 2011). Regardless of their natural capacity to degrade HC, in case of an oil spill, natural microbial communities cannot act nor degrade fast enough to prevent the negative consequences in the environment towards organisms, either from the lack of needed nutrients or low bioavailability of the oil constituents.
Thus, there is a need to implement remediation techniques to face an oil spill.
1.3. Remediation technologies (clean-up)
Facing an oil spill disaster, quite a few remediation techniques can be performed, including mechanical, chemical and biological ones. The type, amount and location of the oil spilled will command the clean – up efforts in the remediation processes.
Current oil spill clean-up steps focus on mechanical removal and on the use of chemical dispersants, which can cause additional contamination to the environment and marine organisms (Al-Majed et al., 2012; Ivshina et al., 2015).
1.3.1. Mechanical recovery
The usual first-line response to an oil spill occurring in open sea includes the skimming of the oils top layer with the help of boats and boomers. With this technique, it is intended to remove as much oil as possible from the sea.
But this technology cannot remove all the oil from the sea surface and is not suitable to be applied neither in case of a large oil spill nor in open sea with difficult access of boats and humans (Nikolopoulou & Kalogerakis, 2008; Prince et al., 2003).
Combining with this technique, in-situ burn of oil is sometimes applied. This is a very polluting method, leading to the emission of massive amounts of volatile compounds, such as CO2 and PAHs, and the consequent contamination of the environment. Beyond the
disadvantages of in-situ burn, it only removes the lower-weight HC, leaving the higher ones in the environment (Ivshina et al., 2015).
10
1.3.2. Chemical dispersants
Another recurrently used method is the application of chemical dispersants to the oil surface. Chemical dispersants are a combination of solvents and surfactants that allows the dispersion of the oil into droplets, making HC compounds more available to be degraded by the natural microbial community (Kirby & Law, 2008; Kleindienst et al., 2015; Nikolopoulou & Kalogerakis, 2008).
Surfactants accelerates the biodegradation rate, but when used in high concentrations it can lead to growth inhibition and phenotypic changes in HC degrading microbial communities as demonstrated by Tian et al. (2016).
The assortment of a surfactant depends on the type of habitat to be remediated and its composition and efficiency. This technique is considered ideal to be applied for some environments such as deep water and hostile weather conditions (Ivshina et al., 2015). Even though this technique is widely used, it can sometimes be toxic to some marine organisms and lead to the aggregation of the oil-droplets and sedimentation (Barron, 2012; Bravo-Linares et al., 2011; Hemmer et al., 2011; Kirby & Law, 2008; Seidel et al., 2016). In alternative, surfactants can be originated from natural sources, being produced by some bacterial strains when in the presence of the oil, as described in the previous section. The application of biosurfactants as a green-remediation technology is currently being discussed (Marti et al., 2014).
Comparing to the chemical surfactants, biosurfactants are more biodegradable, have higher selectivity and can act in environments with extreme conditions of temperature, salinity and pH (Souza et al., 2014).
1.3.3. Bioremediation as a promising remediation technology
The current response mechanisms may not remove completely the oil spilled and remediate the environment. Only mechanical and chemical methods are not sufficient to treat affected environments and assure the ecologic equilibrium of the environment. Bioremediation might be a suitable method to fill up the gaps in current remediation technology.
Bioremediation has been increasingly considered a cost-effective, efficient and ecologic tool for remediating oil polluted sites, since it does not cause negative environmental impacts,
11 contrarily to the commonly used methods, and can lead to a faster HC compounds degradation (Almeida et al., 2013; Li et al., 2016; Prince et al., 2003; Priya et al., 2016). Bioremediation is based on the natural ability of some microorganisms, such as bacteria, to degrade HC and is commonly divided into two strategies: biostimulation (BS) and bioaugmentation (BA).
Biostimulation is the process in which the indigenous microbial community is enriched by the addition of essential nutrients, like nitrogen and phosphorous, leading to an increase in the oil degradation. On the other hand, bioaugmentation promotes the enhancement of the HC degradation, through the addition of bacterial strains, isolated or in a consortium, capable of degrading HC (Lee & Mora, 1999; Pontes et al., 2013).
The efficiency of the bioremediation processes is limited by several factors such as temperature, nutrients, oxygen, composition and concentration of petroleum HCs and microbial community structure. During degradation, natural microbial communities often lack essential nutrients, like nitrogen and phosphorous, needed for bacteria metabolism. Aiming to fill this gap, water-soluble fertilizers can be used as a source of these nutrients (Nikolopoulou & Kalogerakis, 2008).
Other fertilizer can be used. For instance, Ron and Rosenberg (2014) propose the use of a natural fertilizer, uric acid (guano), as a fertilizer in oil spills remediation, since it is rich in nitrogen and phosphorous and is easily available in the market.
Besides the lack of nutrients, the low bioremediation rate in an oil spillage might be related to the lack of oil - degraders in the natural microbial community. In this case, bioaugmentation techniques can be implemented.
Relatively to bioaugmentation, exogenous and autochthonous bioaugmentation (ABA) can be considered, which represents the input of exogenous oil-degrading bacteria to the medium, or the input with indigenous oil-degrading bacteria, respectively.
Several scientists investigated the bioaugmentation approach in oil-contaminated environments and through a selection and isolation of the species with this capacity some products (microorganisms) are currently commercialized (Tyagi et al., 2011).
Some marine oil-degrading species, such as Alcanivorax borkumensis, Marinobacter hydrocarbonoclasticus, Cycloclasticus pugetii and Oleispira antarctica, are studied and available for their known HC degrading capacity (Mapelli et al., 2017).
The use of autochthonous microorganisms can be advantageous, since they are better adapted to the affected environment, leading to a better efficiency in the oil degradation. This strategy can be more successful than the input of exogenous microorganisms, which
12 commonly cannot compete with the natural microbial community, not prosper and not enhance the HC degradation (Fodelianakis et al., 2015; Tao et al., 2017). In addition, the use of autochthonous microorganisms avoids the unpredictable ecological impacts that can lead from the introduction of non-native organisms. The importance and success of ABA has been increasing in recent studies and its possible application in the field is being considerate (Hosokawa et al., 2009; Mapelli et al., 2017; Nikolopoulou, et al., 2013). When applying BA treatments, the use of a consortium of bacterial strains can be more effective in the degradation of the petroleum HC, as each strain degrades different oil compounds, thus leading to a broader spectrum of action (Bacosa et al., 2012; Vila et al., 2010). Vila et al. (2010), observed the structural dynamics of an enriched microbial consortium, where species from diverse groups were involved in the degradation of different HC compounds, leading to an efficient oil degradation.
The implementation of bioremediation in a real-case scenario of an oil-spill is still at its beginning, and since there are a lot of variables in the environment, the effect of bioaugmentation is difficult to predict. But, before applying to the oil spill, bioremediation techniques must be previously tested in real-scenario simulated environment conditions, such as mesocosms and field tests (El Fantroussi & Agathos, 2005; Venosa et al., 1996). Nevertheless, some cases, like the cleanup of the crude oiled beach, after the Exxon- Valdez oil spill, where fertilizers were used to stimulate the degradation of HC by the natural microbial community, can be taken as examples of the success and validation of bioremediation technology (Gertler et al., 2009; Lindstrom et al., 1991).
A combined effect of the techniques of biostimulation and bioaugmentation, could enhance the HC degradation rate, and should be more deeply studied (El Fantroussi & Agathos, 2005; Nikolopoulou et al., 2013), particularly the autochthonous bioaugmentation.
1.4. Current Portuguese national contingency plan
There is some legislation in Portugal to act in case of an oil spill. The clean-up process is headed and performed by the national maritime authority, within the project “Mar Limpo” (http://www.amn.pt/DCPM/Paginas/oquee.aspx).
In case of an oil spill incident, they establish various levels of danger, from the 4º, with a local action, to the 1º degree, with a national action, facing the oil spill and a more dangerous situation.
13 To deliver an efficient response to an oil spill, they adopt a preparation phase, where they maintain the materials needed for the response, educate and train the personnel involved and perform drills where an oil-spill is simulated. When an oil spill occurs, maritime authorities, specialists, state personnel and even volunteers can be involved in the response actions.
In case of an oil spill, first there must be the confirmation of spill, a registration of the facts along the response procedure and the alert of the responsible entities. This is followed by the containment of the spill and the proper intervention, depending on the affected site. The maritime authority has at their service, boomers, skimmers, chemical dispersants, pumps, containers absorbents and maritime vehicles and the commonly used clean-up technologies, and software which can simulate oil behavior, calculate its trajectories as well as software that can track oil tankers. They lack, however, some bioremediation technology. So, there is a need for more studies on the autochthonous biodegradation and deeper knowledge of the oil-degraders along the Portuguese coast and seas, as well as the development of suitable consortia, from microcosms, mesocosms or field tests, to act in case of an oil spill.
The incorporation of the autochthonous bioremediation in the Portuguese national contingency plan, would provide a more efficient and ecologic response to an oil spill.
1.5. Objectives
Marine environments are rich in biodiversity, presenting different microbial communities depending on the habitat. Some microorganisms are known to produce compounds, participate in the geochemical cycles and in the degradation of numerous compounds, for instance, petroleum HC.
The selection of oil-degrading bacteria happens when a microbial community is in contact with petroleum: the strains able to use the HC as their energy source, will prosper in the environment and remain in it, while the strains that cannot survive in that habitat, for lack of nutrients and other energy sources or toxicity of the oil, perish and are not present in the contaminated habitat.
This work had three main objectives, the first one (1) was to develop an autochthonous oil-degrading consortium with previously isolated bacterial strains with HC degradation potential, (2) secondly, optimize an enrichment process of that consortium with 4 different carbon sources, and finally (3) evaluate the efficiency of the consortium to degrade
14 petroleum HC, in a microcosm experiment, using different bioremediation treatments, the biostimulation and a combination of biostimulation with bioaugmentation.
Towards these aims, 5 bacterial strains, previously isolated, were tested, alone and in a mixture, for their ability to degrade petroleum HC, and then tested in enrichment experiments with 4 different carbon sources. The best performing consortia, in terms of abundance of oil degraders, was then tested in microcosms experiments in which the percentage of removal hydrocarbons and oil degraders abundance was evaluated.
This thesis is organized by a first chapter of introduction, followed by a description of the materials and methods used in the different experiments, a chapter of the results followed by its discussion and the final conclusions with some future perspectives.
15
Chapter 2
Materials and Methods
16
2. Materials and Methods
2.1. Selection of an autochthonous hydrocarbons-degrading bacteria consortium
Aiming the selection of an autochthonous hydrocarbons-degrading bacterial consortium, 5 bacterial strains previously isolated from a sandy sediment beach were tested for their ability, alone and in a mixture, to degrade petroleum hydrocarbons (HC), by the most probable number (MPN) method. Then enrichment experiments were carried out with an even mixture of the 5 bacterial strains in which 4 different carbon sources were tested. Different carbon sources were tested, to optimize the conditions for biomass production and its possible application in oil remediation biotechnology. Later, a microcosm study with different treatments, simulating natural attenuation process and remediation techniques was performed.
2.1.1. Sampling site of the bacterial strains and hydrocarbons contamination
history
The bacterial strains (CPN 1, 2, 3, 4 and 5) were isolated in a previous work (Gouveia, 2015), from a microbial consortium that showed potential to degrade petroleum HC. This microbial consortium was obtained from a sandy sediment collect in a northwestern Portuguese beach, “Cabo do Mundo” (41°13'13.9"N 8°42'53.1"W), near Matosinhos city. This beach is located near an oil refinery (Petrogal, Matosinhos) and about 4 km from the Leixões Harbor (Figure 5). The refinery represents a risk for HC contamination, as observed in August 1994 and in 2007, when surrounding beaches were polluted due to malfunction of pipelines and escapes of residues from its wastewater treatment plant to the ocean. Moreover, several ships pass near this beach due to the proximity of the harbor. In 1975, the Jakob Maersk oil spill has occurred in the harbor of Leixões, being considered one of the biggest oil spills accidents, in the 13º place, according to the ITOPF statistics, affecting all nearby beaches.
This area was chosen for study, given the risk accounted in this area and its HC pollution history that might have selected a HC degrading microbial community in its sediments. In the work of Gouveia (2015) samples were collected from the beach Cabo do Mundo, and exposed to crude oil in a medium supplemented with N and P in a 15 days microcosms
17 study. At the end, samples from each flask were taken and grown in agar plates. Obtained bacterial strains were isolated and stored at -80 ºC.
Figure 5 - Location of beach “Cabo do Mundo” from which CPN samples were isolated, the oil refinery “Petrogal”,
marked in red in the map and the Leixões harbour (from Google Maps).
2.1.2. Growth of isolated bacterial strains
Bacterial strains were taken from preservation at -80 ºC, unfrozen and 100 L samples of each were collected and spread in a general-growth medium, Plate count agar (PCA), in sterilized petri plates. The plates were inoculated at 28 ºC, for about 3 days, until growth was achieved. Consecutive streaking method was applied to each plate to acquire pure colonies (following the presupposition that one colony was originated from one initial cell). Once pure colonies have grown, samples were collected for DNA extraction. For that, one loop of each isolate’s colony was collected and re-suspended in 1 mL of sterile saline solution (85 % v/v) in 2 mL microtubes. Afterwards, the tubes were centrifuge for 5 min at 7 G, the supernatant being discard and the pellet store at -20 ºC, for further DNA extraction and species identification.
18 All material and mediums used were sterilized, by autoclaving at 121 ºC, and manipulations were carried out in a flow-chamber with an initial 20 min UV decontamination cycle to ensure sterile conditions and avoid microbial contaminations.
2.1.3. Preparation of a hydrocarbons-degrading bacterial consortium
Each bacterial strain was obtained by collecting 2 loops of each pure colony (section 2.1.2), which was re-suspended in 1 mL of sterilized Bushnell–Haas (BH) medium, in 2 mL microtube. The BH medium is a mineral-salt, commonly used for HC degradation evaluation, supplemented with NaCl (2 % (v/v)) to simulate a marine solution. The optical density (OD), measured at 600 nm in a spectrophotometer (V-1200 Spectrophotometer, VWR), of each solution was adjusted to ca. 0.1, through sequential dilutions with sterilized BH medium. For the mixture of the 5 isolated bacterial strains (MIX), equal amounts of each strain were transferred into a 2 mL microtube with 1 mL of sterilized BH medium. Similar sequential dilutions were made to reach an initial OD of ca. 0.1.
The abundance of hydrocarbons-degrading bacteria was estimated in each bacterial strain solution and in the MIX by the MPN method. The MIX was then tested for their growth in BH medium enriched with different carbon sources (section 2.1.4).
All material used was sterilized as before and manipulations were carried out in a flow-chamber, with an initial 20 min UV decontamination cycle, to ensure sterile conditions and avoid microbial contaminations.
2.1.4. Enrichment experiments with 4 different carbon sources
The enrichment experiments were performed in 100 mL sterilized glass flasks, with 10 mL of sterile BH medium inoculated with 100 L of the MIX solution and 4 different carbon sources: petroleum (P); sodium acetate (A); a mixture of the polycyclic aromatic hydrocarbons (PAHs) naphthalene, anthracene, fluoranthene and pyrene; and a mixture of sodium acetate and the 4 PAHs (A+PAHs), with a final concentration of 0.01, 0.1, 0.01 and 0.11 % of carbon relatively to the medium, respectively.
The addition of the MIX solution to the flasks was done in a decontaminated flow-chamber, to ensure sterile conditions and avoid microbial contaminations. The addition of a 100 µL of a sterilized 10 % sodium acetate solution to the flasks A and A+PAHs was also performed in the flow-chamber.
19 For the solution of PAHs, 0.1 g of each PAH was weight and dissolved in 10 mL of dichloromethane and subsequently 100 L were transference to the respective flasks. In the P flasks, 100 L of petroleum, filtered through 0.2 µm sterile cellulose acetate membrane filters (VWR) with a 1 mL syringe, was added to each flask. The addition of petroleum and PAHs to the flasks was performed in an extractor hood.
Each treatment was tested in triplicate. The experiment lasted 15 days, the flasks being with lids closed, under constant agitation and at constant temperature (100 rpm at 28 ºC). At the end of the experiments samples were collected for MPN evaluation.
2.1.5. Abundance of hydrocarbons degraders by the Most Probable Number
Method
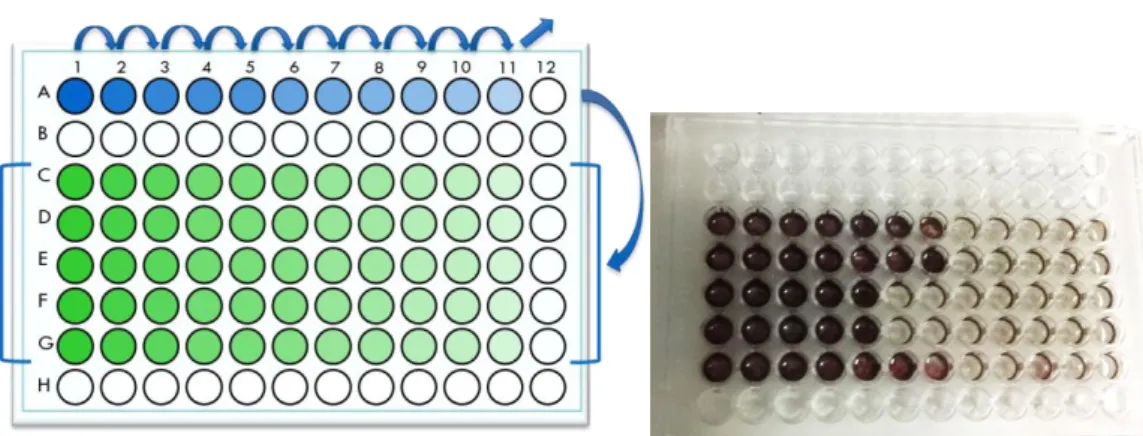
A MPN method adapted from Wrenn and Venosa (1996) was used to evaluate the abundance of hydrocarbons-degrading bacteria.
This test is performed in 96 well-plates (Figure 6a), with petroleum as the only carbon source added and BH as a culture medium. In the lines A and C to G, 180 L of sterilized BH medium supplemented with NaCl (2 % v/v) was added, except for the A1 well, where 180 L of the initial sample was put. Throughout the line A, tenfold dilutions were applied by pipetting 20 L from the former well. The last well stayed only with BH medium, being used as control.
Next, 10 L of petroleum, filtered by 0.2 µm sterile cellulose acetate membrane filter (VWR), was added to all the wells in the lines C to G. With a multichannel 200 L pipette, 20 L of the line A wells were pipetted to the lines C to G, obtaining for each dilution 5 replicates. The plates were incubated for 15 days at room temperature. At the end of the incubation period, wells from lines C to G were dyed with 50 L of a 3 mg L-1 Iodonitrotetrazolium Violet
(INT) solution, sterilized by filtration through 0.2 µm sterile cellulose acetate membrane filters (VWR). This dye turns purple when in the presence of HC degradation products and a day after the coloration (Figure 6b) positive wells are counted and calculated in the MPN method calculator program.
20
Figure 6 - (a) Schematic representation of a MPN 96-well plate, where the tenfold dilutions are applied (line
A); (b) Example of a MPN plate after 15 days of incubation and coloration with INT.
2.2. Microcosm bioremediation study
A microcosms experiment was performed to evaluate the efficiency of the bacterial consortium obtained from the mixture of the 5 isolated bacterial strains (MIX, obtained as described in section 2.1) to degrade petroleum HC through the application of different remediation techniques. In this experiment, 4 treatments were tested: natural attenuation, biostimulation, and a combination of biostimulation and autochthonous bioaugmentation (BS + ABA). Two bioaugmentation treatments were tested, one with the MIX consortium previously enriched with sodium acetate as a carbon source and the other with the MIX consortium previously enriched with petroleum as a carbon source (as described in section 2.1).
2.2.1. Microbial growth rate optimization
Preceding the enrichments with petroleum and sodium acetate, the microbial growth curve, using sodium acetate, was evaluated during 7 days.
This optimization was carried out in 250 mL sterilized glass flasks with 25 mL of sterilized BH medium inoculated with the MIX consortium and a final concentration of 1 g L-1 of
sodium acetate. For this optimization assay, 2 conditions were tested: flasks with daily input of sodium acetate solution (A) and flasks with addition of sodium acetate solution twice a week (B), achieving a final concentration of 1 g L-1. Both conditions were tested
in duplicates. Flasks were kept with constant agitation and at constant temperature (100 rpm; 28ºC). The solution OD was determined every day as before in a spectrometer at 600 nm.
21
2.2.2. Enriched 5 bacterial strains mixture consortium
Considering the results of the microbial growth curve (section 2.2.1) and the enrichment experiments with 4 different carbon sources (section 2.1.4), two 4-day enrichment processes, one with petroleum (P) and another with sodium acetate (A), were carried out before the microcosms experiment. The enrichments are important so that bioremediation tests can start with a high density of microorganisms, towards the enhancement of HC biodegradation.
A MIX consortium was prepared with loops of biomass collected from culture plates. For that, colonies of each initial bacterial strain (CPN 1 to 5) (equal amounts of each strain) were re-suspended in 3 mL of sterile BH medium (section 2.1). After homogenization of the mixture, the OD was adjusted to ca. 1, intending for a high initial microbial density. The enrichments were performed in 250 mL sterilized glass flasks with 20 mL of sterilized BH medium for the flasks with sodium acetate and 40 mL for the flasks with petroleum, both in triplicates. In the petroleum flasks, 1 mL of sterilized petroleum was added. Regarding the enrichment with sodium acetate, sterilized sodium acetate solution was added daily, ensuring a final concentration of 1 g L-1. For petroleum enrichment the
volume of BH medium was doubled in order to get as much biomass as possible from each enrichment.
After 15 days, the 3 flasks of each treatment were mixed into a composed sample and its content was centrifuged. The supernatant was discarded and the pellet re-suspended in 1 mL of unsterile natural seawater, collected in Matosinhos beach, resulting in an inoculum for the following microcosms experiment (section 2.2.3).
2.2.3. Microcosms experiment
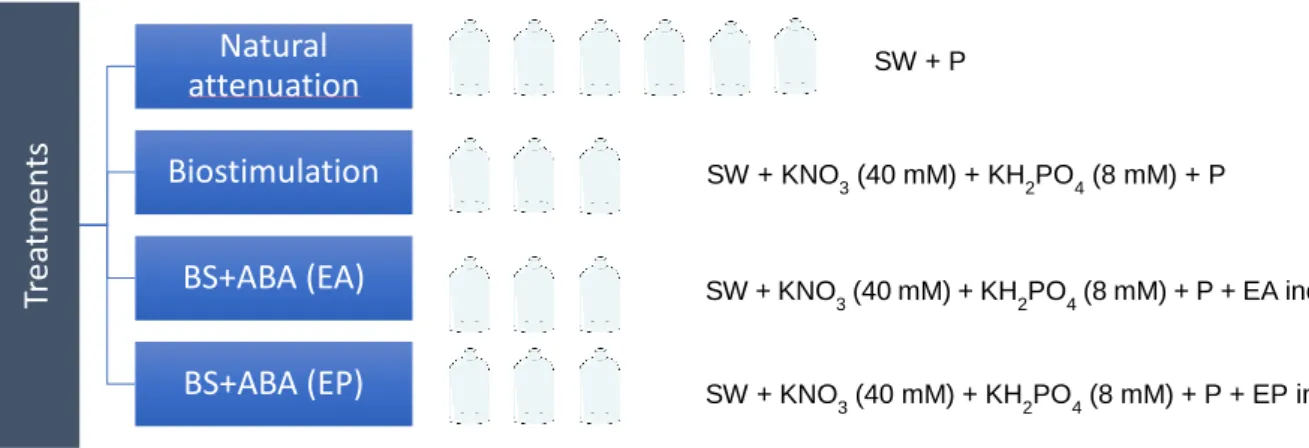
The microcosms were prepared in 100 mL sterilized glass flasks, all with 20 mL of seawater (SW) collected from a Matosinhos city beach, and 0.5 mL of sterilized petroleum (P). Four treatments were performed, natural attenuation (N); biostimulation (BS); combination of biostimulation and bioaugmentation with the MIX consortium enriched with sodium acetate (BS+ABA (EA)); and combination of biostimulation and bioaugmentation with the MIX consortium enriched with petroleum (BS+ABA (EP)) (Figure 7). Triplicate flasks were prepared for each treatment.
22
Figure 7 - Scheme of microcosm experiment with the different treatments: natural attenuation (N),
biostimulation (BS), combination of biostimulation and autochthonous bioaugmentation with consortium enriched with sodium acetate (BS+ABA (EA)) or with petroleum (BS+ABA (EP).
For the N treatment, 6 flasks were prepared, being 3 of them removed at the beginning of the assay, to be used as initial microcosm samples (T0) for MPN and Total Petroleum Hydrocarbons (TPHs) determinations.
Many times, bacteria lack essential nutrients like nitrogen and phosphorous to perform bioremediation of HC. Nutrients were added in the form of potassium nitrate (KNO3) and
potassium di-hydrogen phosphate (KH2PO4) together with the carbon source from
petroleum in a final ratio of C/N/P of (100:10:1), as described in Almeida et al (2013), for optimal bioremediation rates.
Before the preparation of the sterile nutrients solutions, filtered through 0.2 µm sterile filters, KNO3 was dried at 60 ºC, for several hours, whereasKH2PO4 was left to dry
overnight at 110 ºC, to remove water.
The flasks were incubated open, in the dark, for 15 days at room temperature, with orbital agitation (100 rpm) without changes of medium or flasks and no additional carbon source input. In addition, flasks were shaken manually every day, to ensure a better homogenization.
At the end of the 15 days, samples solutions were collected for MPN and CFU calculation and further bacterial strains isolation. The flasks and the remaining solutions were stored at -20 ºC for TPHs assessment.
Tr
ea
tments
Natural
attenuation
Biostimulation
BS+ABA (EA)
BS+ABA (EP)
SW + P SW + KNO3 (40 mM) + KH2PO4 (8 mM) + P SW + KNO3 (40 mM) + KH2PO4 (8 mM) + P + EA inoculum SW + KNO 3 (40 mM) + KH2PO4 (8 mM) + P + EP inoculum23
2.2.4. Abundance of hydrocarbon degraders by the most probable number
method
MPN was accessed in 96-well plates, as described formerly in section 2.1.5, with the exception that the final samples of the experiment (T15) were diluted in BH medium, starting the A1 well with a dilution of 10-6.
2.2.5. Total petroleum hydrocarbons concentrations
A previously optimized procedure (Almeida et al. 2013) was used.
After unfreezing the samples, 1 mL of each replicate was mixed with 10 mL of tetrachloroethylene (>99%, from Sigma) and extracted in an ultrasonic bath (Elma, Transsonic 460/H model) for 15 min, except for N samples, where 5 mL were extracted. After 10 min rest, the organic phase was passed to a new glass vial, containing 0.3 g of activated silica 2 % (m/m), to remove any lipids and greases that might interfere with the analysis, and 1 g of NaSO4 to eliminate any water from the organic extract. Vials were
agitated for 10 min in a head-to-toe shaker (Unitronic). Next, samples were filtrated through a 0.15 g glass wool tube to new glass vials.
As empty microcosm flasks presented petroleum attached to their walls, 10 mL of tetrachloroethylene were added to each flask and ultrasonic extracted as described above. The extracts were treated as described above.
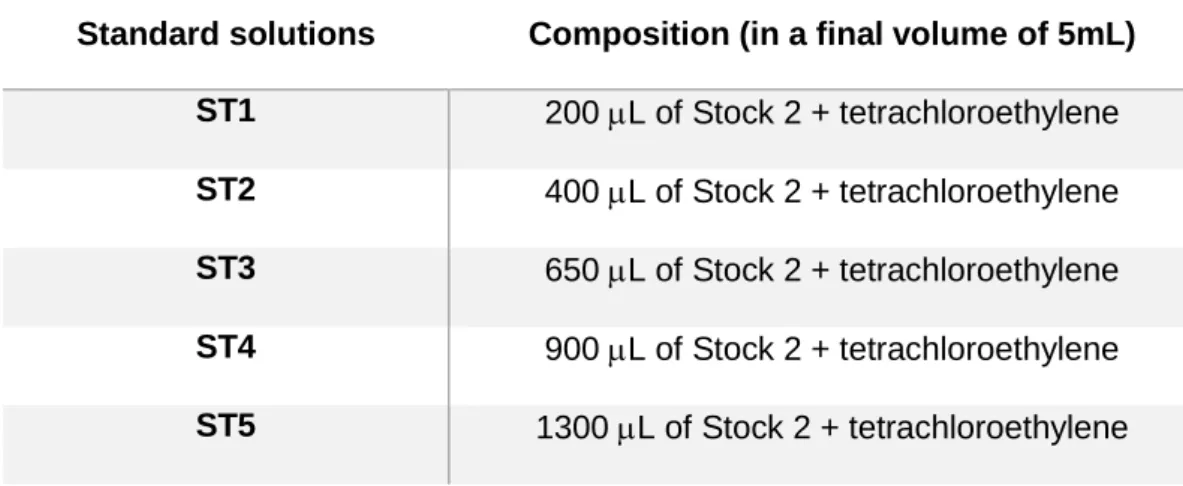
The quantification of TPHs in samples extracts was carried out by Fourier transformed infrared spectroscopy (FTIR) (Jasco FT/IR-460 Plus), with a 1 cm quartz cell. Quantification was carried out by external calibration with standard solutions prepared in tetrachloroethylene.
To prepare standard solutions, two stock solutions were prepared in advance, Stock1 with 100 L of hexadecane and 100 L of isooctane in 5 mL of tetrachloroethylene and Stock2 with 100 L of the Sock1 solution in a final volume of 5 mL of tetrachloroethylene. Then, from the Stock2 solution, several dilutions were applied to prepare the necessary standard solutions (Table 2).
24
Table 2 - Composition of the standard solutions used in total petroleum hydrocarbons (TPHs) determination.
Standard solutions Composition (in a final volume of 5mL) ST1 200 L of Stock 2 + tetrachloroethylene ST2 400 L of Stock 2 + tetrachloroethylene ST3 650 L of Stock 2 + tetrachloroethylene ST4 900 L of Stock 2 + tetrachloroethylene ST5 1300 L of Stock 2 + tetrachloroethylene
This technique allows us to quantify TPHs concentrations, by comparing directly to the calibration curve and using peak heights at 2925 cm−1 in the infrared spectrum.
The TPHs concentrations were the sum of the TPHs from the empty flasks and the TPHs concentration determined for each sample solution.
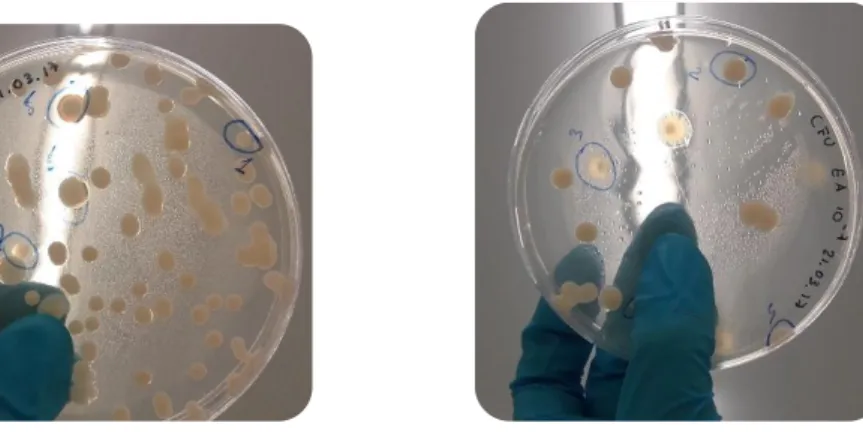
2.2.6. Colony-forming units (CFU) and isolation of bacterial strains
At the end of the microcosms experiment, a composed sample was taken from each treatment to a 1 mL sterilized microtube and diluted in sterilized saline solution (85 %), and further dilutions were applied for the counting of colony-forming units (CFU mL-1).
Tenfold dilutions were applied and 100 L of each dilution from 10-3 to 10-7 were
inoculated in PCA medium plates, for the N, BS and BS + ABA (EA) treatment, while regarding BS + ABA (EP), 10-5 to 10-7 dilutions were inoculated.
After incubation at 28 ºC for about 3 days, a growth of colonies between 30 and 300 were counted and its original dilution registered. For each treatment, colonies with different morphologic characteristics (color, shape, size, transparence, etc.) were replicated by the streaking method, for further bacterial strains isolation and identification.
25
Figure 8 - Example of a CFU counting plate, from the ABA treatments, one with the EA inoculum (on the left) and another with the EP inoculum (on the right), where different morphological colonies were selected for streaking methods, and further identification.
2.2.7. Phylogenetic analysis of the bacterial strains
2.2.7.1. DNA extraction and quantification
DNA was extracted with the E.Z.N.A.® Bacterial DNA Kit (Omega, bio-tek). The quantification of the extracted DNA was evaluated by the kit Quant-it HsDNA and quantified in the Qubit fluorometer (Invitrogen).
The quantification values were accessed by a comparison to the calibration curve, made of 2 standards solutions, S1 and S2, included in the kit. These solutions were made with 190 L of the work solution, previously prepared and 10 L of the standard solution, with a 2 min reaction period, and after that time, values were read in the Qubit fluorometer. The work solution was made in a 15 mL tube, with 199 L of buffer and 1 L of Qubit™ dsDNA HS reagent. For the extracted samples, 2 L of each sample was mixed with 198 L of the work solution in a 0.5 mL microtube, and left to rest, again, for 2 min before reading its value on the qubit fluorometer. No solution chemical compositions are provided by the kit manufacture. All this procedure was performed in a low light environment to prevent alterations in the reagents (photodegradation).
26
2.2.7.2. PCR analysis and electrophoresis gel
After the defrosting of the extracted samples, the amplification of the V1- V9 regions of the bacterial 16S rRNA gene, by the Polymerase Chain Reaction (PCR), with the universal primers 27F (5' AGAGTTTGATCMTGGCTCAG 3') and 1492R (5' TACGGYTACCTTGTTACGACTT 3') was proceeded.
An initial 2x QIAGEN Multiplex PCR Master mix was made, containing 5 L of Qiagen and 1.5 L of each universal primer.
Before the sequencing of the samples, a final volume of 10 L of PCR samples was applied in the 0.5 mL PCR tubes. For that purpose, in each sample tube, 7 L of the QIAGEN Multiplex PCR Master mix was blended with 2 L of the extracted DNA sample and 1 L of DNA-free water. A control sample was also done, replacing the 2 L of extracted DNA, by DNA-free water.
The samples were incubated in a 96-well thermal cycler, with the following program: an initial cycle of 15 min at 95 ºC, then 35 cycles at 94 ºC for 30 min, followed by 30 cycles 48 ºC for 1h 30min, 35 cycles at 72 ºC for 2 min and a final cycle of 10 min at 72 ºC. An agarose gel was made dissolving 1.5 g of agarose in 100 mL of TAE (Tris-acetate-Ethylenediamine tetraacetic acid), and heated in the microwave for 4 min. Afterwards, 0.5 l of SYBR® safe was added and the agarose solution was let settle in a cassette molder for 30 min.
Later the agarose gel was placed in a horizontal electrophoresis, where 3 µL of each sample, control and GRS Ladder 1 Kb was added to the wells. They were exposed to an electric flow of 150 V for 30min, and at the end the gel was observed, along with the DNA bands in the zone of 1500 bp. Next 7L of the resulting PCR products were sent to the I3S institute for sequencing by sanger sequence.
2.3. Data and statistical analyses
Triplicates of MPN and TPHs concentrations were analyzed and their mean values (n=3) and standard deviations were determined.
For both parameters, statistical analysis was made with the STATISTICA program (version 13.2), where a parametric Student's t-test, with the mean values and their