RBRH, Porto Alegre, v. 23, e32, 2018 Scientific/Technical Article
https://doi.org/10.1590/2318-0331.231820170148
Relationships between pacific and atlantic ocean sea surface temperatures and water
levels from satellite altimetry data in the Amazon rivers
Associação do impacto da variabilidade da temperatura nos oceanos atlântico e pacífico com os níveis dos rios da Amazônia a partir de dados altimétricos
Mylena Vieira Silva1, Adrien Paris2, Stéphane Calmant3, Luiz Antonio Cândido1 and Joecila Santos da Silva4
1Instituto Nacional de Pesquisas da Amazônia, Manaus, AM, Brasil
2Institut de Recherche Pour le Développement, Montpellier, France
3Institut de Recherche Pour le Développement, Marseille, France
4Universidade do Estado do Amazonas, Manaus, AM, Brasil
E-mails: mylenavieirasilva@gmail.com (MVS), aparis@cls.fr (AP), stephane.calmant@ird.fr (SC), luiz.antonio.candido@gmail.com (LAC), jsdsilva@uea.edu.br (JSS)
Received: September 11, 2017 - Revised: April 30, 2018 - Accepted: May 14, 2018
ABSTRACT
The influence of SST (Sea Surface Temperature) of adjacent oceans on the variability of water levels in the Amazon basin was
investigated by using radar altimetry from the ENVISAT and Jason-2 missions. Data from the in situ network was used to compare the correlations of water level and SST anomalies in the sub-basins of the Amazonas-Peru, Solimões, Negro and Madeira Rivers. The analysis was made on the monthly and annual scales between 2003 and 2015. The correlations with anomalies of levels from altimetry presented higher accuracy indices than those from the conventional network. In general, ATN and PAC are better correlated
with the entire basin. During the flood months, most of the sub-basins presented negative associations with ATN. In the months of
ebb, the response to the indexes varies according to the region. The satellite altimetry data permitted to reach regions non-monitored by the conventional network. We also analyzed the impacts of hydrological extremes in all these sub-regions in the last 13 years. In Western Amazon, the drought of 2010 stands out, associated with the warming of the Tropical Atlantic and the El Niño. In the Negro River, the water level anomalies were the lowest in the basin during the 2005 drought. In the Purus River, the effects of the
2010 drought that affected the entire Amazon, were higher in 2011 due to its strong relationship with the Atlântic and Pacific oceans.
In general, hydrological extremes are stronger or highlighted when SST increases simultaneously in both oceans.
Keywords: Amazon Basin; Climatic variability; Radar altimetry; SST indices.
RESUMO
A influência da TSM (Temperatura da Superfície do Mar) dos oceanos adjacentes na variabilidade dos níveis de água na bacia
Amazônica foi investigada a partir da composição de dados das missões altimétricas ENVISAT e Jason-2. Empregaram-se dados da
rede convencional para comparação das correlações de anomalias de níveis de água e anomalias de TSM, considerando as sub-bacias dos
rios Amazonas-Peru, Solimões, Negro e Madeira, nas escalas mensal e anual entre 2003 e 2015. As correlações com anomalias de cotas
altimétricas apresentaram índices elevados de acurácia em relação àqueles da rede convencional. De modo geral, o ATN e o PAC são
mais bem correlacionados com toda a bacia. Durante os meses de enchente, ocorrem associações negativas com ATN para a maioria
das sub-bacias estudadas, enquanto, nos meses de vazante, as respostas em relação aos índices variam de acordo com a região. Foram
analisadas, também, regiões não monitoradas pela rede convencional e os impactos de extremos hidrológicos nos últimos 13 anos. Nos rios a oeste da Amazônia, destaca-se a seca de 2010, associada ao aquecimento do Atlântico Tropical e ao El Niño. No rio Negro,
as anomalias de nível de água foram as menores da bacia durante a seca de 2005. Já no Purus, os efeitos da seca de 2010, que atingiu toda a Amazônia, foram maiores em 2011 devido a sua forte relação com os oceanos Altântico e Pacífico. De forma geral, extremos
hidrológicos são mais fortes ou evidentes quando a TSM aumenta simultaneamente nos dois oceanos.
INTRODUCTION
The Amazonian rivers are extensive, with natural flows involving several elements. The flow rate is influenced by the low water
table slope of the order of 10 to 40 mm/Km (CALMANT et al., 2013) in the alluvial plain of the Solimões-Amazonas River, due to the large water table amplitude (SILVA et al., 2010), and by the
regional characteristics of its affluent linked to the basin rainfall
regime (RONCHAIL et al., 2005; ESPINOZA VILLAR et al.,
2009). It does not correspond to a classical flow from upstream
to downstream, but to a displacement of the waters pushed by the
flood wave of Andean rivers (MOLINIER et al., 1996), forming a
vast water system of which society is strongly dependent. Parallel to this scenario of hydrological complexity, in the last decades, extreme hydrological events affected the Amazon basin, causing considerable social damages to the riverside populations, causing
transportation and navigation difficulties, food shortages, and
ecological damages, potentially aggravated by the effects abnormal
climatic conditions. These anomalies are strongly influenced by the temperature variability of the Pacific and Tropical Atlantic
(TA) oceans (MARENGO; ESPINOZA, 2016).
Given its vast territorial extension, flow and level of the
rivers of the Amazon respond differently tothe precipitations changes induced by episodes of cooling and warming of the oceans. The El Niño-Southern Oscillation phenomenon on
the Equatorial Pacific and the southern gradient of sea surface
temperature anomalies on the tropical Atlantic Ocean modulate climate variability in the Amazon by changes in circulation patterns,
causing significant impacts on the distribution of precipitation
over the basin (NOBRE et al., 2013). According to the authors, more intense droughts were observed in El Niño episodes, with greater effects mainly in the northern and central part of the basin. These events of drought can be even more severe if they occur simultaneously to the anomalous warming of the surface waters of the North Tropical Atlantic (MARENGO; TOMASELLA; UVO, 1998; TOMASELLA et al., 2011). In addition, the response to events in each portion of the basin depends on the degree of relationship with the oceans. Uvo, Tölle and Berndtsson (2000)
used neural networks to predict outflows along the Amazon
considering sea surface temperature anomalies as input and obtained better predictions for the regions north of the Amazon
River using Pacific sea surface temperature. On the one hand, good
predictions were obtained for the regions north of the Amazon
River when using Pacific sea surface temperature. On the other
hand, best predictions were found for stations in the southern portion of the Amazon River when the Atlantic Ocean sea surface temperature was used, instead.
Gloor et al. (2013) found negative correlations between the hydrological variability of the Amazon River and the variability of the sea surface temperature in the Atlantic. They found that positive sea surface temperature anomalies tend to be associated with negative precipitation anomalies and subsequentdrought such as in 1995, 1998, 2005 and 2010. When the Southern Tropical Atlantic (STA) is colder (STA-) and the North Tropical Atlantic is hotter (NTA +), the the northern part of the Amazon watershed
faces rainfall deficits. In the same time, precipitation increases in
the southern part, due to the transport of moisture from the STA (ESPINOZA et al., 2009). The main source of moisture for the Amazon is the water vapor transported by NTA trade during the
rainy season in the Amazon (SATYAMURTY; COSTA; MANZI, 2013). Any change in the sea surface temperature of this region affects the hydrological balance in the basin, reducing precipitation
and causing severe droughts. During the 2005 drought, classified as the largest in the last 100 years, water levels and flows in rivers
remained dramatically low in large rivers such as the Madeira and Solimões Rivers which basins extend to the south and west of the Amazon. In the meantime the levels of the Amazon tributaries in Peru and in the Central Amazonia was reduced, but not as low as the drought of 2010 (ESPINOZA et al., 2011; MARENGO et al., 2012; MARENGO; ESPINOZA, 2016).
However, the Atlantic ocean is not the only ocean that
influences the hydrological regime and precipitation in the
Amazon. Foley et al. (2002) studied the response of Amazonian rivers during these events. According to the authors, the river
flow decreases in the southern and eastern parts of the Amazon
basin (Tocantins, Xingu and Tapajós Rivers) during El Niño events. Marengo et al. (1998) and Marengo and Nobre (2009) report similar situations in the northern portions of the basin Negro River. The average response to La Niña conditions is
an increase in the flow of the main rivers and tributaries to the north (Amazonas in Óbidos, Solimões in Manacapuru and Juruá),
while the tributaries to the south and east of the basin showed different responses, evidencing that they do not occur abrupt changes in climatic variability in these parts of the basin due to
reduced river flow in the Tapajós river and slightly increased in the Xingu. Using data from 80 fluviometric stations (1981-2002)
located in the Amazon basin Ronchail et al. (2005) showed that during El Niño years, liquid discharges change in different ways. In tributaries like the Purus River, discharge decrease by up to 50%, while in some tributaries on the right bank of the Madeira
River (Ji-Paraná, Aripuanã and Sucunduri Rivers), they decrease by up to 25%. Already along the Tapajós, Juruá and Branco Rivers,
the signal is weaker, since negative anomalies during El Niño are
not significant. According to the results, the impact of La Niña
events is not symmetrical with the one of El Niño events. It is observed that, in years of El Niño, the discharge is high mainly in the rivers of the northeast and along the Branco River, low along
the rivers Negro, Solimões, Juruá, Purus and Beni. An inverse sign (low discharge) was verified in most of the basins to the south of
the Amazon (Mamoré and Madeira Rivers).
One of the hydrological components routinely considered in the monitoring of extreme hydrological events is the water level. The monitoring of this variable is carried out through networks of hydrometric stations and requires a series of observations in situ for a very long period of time, with high installation and maintenance costs (ALSDORF; RODRIGUEZ; LETTENMAIER, 2007). The Amazon basin is poorly monitored by a low density of conventional hydrological network. Moreober, this network is mostly limited to the Brazilian territory, which impairs or prevents in depth studies of the variability of water levels in the region. Hence, remote sensing observations become a viable means for understanding the spatial and temporal variability of hydro climatic basin patterns. The use of spatial altimetry data, initially designed for ocean applications, has demonstrated a potential contribution to the monitoring of inland water levels, being a viable alternative in the complementation of the conventional
measurements (BERRY et al., 2005; CALMANT; SEYLER, 2006; ROUX et al., 2008; SILVA et al., 2010; PARIS et al., 2016).
Studies of validation of the altimetric data with in situ data in Amazonian rivers were conducted by Birkett (1998), with Root Mean Square error (RMS) values ranging from 25 to 60 cm for the Amazon River. Variations of RMS in the order of 38 to 246 cm are shown in Birkett et al. (2002) through studies developed
in rivers with widths between 0.58 and 1.16 km and in flood
plains. For Oliveira Campos et al. (2001), the RMSs vary from 45 to 80 cm in the Amazon River. Frappart et al. (2006), in a study on the Tapajós River, found a RMS of 35 cm. The results described above used the standard algorithm for processing the radar echoes of the Topex/Posseidon mission (T/P) developed by Brown (1977) for ocean surfaces. Using products from the Environmental Satellite Mission (ENVISAT), Frappart et al. (2006) reported RMSs ranging from 26 to 140 cm, 7 to 40 cm, 10 to 110 cm and 14 to 324 cm for the Ocean, Ice-1 algorithms (WINGHAM; RAPLEY; GRIFFITHS, 1986; BAMBER, 1994), Ice-2 (LEGRÉSY; RÉMY, 1997) and Sea Ice (LAXON, 1994)
retracking algorithms, respectively, in Amazonian rivers and flood
plains. (2005) presented correlations between T / P, European Remote Sensing Satellite (ERS) and ENVISAT and Careiro
fluviometric station data on the Amazon River, with values of 0.91, 0.93 and 0.98 for the Pearson’s coefficient. Additionally,
studies by Silva et al. (2010), in the Amazon basin, present 70% of the RMSs of less than 40 cm for the ENVISAT satellite time series, using the Ice-1 and Ice-2 algorithms, and 80 cm for the altimeter data of the ERS-2 satellite, with Ice-2, in rivers up to 20 m wide. Complementarily, Birkett et al. (2002), using data from the T / P satellite’s Ocean algorithm, found values lower than 110 cm for 70% of RMS, with good results in rivers with a width greater than 1 km. Already, absolute calibration studies of the altimetric data, which consists of calculating the difference between the Water Surface Height (WSH) measured with the altimeter and that registered in situ, by a linimetric ruler level by GPS receiver, were conducted by Calmant et al. (2013) for the ENVISAT satellite and by Seyler et al. (2013) (Bias) values for the T / P and Jason-2 satellites, with systematic bias values of 1.04 m, 1.50 m and 0.31 m for the ENVISAT, T / P and Jason- 2, respectively.
In view of the above, the main objective of this work is to identify the oceanic areas that lead to variability in SSTs with
greater influence on water levels in 9 sub-basins of the Amazon.
The behavior of water level anomalies during hydrological extremes in the period 2003 to 2015 is investigated. For this purpose, oceanic areas were characterized by applying the linear correlation
coefficient between ocean variables (SST indices) and (water levels). Due to the limitation related to the failure of fluviometric data
at various points in the Amazon, the study proposes the use of spatial altimetry as an alternative source of data.
MATERIAL AND METHODS Search area
The Amazon Basin is the largest river basin in the world, covering an area of over 6 million km2, located on the territory of Peru, Columbia, Ecuador, Venezuela, Guyana, Bolivia and
Brazil. In this study, 8 sub-basins were analyzed along the Amazon,
covering the Negro River, Japurá, Amazonas-Peru, Solimões,
Tapajós, Xingu, Purus and Madeira (Figure 1), to understand the hydrological responses of rivers to temperature changes which occur in the adjacent oceans
The seasonality of the floods and droughts of the
Amazonian rivers presents great spatial variability, according to the distribution of the rain regime along the basin. A climatology, resulting from the monthly averages between the years 2003 and 2015, based on altimetric data and precipitations obtained from the product MERGE for each sub-basin. The following precipitation characteristics and variability of the hydrological regime can be observed in these sub-basins (Figure 1):
a) Amazonas-Peru (sub-basin)- months of flooding from October to May, with peak of flood soon after the maximum
of precipitation, and months of ebb between June and September, with minimum in September, during the least rainy period in the region;
b) Solimões River - flood period varying from November to
June, with maximum in June, 3 months after the maximum of precipitation; the ebb occurs from July to October with a minimum in October, two months after the minimum precipitation;
c) Japurá River - the rainy season occurs between December
and March, with the rainy season in January; the least rainy period occurs between May and September, with
lower values in July; it can be verified that the period of flood occurs between the months of April and August,
presenting maximum levels. In June; the waterfall occurs between September and February, with a drought peak, in February, with a response time of the water levels of the
Japurá River to precipitation ranging from 2 to 3 months;
d) Upper Negro River: in this region, rainfall totals are high most of the year, with values close to 350 mm between
January and March, when the flood begins, with maximum
in July; between June and September, the least rainy period occurs in the region; soon after this period, begins the ebb, with water level minimums in February;
e) Lower Negro River: in general, the flood months extend
from January to July, with highs in June; months of ebb from August to December, with November lows; according to Meade et al. (1991), the water levels in this region are
controlled by the Solimões, where large floods occur at the
mouth; the maximum rainfall occurs in March and April, and the lows in August and September;
f) Madeira River, high region - flood lasts from October to
April, with maximum in March; the peak precipitation
occurs in January, two months before the flood peak; in
August, precipitation minimums occur, and the ebb, from May to September, with a minimum in September;
g) Purus River - the months of flood extend from November
and the least rainy season occurs between the months of June and September; the response time to precipitation varies between 2 to 3 months;
h) Tapajós River - the months of flood occur between
November and April, reaching higher values in March; the
peak of flood coincides with month of higher rainfall totals;
as of May, the level of this river begins to fall, reaching minimum values in September during the less rainy season of the eastern Amazon;
i) Xingu River - months of flood occur between November
and April, with maximum levels in March, coinciding with the maximum precipitation; the least rainy period occurs between the months of June and September, the same period in which the ebb occurs, with minimum quotas in September.
Data
a) Fluviometric Data
For the execution of this work, we used the data of water
levels of the at 37 fluviometric stations obtained from the hydro
meteorological network of the National Water Agency (ANA, 2018), available on the website HidroWeb, with measurements in
the period from 2003 to 2015. Most series present significant gaps.
In this way, 5 stations were chosen that presented greater availability of data for the period considered in this study, broken down in Table 1. The data obtained were in the monthly scale, being used to calculate the normalized monthly anomaly values for each station, aiming at the comparison with the other variables used in the study.
b) Altimetric data
We used time series of water level coming from the ENVISAT (2003 to 2010) and Jason-2 (2008 to 2015) altimetric missions. These series were elaborated at RHASA (Laboratório Figure 1. Monthly water level averages by spatial altimetry, and rainfall data from MERGE data, between 2003 and 2015. The red
circles are locations chosen for the study, and the blue triangles correspond to the fluviometric stations used for comparison. SRTM
de Recursos Hídricos e Altimetria Espacial da Amazônia) and
distributed on the HYDROWEB database of THEIA-CNES. Details on the processing can be found in Silva et al. (2010).
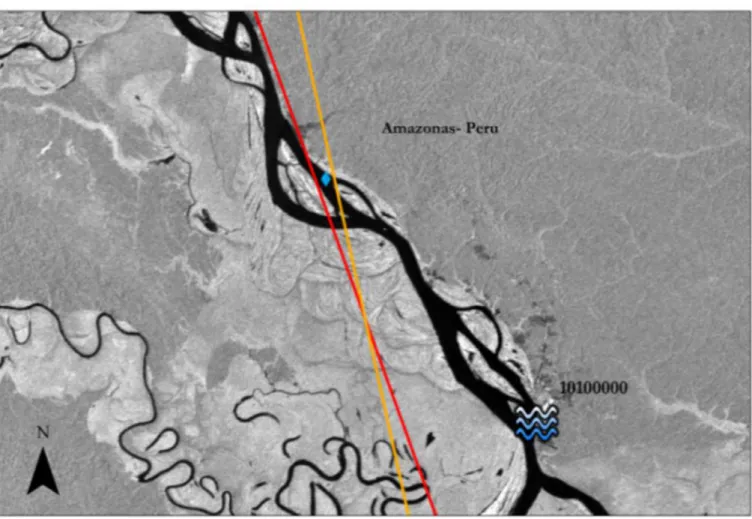
To produce time series that span over the 13 years, we had to join the ENVISAT series (2003-2010) with the JASON-2 series (2008-2015). This requires that the ENVISAT and the Jason-2 series to be joined bear the same hydrological information. Thus we
selected series located at specific locations, the crossovers of both
orbits (Figure 2). The resulting series is called a virtual composite station (VCS). The 9 VCSs, resulting of the combination of 9 ENVISAT VS and 9 Jason-2 VS are listed in Table1 together with the respective distances between the 2 VS forming a pair, and the distance to the closest gauge of the conventional network used for comparison with the altimetry data.
Figure 2. Location of the interpolated EVC in the Amazonas-Peru river (blue diamond), between the ground track of ENVISAT orbit, in yellow, and the ground track of Jason-2, in red The Amazon River is visible as the black rubanin the JERS-1 SAR image in background., Fluviometric station 10100000 is indicated, approximately 29 Km downstream.
Table 1. Description of the virtual and fluviometric stations used and their respective distances.
River ANA code Station name
Total of missing months (2003-2015
Feature ENV FeatureJason between VCSDistance Distance between CP and ANA station
Amazonas-Peru 10100000 Tabatinga 2 751 102 3 km 29 km
Solimões 13155000 Codajás 28 650 76 9.95 km 40 km
Alto Negro
14110000 Cucuí 0 493 89 13.6 km 40 km
Negro 14840000 Moura 0 235 241 4 km 60 km
Alto Madeira
15320002 Abunã 12 278 265 9 km 36 km
Japurá - - - 250 102 3 km
-Purus - - - 736 241 4 km
-Xingu - - - 48 50 12 km
-c) TSM indices
Data from monthly SST anomalies of the Pacific Ocean (PAC)
and TA oceans were obtained from the National Prediction Center (CPC) of the National Oceanic and Atmospheric Administration (NOAA). For the PAC, the Nino-3.4 index, consisting of the SST
anomaly of the central-eastern / tropical Pacific (PCT) region,
between 5° S and 5° N (latitude), and between 120° and 170° W (longitude). This area was chosen for this study because it is commonly adopted by the CPC/NOAA to determine the occurrence of ENSOs, based on the quarterly mean of SST anomaly equal or higher (lower) at 0.5° C (-0.5° C). This index is calculated using NOAA optimized interpolation (OI) for SST, version 2 (OISSTV2). For TA, NTA (5-20° north, 60-30° west) and STA (0-20° south, 30° west-10° east) were used. The TA indices were
defined by Enfield and Mestas-Nuñez (1999), where the anomaly
is calculated with respect to the seasonal climatological monthly cycle based on the years 1982-2005. Monthly climatology is linearly interpolated to determine weekly anomalies.
Methodology
Initially, a visual selection was made in the Google
Earth to find regions of the basin where the traces of the two
satellites intersect. From this procedure, the Amazon basin was
divided into 41 sub-basins, of which 30 have nearby gauges for
comparison. This separation was aimed at verifying the influence
of ocean conditions in each sub-basin separately, using ArcMap software (ESRI, 2012). However, the number of months missing
in many fluviometric stations made it impossible to validate the
altimetric data in all the sub-basins for the period considered in this study. Thus, it was decided to use only four sub-basins in a more spatialized way, which gauge presented good data regularity. Mean precipitations of each sub-basin were calculated using the Grid Analysis and Display System (GrADS). In addition, 4 sub-basins
not monitored by the conventional fluviometric data network were
selected to verify the robustness and applicability of altimetry data in future climatological studies. From these available variables, the normalized anomalies were calculated, and the correlation calculations between the variables, statistical tests and prediction of anomalies of quotas were carried out. In Figure 3, the data processing steps are outlined.
Cálculos estatísticos
a) Anomalias Normalizadas
In order to compare the different oceanic areas and water levels obtained by the conventional network and the altimetry technique, normalized anomalies (z) were calculated from the
difference between the raw data ‘x’ and the mean, divided by the standard deviation of the corresponding (Equation 1):
i, j i, j
x x
z S
−
= (1)
where z is the anomaly, referring to the variables used, from point i at time t; x i, j is the average monthly value; ¯ xi, j is the long-term
sample mean and S is the long-term sample standard deviation, respectively (WILKS, 2011).
The inclusion of normalized anomalies instead of the mean values of the variables is due to two reasons: 1) use of mean values may not adequately capture responses to very abrupt variations; and 2) favor the comparison of the hydrological variables used in
the study, since the rules are leveled by applying a specific reference
to a local zero and not geodetic, which is not related to the values measured in other rules and to the altimetric values. Thus, the
unit of the final anomaly data is dimensionless. b) Linear Correlation and Significance Test
The objective of the correlation is to determine the degree of relationship between two variables, assuming values between -1 and 1. For negative value -1, it is assumed that perfect negative correlation occurs, whereas, for positive value +1, a perfect positive correlation occurs between two variables. Signs opposite or close to zero indicate little or no correlation. The Pearson’s linear
correlation coefficient (r) is given by Equation 2:
( )( )
n
i i
i 1 x y
x x y y
r
s s
= − −
= ∑ (2)
where xi and yi indicate two variables, x and y are the arithmetic
means of each series, with sx and sy denoting the sample standard
deviations.
In order to verify if the correlation coefficients between the
anomalies of the ocean variables and of the dimension variables
are significant, the following hypothesis test was used:
null hypothesis => H :0 ρ =0 (There is no correlation between
X and Y)
alternative hypothesis => H :1ρ ≠0 (There is a correlation between
X and Y)
considering for H1: t0 > t ou t0 < - t.
where ρ is the normalized population correlation.
The significance of the test is given by Equation 3 in the
form;
0 2
r n 2 t
1 r − =
− (3)
where: t0 is the test statistic; n is the sample size; and r is the
Pearson’s linear correlation coefficient estimate. The statistical significance of the linear correlation coefficient was estimated using
the t-Student test, with a confidence level of 95% (NAGHETTINI;
PINTO, 2007).
RESULTS AND DISCUSSION
Association of water level variability with SST for VCSs and conventional network stations on an annual scale
The hydrological regime along the basin presents different behaviors, with strong spatial variability. The SST climatic indexes of NTA, STA and PAC region 3.4 were used for comparison, which are nothing but the average SST anomalies in these different regions. Initially, correlations between anomalies of water levels with oceans on an annual scale were calculated to identify which oceanic areas could be associated with sub-basins. Table 2 shows these correlations using altimetry and conventional network data for comparison between 2003 and 2015, where the values in bold
are statistically significant at the 95% confidence level.
The correlations of the oceans with the anomalies derived from the altimetry data are of the same order of magnitude
and, sometimes, more statistically significant than with the in
situ data, due to the greater availability of data. Some stations in the conventional network have many missing months, such as Solimões (24 months). However, for other regions, the correlations were very similar, as in the Negro River, which presents a better
time series. In general, significant linear correlation coefficient values (r>│± 0.30│) are observed in the two oceans considered.
The Amazon-Peru river is better correlated with the NTA (-), presenting a positive correlation with the PAC. The rivers of the north/northwest portion (Negro and Upper Negro) have a negative correlation with the PAC. The sub-basins of the Solimões and Madeira present positive correlation with the PAC. According to
the statistical test used, the Solimões River presents a significant
correlation with the STA. It is important to note that most of
the analyzed rivers present significant correlations with NTA.
In the Amazon-Peru River, correlation values for spatial
altimetry data are more significant and reliable, with values of significance lower than 0.05, presenting a strong negative correlation
with NTA and no correlation with STA. Although ‘r’ values are low for PAC, the statistical test shows that these values can be
Table 2. Correlation between observed anomalies of the conventional (obs) and altimetric (alt) networks with SST on an annual scale,
between 2003 and 2015. The correlations in bold are statistically significant at the 95% confidence level.
Ocean Amazonas-Peru Solimões Alto Negro Negro Alto Madeira
NTA obs r = -0.41 r = -0.37 r = -0.02 r = -0.36 r = -0.47
alt r = -0.48 r = -0.42 r = -0.05 r = -0.31 r = -0.49
STA obs r = -0.04 r = -0.21 r = -0.09 r = -0,08 r = 0.08
alt r = -0.13 r = -0.15 r = -0.10 r = -0.11 r = -0.12
PAC obs r = 0.29 r = 0.25 r = -0.49 r = -0.14 r = 0.41
alt r = 0.25 r = 0.35 r = -0.46 r = -0.17 r = 0.41
considered relevant. In the northern portion, in the region further downstream of the Negro basin, there are strong negative associations
with NTA. In the Upper Negro, ‘r’ values are significant (negative
correlation) only for PAC. In the southern portion of the basin, the Madeira River is better correlated with NTA (r <-0.4) and PAC (r = 0.41), showing no correlation with STA.
For all the rivers analyzed in this study, there are significant
negative correlation values for NTA (r <-0.30). The Madeira and Amazon-Peru Rivers present negative maximum correlation values between -0.40 and -0.49. In addition, observing the correlation values for the NTA, there is little or no correlation between quota and SST anomalies, except for the Solimões River. Comparing the correlations between the data, it is observed that the altimetric series present higher correlations with the SST than the data of the conventional monitoring network.
Association of the monthly variability of water levels with SST for VCSs
In order to identify the association between the water levels of the rivers along the Amazon and the TA and PAC oceans, Figure 4 and summarized in Table 3 show the months in which the anomalies of altimetric data present a higher correlation with
the oceanic regions of TA and PAC. We considered the months
in which there were more significant correlation values according
to the statistical tests used.
Amazonas-Peru
This part of the river is located in the westernmost part of the Amazon basin, in Peru. According to Figure 4, there is a strong association between the variability of the Amazonas-Peru river quota with the PAC (PAC +) in the months of June to August (peak
ebb), and the correlations with the NTA are negative and significant
during most of the year, indicating that, as SST anomalies increase, quota anomalies decrease or vice versa. In general, the strongest correlations occur in winter in the southern hemisphere (SH).
Solimões
This region of the river Solimões is located in the central
portion of the basin, close to the confluence with the Negro
River, near Manaus. A positive correlation with the ocean PAC and negative for the TA is clearly visible on Figure 4. The correlations
are higher between April and August (flood months), with the
NTA (-). For the PAC, the correlation values were significant (r>
0.6) between June and July (beginning of the ebb).
Alto Negro
This region is located in the most upstream part of the Negro River basin, near the municipality of São Gabriel da Cachoeira-AM.
Despite the low correlation, some values are significant for the STA, in January and May (flood months), presenting negative
correlation according to Figure 4. Unlike the other regions, the correlation between the PAC and the anomalies of water level
present significant negative values from October to March (end of ebb and beginning of flood period). The correlation of the river
with this ocean is stronger than for the others, especially during the summer in the South Hemisphere.
Negro River
For this analyzed region, the correlation is negative in July
and August (peak flood) with the NTA (Table 3). In PAC, the
correlation is less significant than for the Upper Negro. This finding can be explained by the influence of the other tributaries in
the water level at that place and control by the Solimões River.
Overall, the results show that, for STA, no significant correlation
is detected (Figure 4).
Alto Madeira
This point is located in the most upstream portion of the Madeira River basin. When the series of anomalies of the Madeira River with SST anomalies of the TA and PAC oceans (Table 3) were found, absolute values of the linear correlation
coefficient were positive (r> 0.7) in June and December with the
PAC (Figure 4). For the NTA, negative correlations were found from November to January and from May to August. Unlike the other rivers presented previously, the Madeira River presents negative correlation with the STA in the months of August and September, when the peak of the ebb in the region occurs.
Japurá
Due to its location, this river has little correlation with
the oceans, given the influence of the Andes in the formation
of precipitation (Figure 4). The analysis of the relations with the
oceans shows that, for the NTA, there is a negative, significant
correlation, only in the months of July and August (peak of
flood). For the PAC, there is a positive correlation in April and May. During the study period, there was no significant correlation
in association with STA (Table 3).
Purus
The VCS analyzed is located near the confluence with
the Solimões River. According to Table 3, this river has a strong correlation with the PAC during the months of July to September, when the quotas are minimal. For the NTA, the correlation values are higher in the months of April to August, corresponding to the ebbing period. For the STA, there is no correlation (Figure 4). This indicates that, as the NTA ocean warms during summer in the Northern Hemisphere (NH), water levels in this river are reduced, associated with decreased moisture transport and precipitation.
Xingu
Xingu anomalies showed a strong negative correlation in the months of June and August (months of ebb) with the NTA and the STA (-) during the January, February and March quarter
(flood months). It is also possible to observe, in Figure 4, that
this river is associated with STA conditions in months opposed to those correlated with NTA or PAC. In general, it shows greater relationships with the PAC (+) between August and September
(peak ebb), presenting the highest statistical significance of all
rivers analyzed in this study.
Tapajós
According to Figure 4, there are strong negative and
significant correlations (r <- 0.6) in the months of ebb, between
May and August with the NTA. For the STA, values of r <-0.5 Table 3. Monthly correlation between anomalies of altimetric data quotas in the sub-basins and oceanic regions between 2003 and
2015, statistically significant at the 95% confidence level.
Sub-basin NTA STA PAC
Amazonas-Peru (-)December to January, May to August x (+) June to August
Solimões (-)January to August x (+) June to July
Alto Negro
x (-)January and May (-) October to March
Negro (-) July to August x (-)December to March
Alto Madeira
(-) November to January, April to August (-)August to September (+) June to December
Japurá (-) July and August x (+) April and May
Purus (-) April to August x (+) July to September
Xingu (-) June and August (-) January to March (+) August to September Tapajós (-) May to August (-) February to March (-) December
between the months of February and March (peak of flood) were verified. For the PAC, according to the significance test used, the
correlations are weaker. In general, this river is better correlated with NTA.
Influence of SSTs on maximum extreme events in sub-basins of Amazonia
The effects on the water levels of the Amazon sub-basins caused by the SST variability of the TA and PAC oceans in the last 13 years were also analyzed. The analysis of the extremes of height anomalies was performed according to the heating conditions (PAC+, NTA +, STA +) or cooling (PAC-, NTA-, STA-) of the oceans during periods in which the SST anomalies were larger than 0.5 and less than -0.5 for the period from 2003 to 2015.
Amazonas-Peru River
Figures 5a and 5b show that, in 2005 and in 2011, there were the greatest impacts on the water levels in this region, associated with the anomalous heating of the NTA and the episode of ENOS (Figure 5a). The first explanation for these abrupt reductions is the strong correlation of this river with NTA for several consecutive months, as mentionned in the previous section. The second explanation is that these negative anomalies of water levels in 2011 alone are a response to the ENSO event
that occurred between 2009-2010. In addition, the flood that occurred in 2009 may have influenced this slower response time. In 2012, the effects of the flood were greater than in 2009 and
were associated with the La Niña event between 2010 and 2011 (Figure 5b). Between the end of 2014 and during 2015, the level of
this river reached its maximum value, associated to the cooling of the NTA waters (Figure 5b) and to the heating of the Equatorial
Pacific (PACE) (Figure 5a).
Solimões River
According to Figures 5c and 5d, during the years 2005 and 2010, the effects of drought in the region were as intense as for the Amazon-Peru, with negative anomalies of water levels remaining for consecutive months in 2010 and 2011, associated to the TA heating (Figure 5c). However, the effects of the 2012 flood were not as strong at this point as in the other sub-basins analyzed. In Figure 5d, it is confirmed that the colder waters of the NTA can explain the increases in water levels in the Solimões River.
Alto Negro
The analysis of the time series of the anomalies of water levels of this region shows some peculiarities in relation to the other rivers analyzed. The 2005 drought, highlighted in Figures 6a and 6b, was not as severe as for the rest of the Amazon, where values of anomalies between -1 and -2 were found. According to Marengo et al. (2008), between March and May 2005, precipitation presented values between normal and above normal
(100-110%), thus influencing water levels. It is known that when
the STA is warmer and Northeast trade winds are stronger, there are favorable conditions for the movement of the ZCIT to regions further south of its climatological position. This happened in 2009 and in 2012, however, in 2012, the cooling of the PACE region (Figure 6a) favored positive anomalies in the region due to the increase in moisture transport. In addition, according to Junk et al.
(2011), the upper and middle Negro have lowlying interfluvial areas that extend over several thousands of square kilometers,
causing the river to face long periods of flooding. These factors
may explain why the 2005 drought did not have major effects in this region. In relation to the other rivers, this part was one of the most affected by La Niña in 2012 (Figure 6b). At the end of 2015, the river presented a behavior different from the others: negative anomalies of altitude associated with the anomalous warming of the PACE (Figure 6a). These results are similar to the observations cited in Bulletin Nº 37–02/10/2015 from CPRM (2015). And those rainfall anomalies had a pattern ranging from dry to very dry, which is consistent with the negative anomalies of water levels from data from altimetry.
Negro River
Figures 6c and 6d show that the effects of the 2005 drought were the strongest of the entire time series in the region, associated with the heat of the NTA, while the waters of the STA were colder. Despite the strong correlation with the NTA, it is noteworthy that the 2010 drought in this region was also associated with the El Niño episode 2009-2010 (Figure 6c). Likewise, the
effects of the 2012 flood (Figure 6d) associated with the cooling of the PACE waters (Figure 6d) are highlighted. On the other
hand, the effects of the 2014 flood were not as strong as in the
other regions analyzed. This can be explained by the fact that the location of this reach is at the point most downstream of the
Negro basin, located in the floodplain, influenced not only by
the changes that occur upstream and in smaller tributaries, but also the interference of the water level of the Solimões River that
causes a backwater effect (hydraulic dam) in the Negro River and in all its tributaries (MEADE et al., 1991; PARIS et al., 2016).
Therefore, in this period, there were few variations in the
flooded area that comprise the region and the anomalies did not
have great variations in relation to the climatological average.
However, it is noted that the 2014 flood was strongly
associated with negative SST anomalies in the NTA (Figure 6d).
Alto Madeira
It can be shown in Figure 7a that in the periods when the high Madeira river was below normal, the NTA was warmer, as in 2005 and 2010. It is also noted that 2010 was not abnormal as severely as for the rest of the rivers analyzed here (Figure 7a). This is due to the fact that this river has stronger correlations with the PAC than with the NTA for most of the year. Moreover, according to Junk et al. (2011), the upper Madeira has low interfluvial areas, so that the river takes longer to drain the excess rainfall, allowing the formation of a reservoir in the region during periods of
rainfall deficits, such as in 2010. Ronchail et al. (2005) observed
that the flows are lower than usual on the Madeira River during
La Niña events. These results are consistent with those found in
this study, since during the flood of 2012, which affected much
of the Amazon, the anomalies of the Upper Madeira water levels became negative, between the end of 2011 and the beginning of 2012 (Figure 7b). In 2014-2015, we have the maximum values of anomalies of all series in this region, caused by strong SST anomalies of the NTA (Figure 7b). It is verified that the effects of
this flood were greater in this region than in the others, presenting
anomalies bigger than 2 (Figure 7a and 7b).
Tapajós River
Analyzing Figures 7c and 7d, it can be observed that the
negative anomalies of water level in 2005 were quite significant,
associated to the heating of the NTA and PACE (Figure 7c), in the period when the STA was colder (Figure 7d). Already during the drought of 2010, the anomalies became as negative as in March 2010, persisting until mid-September 2011, in the Upper Tapajós (Figure 7c and 7d). It is worth noting that the Tapajós is negatively correlated with the NTA between the months of May and August, when the smallest negative anomalies were obtained (Figure 7c).
During 2012, water level anomalies peaked at 1.6 in March 2012, when PACE was colder (Figure 7b). During the 2014 flood, positive anomalies were higher and more persistent for this region of the Tapajós River, related to the cooling of the NTA (Figure 7d). It is evidenced that the positive anomalies of water level began in October 2013, reaching maximum values of the whole series history in 2013, when the STA and PAC were anomalously colder.
Japurá River
Considering first the drought that affected the entire
Amazon region in 2005, it can be noted that the effects of the El Niño event in that same year did not impact the levels in the region (Figure 8a), which is explained by the fact that the severe
drought in 2005 was intensified, mainly, by the heat of the NTA, with greater influence in the southern portion of the Amazon.
On the other hand, the effects of the 2010 drought were stronger for this river and may be associated with the heating of the PACE (Figure 8a). The effects of this drought were intensified
during the year 2011 due to the influence of the anomalously
hot conditions of the NTA, which favored the decrease of the precipitation, and consequently that of the levels of the rivers.
In the period of strong positive anomalies between 2014 and 2015 (Figure 8a and 8b), these anomalies resulted from the combination of the impacts associated with the El Niño (PAC +) episode and the cooling of the NTA. It is also noticed that intense anomalous conditions in the oceans tend to intensify the impacts on the quotas, if they occur in a combined way.
Purus River
During the 2009 flood, positive anomalies were quite significant, associated with negative SST anomalies in NTA
(Figure 8d). For the 2010 drought, there are negative anomalies, with values below -3 at the beginning of 2011. In 2011, the drop
in water level in the region was intensified due to the joint effect of
the NTA and STA oceans, both being anomalously warm (NTA +; STA +) during this period (Figure 8c). It is important to point out that the results found in this study are consistent with those observed by CPRM. According to Bulletin No. 01 of 2011 by the CPRM, in January 2011, levels in the stations monitored during
the flooding of the Madeira and Solimões River basins (except
Tabatinga) showed levels lower than recorded on the same date in the year 2010, as well as in relation to the years of the highest
floods (CPRM, 2011).
Also in Figures 8c and 8d, there is an inverse relationship between ocean conditions and height anomalies. In the period
in which NTA is colder (NTA -) and the hotter Pacific (PAC +),
region, as shown in the years 2014 and 2015. When the NTA (PAC -), the tendency is for a decrease in the water level to occur, as indicated in the year 2011. However, it is necessary to have a longer series of water levels for other events to be evidenced and statistical robustness be assessed.
In terms of magnitude of the anomalies of quotas, years 2014 and 2015 presented the highest values of the series associated to the anomalous conditions of PAC (PAC +) heating and cooling of the NTA (NTA -) and occasionally of the STA (STA -), acting together.
Xingu River
The 2005 drought affected much of the Amazon, but not in this region, the easternmost sub-basin of the Amazon basin. It is noted that water levels did not have a large reduction in the Xingu River (Figures 8e and 8f). These negative water level anomalies remained much smaller than for the rest of the Amazon. During
the 2009 flood, the negative SST anomalies in the NTA may have
been determinant for the positive anomalies of quota in this region (Figure 8f). During the same period, STA and PAC were heated
(ATS +; PAC +) (Figure 8e). During the 2010 drought, negative anomalies occurred (Figures 8e and 8f) related to the anomalous heating of NTA (NTA +) and STA (STA +) for this period. In the middle of August the anomalies of quota reached values lower than -1.5, coinciding with the period that the NTA was anomalously hotter. Therefore, the NTA warming and the ENSO episode
were decisive for this extreme drought. During the 2012 flood,
abnormally positive water levels have been observed from the end of 2011 up to mid-2012 (Figure 8f). Between June and July, the anomalies became negative, and from October onward, they became positive again. In this period, the positive and negative anomalies of water level were not systematic.
This behavior of the quota in the region during 2011 and 2012 was also associated with a great variability of PACE
ocean conditions.The effects of the 2014 flood were reduced
in this portion of the basin. Figure 8e shows persistent positive anomalies of water level remaining between 2014 and 2015, which can be associated mainly with the cooling of the NTA, still in 2014 (Figure 8f). However, they were not as persistent as
in other regions, mainly due to the greater influence of the PAC
in the region.
Figure 8. Water level anomaliesconsidering periods of SST anomalies greater than 0.5 and less than -0.5, between 2003 and 2015, for
CONCLUSIONS
The results obtained in the present study point out significant
correlations between the temperature of the oceans and water
levels of certain sub-basins. It was verified that the variations of the water levels during the months of flood and ebbing in each
one of the analyzed sub-basins occurred due to the changes of the oceans and the degree of correlation with them. There were
negative associations with NTA during the flood months for most
of the sub-basins studied, except for the Xingu and Upper Negro basins. During the ebb seasons, the responses to the indices varied according to the region, denoting positive associations with PAC in the Amazonas-Peru, Solimões and Xingu rivers, and negative with NTA in the southern tributaries, such as Xingu and Tapajós. In addition,
it was identified that the episodes of ENSO and the anomalous
heating/cooling of the TA that occurred in the last 13 years induced hydrological extremes that affected the sub-basins in a varied way throughout the Amazon, mainly due to the degree of correlation of association with each oceanic region. Water level anomalies are weaker when ocean conditions are isolated and of low magnitude. However, when SST increases simultaneously in both oceans, we can observe the occurrence of more intense hydrological extremes.
Although the temporal resolution of the altimetric data is not daily and the time series span over 13 years only, the results obtained corroborate that these data are reliable for long-term studies, being a source of data in remote or poorly instrumented areas, a fact very common in Amazon.
Thus, new horizons open beyond that are offered by current operational satellites. Future satellites should provide better spacial and time coverage, as well as improve measurements in the continental and coastal areas. Monitoring of variations of the oceanic state in the meso-scale will be made available through the Surface Water and Ocean Topography (SWOT) satellite, which will collect 2D images of the sea surface at the 1km2 resolution, contributing to the study of hydrological responses in the context hydro climatic studies and improved monitoring of water levels in the Amazon basin.
ACKNOWLEDGEMENTS
The authors thank the Coordination of Improvement of
Higher Education Personnel (CAPES) for the financial support during the first author’s master’s degree. (CTOH) of the Laboratoire
d’Études en Geophysique et Océanographie Spatiales (LEGOS), the Geophysical Data Records (GDR) and the corresponding tropospheric corrections, the European Space Agency (ESA), the European Space Agency Center National d’Etudes Spatiales (CNES), to the Laboratory of Water Resources and Spatial Altimetry of the Amazon (RHASA) for the use of the data of the ENVISAT and Jason-2 missions made available for the study and the students of the RHASA Laboratory for the elaboration of the virtual stations.
REFERENCES
ALSDORF, D. E.; RODRIGUEZ, E.; LETTENMAIER, D. Measuring surface water from space. Reviews of Geophysics, v. 45, n. 2, p. RG2002, 2007. http://dx.doi.org/10.1029/2006RG000197.
ANA – AGÊNCIA NACIONAL DE ÁGUAS. HidroWeb. Brasília: ANA , 2018. Available from: <http://hidroweb.ana.gov.br>. Access on: 30 june 2018.
BAMBER, J. L. Ice sheet altimeter processing scheme. International Journal of Remote Sensing, v. 15, n. 4, p. 925-938, 1994. http://dx.doi. org/10.1080/01431169408954125.
BERRY, P. A. M.; GARLICK, J. D.; FREEMAN, J. A.; MATHERS, E. L. Global inland water monitoring from multi-mission altimetry. Geophysical Research Letters, v. 32, n. 16, p. 1-4, 2005. http://dx.doi. org/10.1029/2005GL022814.
BIRKETT, C. M. Contribution of the TOPEX NASA radar altimeter to the global monitoring of large rivers and wetlands. Water Resources Research, v. 34, n. 5, p. 1223-1239, 1998. http:// dx.doi.org/10.1029/98WR00124.
BIRKETT, C.M.; MERTES, L.A.K.; DENNE, T.; COSTA, M.H.; JASINSKI, M.J. Surface water dynamics in the Amazon basin: application of satellite radar altimetry. Journal of Geophysical Research, v. 107, n. D20, 8059, 2002. http://dx.doi.org/10.1029/2001JD000609,.
BROWN, G. The average impulse response of arough surface and its applications. IEEE Transactions on Antennas and Propagation, v. 25, n. 1, p. 67-74, 1977. http://dx.doi.org/10.1109/TAP.1977.1141536.
CALMANT, S.; SEYLER, F. Continental surface waters from satellite altimetry. Comptes Rendus Geoscience, v. 338, n. 14-15, p. 1113-1122, 2006. http://dx.doi.org/10.1016/j.crte.2006.05.012.
CALMANT, S.; SILVA, J. S.; MOREIRA, D. M.; SEYLER, F.; SHUM, C. K.; CRETAUX, J. F.; GABALDA, G. Detection of Envisat RA2/ICE-1retracked radar altimetry bias over the Amazon basin rivers using GPS. Advances in Space Research, v. 51, n. 8, p. 1551-1564, 2013. http://dx.doi.org/10.1016/j.asr.2012.07.033.
CPRM – SERVIÇO GEOLÓGICO DO BRASIL. SACE: Serviço Geológico do Brasil. Brasil: CPRM, 2011. (Boletim, 1). Available from: <http://www.cprm.gov.br/sace/rehi/manaus/1_alerta_ cheia_%202011.pdf>. Access on: 30 june 2018.
CPRM – SERVIÇO GEOLÓGICO DO BRASIL. SACE:
sistema de alertas de eventos críticos: Bacia do Rio Amazonas,
monitoramento Amazônia Ocidental. Brasil: CPRM, 2015. (Boletim,
37). Disponível em: <http://www.cprm.gov.br/sace/rehi/manaus/
alerta37_2015.pdf>. Acesso em: 30 jun. 2018.
ENFIELD, D.; MESTAS-NUÑEZ, A. Multiscale variabilities in global sea surface temperatures and their relationships with tropospheric climate patters. Journal of Climate, v. 12, n. 9, p. 2719-2733, 1999. http://dx.doi.org/10.1175/1520-0442(1999)012<2719:MVIG SS>2.0.CO;2.
Bolivia, Colombia, and Ecuador). International Journal of Climatology, v. 29, n. 11, p. 1574-1594, 2009. http://dx.doi.org/10.1002/joc.1791.
ESPINOZA, J. C.; GUYOT, J. L.; RONCHAIL, J.; CO-CHONNEAU, G.; FILIZOLA, N.; FRAIZY, P.; LABAT, D.; DEOLIVEIRA, E.; ORDONEZ, J. J.; VAUCHEL, P. Contrasting regional discharge evolutions in the Amazon basin (1974-2004). Journal of Hydrology (Amsterdam), v. 375, n. 3-4, p. 297-311, 2009. http://dx.doi. org/10.1016/j.jhydrol.2009.03.004.
ESPINOZA, J. C.; RONCHAIL, J.; GUYOT, J. L.; JUNQUAS, C.; VAUCHEL, P.; LAVADO, W.; DRAPEAU, G.; POMBOSA, R. Climate variability and extreme drought in the upper Solimões River (western Amazon Basin): Understanding the exceptional 2010 drought. Geophysical Research Letters, v. 38, n. 13, L13406, 2011. http://dx.doi.org/10.1029/2011GL047862.
ESRI – ENVIRONMENTAL SYSTEMS RESEARCH INSTITUTE. ArcGIS 10: Getting started with ArcGIS. Redlands: ESRI, 2012. FARR, T. G.; ROSEN, P. A.; CARO, E.; CRIPPEN, R.; DUREN, R.; HENSLEY, S.; KOBRICK, M.; PALLER, M.; RODRIGUEZ, E.; ROTH, L.; SEAL, D.; SHAFFER, S.; SHIMADA, J.; UMLAND, J.; WERNER, M.; OSKIN, M.; BURBANK, D.; ALSDORF, D. The shuttle radar topography mission. Reviews of Geophysics, v. 45, n. 2, 2007. http://dx.doi.org/10.1029/2005RG000183.
FOLEY, J. A.; BOTTA, A.; COE, M. T.; COSTA, M. H. El Niño-Southern oscillation and the climate, ecosystems and rivers of Amazonia. Global Biogeochemical Cycles, v. 16, n. 4, p. 79-20, 2002. http://dx.doi.org/10.1029/2002GB001872.
FRAPPART, F.; CALMANT, S.; CAUHOPÉ, M.; SEYLER, F.; CAZENAVE, A. Preliminary results of ENVISAT RA-2-derived water levels validation over the Amazon basin. Remote Sensing of Environment, v. 100, n. 2, p. 252-264, 2006. http://dx.doi. org/10.1016/j.rse.2005.10.027.
GLOOR, M.; BRIENEN, R. J. W.; GALBRAITH, D.; FELDPAUSCH, T. R.; SCHÖNGART, J.; GUYOT, J.-L.; ESPINOZA, J. C.; LLOYD, J.; PHILLIPS, O. L. Intensification of the Amazon hydrological cycle over the last two decades. Geophysical Research Letters, v. 40, n. 9, p. 1729-1733, 2013. http://dx.doi.org/10.1002/grl.50377.
JUNK, W. J.; PIEDADE, M. T. F.; SCHÖNGART, J.; COHN-HAFT, M.; ADENEY, J. M.; WITTMANN, F. A classification of major naturally-occurring amazonian lowland wetlands. Wetlands, v. 31, n. 4, p. 623-640, 2011. http://dx.doi.org/10.1007/s13157-011-0190-7.
LAXON, S. Sea ice altimeter processing scheme at the EODC. International Journal of Remote Sensing, v. 15, n. 4, p. 915-924, 1994. http://dx.doi.org/10.1080/01431169408954124.
LEGRÉSY, B.; RÉMY, F. Surface characteristics of the Antarctic ice sheet and altimetric observations. Journal of Glaciology, v. 43, n. 144, p. 265-275, 1997. http://dx.doi.org/10.1017/S002214300000321X.
MARENGO, J. A.; ESPINOZA, J. C. Extreme seasonal droughts and floods in Amazonia: Causes, trends and impacts. International Journal of Climatology, v. 36, n. 3, p. 1033-1050, 2016. http://dx.doi. org/10.1002/joc.4420.
MARENGO, J. A.; NOBRE, A. C. Clima da região Amazônica. In: CAVALCANTI, I. F. A.; FERREIRA, J. F.; JUSTI DA SILVA, M. G. A.; SILVA DIAS, M. A. F. Tempo e clima no Brasil. São Paulo: Oficina de Texto, 2009. cap. 12, p. 197-207.
MARENGO, J. A.; NOBRE, C. A.; TOMASELLA, J.; OYAMA, M. D.; SAMPAIO DE OLIVEIRA, G.; OLIVEIRA, R.; CAMARGO, H.; ALVES, L. M.; BROWN, I. F. The drought of Amazonia in 2005. Journal of Climate, v. 21, n. 3, p. 495-516, 2008. http://dx.doi. org/10.1175/2007JCLI1600.1. PMid:18270160.
MARENGO, J. A.; TOMASELLA, J.; UVO, C. R. Trends in streamflow and rainfall in tropical South America: Amazonia, eastern Brazil, and northwestern Peru. Journal of Geophysical Research, v. 103, n. D2, p. 1775-1783, 1998. http://dx.doi.org/10.1029/97JD02551.
MARENGO, J. A.; TOMSASELLA, J.; SOARES, W.; ALVES, L. M.; NOBRE, C. Extreme climatic events in the Amazon basin. Theoretical and Applied Climatology, v. 107, n. 1-2, p. 73-85, 2012. http://dx.doi.org/10.1007/s00704-011-0465-1.
MEADE, R. H.; RAYOL, J. M.; CONCEICÃO, S. C.; NATIVIDADE, J. R. G. Backwater effects in the Amazon River Basin of Brazil. Environmental Geology and Water Sciences, v. 18, n. 2, p. 105-114, 1991. https://doi.org/10.1007/BF01704664.
MOLINIER, M.; GUYOT, J. L. L.; OLIVEIRA, E.; GUIMARÃES, V. Les r´egimeshydrologiques de l’Amazone et de ses affluents. In: CHEVALLIER, P.; POUYAUD, B. (Ed). L’hydrologie Tropicale: G´eoscience et outil pour le D´eveloppement. Paris: IAHS Publ., 1996. v. 238, p. 209-222.
NAGHETTINI, M.; PINTO, E. J. A. Hidrologia estatística. Belo Horizonte: CPRM, 2007.
NOBRE, C. A.; OBREGÓN, G. O.; MARENGO, J. A.; FU, R.; POVEDA, G. Characteristics of Amazonian climate: main features. In: KELLER, M.; BUSTAMANTE, M.; GASH, J.; SILVA DIAS, P. Amazonia and global change. Washington: American Geophysical Union. 2013. p. 149-162. (Geophysical Monograph Series). http:// dx.doi.org/10.1029/2009GM000903.
OLIVEIRA CAMPOS, I.; MERCIER, F.; MAHEU, C.; COCHONNEAU, G.; KOSUTH, P.; BLITZKOW, D.; CAZENAVE, A. Temporal variations of river basin waters from Topex/Poseidon satellite altimetry: application to the Amazon basin. Comptes Rendus de l’Académie des Sciences - Series IIA - Earth and Planetary Science, v. 333, p. 1-11, 2001. http://dx.doi.org/10.1016/S1251-8050(01)01688-3.
Water Resources Research, v. 52, n. 5, p. 3787-3814, 2016. http:// dx.doi.org/10.1002/2014WR016618.
RONCHAIL, J.; LABAT, D.; CALLEDE, J.; COCHONNEAU, G.; GUYOT, J. L.; FILIZOLA, N.; OLIVEIRA, E. Discharge variability with in the Amazon Basin. In: FRANKS, S.; WAGENER, T.; BOGH, E.; GUPTA, H. V.; BASTIDAS, L.; NOBRE, C.; GALVÃO, C. O. Regional hydrological impacts of climatic change: hydroclimatic variability. Wallingford: IAHS, 2005. p. 21-29.
ROUX, E.; CAUHOPE, M.; BONNET, M. P.; CALMANT, S.; VAUCHEL, P.; SEYLER, F. Daily water stage estimated from satellite altimetric data for large river basin monitoring. Hydrological Sciences Journal, v. 53, n. 1, p. 81-99, 2008. http://dx.doi.org/10.1623/ hysj.53.1.81.
SATYAMURTY, P.; COSTA, C. P. W.; MANZI, A. O. Moisture source for the Amazon Basin: a study of contrasting years. Theoretical and Applied Climatology, v. 111, n. 1-2, p. 195-209, 2013. http://dx.doi.org/10.1007/s00704-012-0637-7.
SEYLER, F.; CALMANT, S.; SILVA, J. S.; MOREIRA, D. M.; MERCIER, F.; SHUM, C. K. From Topex/Poseidon to Jason-2/ OSTM in the Amazon basin. Advances in Space Research, v. 51, n. 8, p. 1542-1550, 2013. http://dx.doi.org/10.1016/j.asr.2012.11.002.
SILVA, J. S.; CALMANT, S.; SEYLER, F.; ROTUNNO FILHO, O. C.; COCHONNEAU, G.; MANSUR, W. J. Water levels in the Amazon basin derived from the ERS 2 and ENVISAT radar altimetry missions. Remote Sensing of Environment, v. 114, n. 10, p. 2160-2181, 2010. http://dx.doi.org/10.1016/j.rse.2010.04.020.
TOMASELLA, J.; BORMA, L. S.; MARENGO, J. A.; RODRIGUEZ, D. A.; CUARTAS, L. A.; A. NOBRE, C.; PRADO, M. C. R. The droughts of 1996–1997 and 2004–2005 in Amazonia: hydrological response in the river main-stem. Hydrological Processes, v. 25, n. 8, p. 1228-1242, 2011. http://dx.doi.org/10.1002/hyp.7889.
UVO, C. B.; TÖLLE, U.; BERNDTSSON, R. Forecasting discharge in Amazonia using artificial neural networks. International Journal of Climatology, v. 20, n. 12, p. 1495-1507, 2000. https://doi. org/10.1002/1097-0088(200010)20:12<1495::AID-JOC549>3.0.CO;2-F.
WILKS, D. S. Statistical methods in the atmospheric sciences. Cambridge: Academic Press, 2011. 676 p.
WINGHAM, D. J.; RAPLEY, C. G.; GRIFFITHS, H. New techniques in satellite altimeter tracking systems. In: International Geoscience and Remote Sensing Symposium (IGARSS), 1986, Zurich. Proceedings… Paris: European Space Agency, 1986. p. 1339-1344.
Authors contributions
Mylena Vieira Silva: Characterization of the study area, data acquisition, analysis and interpretation of the results. Writing and manuscript structure.
Adrien Paris: Collaboration in the acquisition of data and search of the statistical method for data analysis.
Stéphane Calmant: Elaborator of the initial idea of research, collaboration in data acquisition and reviewer of the article.
Luiz Antonio Cândido: Collaborated in the discussion of statistical methods and results, and conclusion of the results.
Joecila Santos da Silva: Contribution in the conception, analysis and
conclusion of the results. Manuscript revision and final approval