Conducting Behavior of Crystalline α-PbO
2as Revealed by DFT Calculations
João Manuel Marques Cordeiroa*, Douglas Henrique Marcelino de Azevedoa,
Tatiana Conceição Machado Barrettoa, Julio Ricardo Sambranob
Received: July 11, 2017; Revised: October 30, 2017; Accepted: November 10, 2017
PbO2 is one material that has recently emerged as potential transparent conducting oxide for applications in the modern opto-electronic industry. In this work the electronic structure of the
α-PbO2 polymorph has been investigated, aiming to contribute to the understanding of its high levels
of conductivity. DFT calculations using B3LYP hybrid density functional and considering long range interactions among the atoms have been performed. A direct band gap of 0.90 eV has been found, compatible with high conductivity values. Although the stoichiometric material is somewhat transparent,
the band structure indicates that appropriated modifications in the material Fermi level can be performed
in order to decrease the absorption of light. Charge distribution plus overlap population analysis show that the material is predominantly ionic. The charge distribution throughout the material is strongly
dependent on the crystal direction. Results suggest that α-PbO2 can be potentially more interesting
for opto-electronic purposes than the β polymorph.
Keywords: Lead dioxide, transparent conducting oxides, density functional theory, optical band gap
*e-mail: [email protected]
1. Introduction
The modern optoelectronic technology is highly dependent on transparent conducting oxides (TCOs), compounds which combine transparency and conductivity, properties that normally do not coexist. Initially that technology was mainly based on In2O3, a rather expensive material due to the scarcity of indium in the earth (In is obtained as a by-product
of refining other metals like Zn and Pb, for example, and the
amount of In available in the minerals is not known). Because of that it has been intensely sought alternative materials to replace it.1 SnO
2 and ZnO are among the materials that have
proved to be quite competitive as substituents to In2O3. Low coast and recent progress in improving performance make them attractive substitutes for the indium based TCOs.2
However, the investigation has not over and new materials are insistently sought after. Among the new investigated materials, PbO2 arises as a very promising one, which electrical properties have been explored very recently.3-8 PbO
2
has a high chemical stability and because of the lower coast of Pb compared to In, achieving optical transparency with
high electrical conductivity could have important reflexes
in optoelectronic industry in the medium-term. Even though Pb is not environmentally friendly, it is highly likely that
the economic benefits outweigh the expense of the logistics involved in recycling. Above all, it is highly significant, from a social point of view, finding new and cheaper materials
that can guarantee to countries with lower purchasing power access to the most modern technologies.
An orthorhombic (columbite) α, a tetragonal (rutile) β, and a high-pressure γ modification polymorphs of PbO2 have
been identified. Both the α-phase (space group Pbcn), and β-phase (space group P42/mnm) are stable under normal conditions, the β-phase being the most stable in acid medium and the α-PbO2 prevailing in neutral/alkaline solutions.
9 The
active material of positive plate of the lead-acid batteries is
a mixture of α- and β-PbO2. 10
Most of the TCO's are n-type semiconductors having a band gap of the order of ~3 eV, optical transmittance in the visible region higher than 80%, and electrical resistance
less than or equal to 10-3 Ω.cm.11 From the carried out
studies reported up to now is very well established that
β-PbO2 is intrinsically metallic or a narrow band gap (NB)
semiconductor,6-8 with a band gap of 0.61 eV, and a carrier
concentration about 1021 cm-1.12 NB semiconductors are
colored or black when closed to stoichiometry, which is
the case of β-PbO2, but may potentially become transparent
when donor doped to high carrier concentrations, as it has been found for CdO,13,14 thanks to the blue-shift of the optical
band gap, following the Moss-Burstein effect.15,16 The shift
arises because the Fermi energy lies in the conduction band
for heavy n-type doping and, consequently, the filled states
block optical excitation. Thus, the band gap determined from the onset of interband absorption moves to higher energy.
aFaculdade de Ciências Naturais e Engenharia, Universidade Estadual Paulista - UNESP, 15385-000,
Ilha Solteira, SP, Brazil
bGrupo de Modelagem e Simulação Molecular, Universidade Estadual Paulista - UNESP, 17033-360,
However, achieving optical transparency also depends on the conduction band structure. The optical transparency is
guaranteed since the transitions from the filled conduction
band states to the next highest conduction band lie above the threshold for visible light absorption.17,18
β-PbO2 typically displays degenerate n-type conductivity
attributed to oxygen vacancies. The oxygen stoichiometry is critical to the conductivity, since each lack of oxygen contribute with two free electrons. The calculated Fermi energy lies deep in the conduction band, which is consistent with high levels of electrical conductivity.8
However, if on one hand, there are still many gaps to be
filled concerning to the electronic properties of β-PbO2, on
the other hand no study was found in the literature related to
those properties of α-PbO2. In this paper are being reported
the first results related to a systematic investigation on the α-PbO2 electronic properties, as revealed by calculations
based in density functional theory (DFT), aiming to evaluate its potential to be applied as TCO.
2. Model and Computational Method
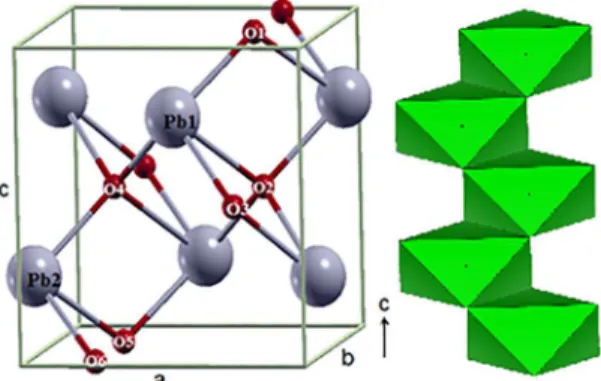
As already stated in the introduction, α-PbO2 has an
orthorhombic symmetry with 4 formula units per unit cell.
Neighbor unit cells share non-opposing edges, resulting in the formation of zigzag chains, according to Figure 1. The material consists of Pb or O interleaved planes in the direction [001] and a sequence of PbO2 planes in the direction [111] with Pb atoms hexa-coordinated and O atoms tetra-coordinated. The computational simulations were performed in the framework of the periodic DFT implemented in the
crystalline orbital computer code CRYSTAL14.19 DFT is
a powerful methodology to simulate structural, energetic and electronic properties of solid state materials with high accuracy, thanks to the advent of functionals based on the generalized gradient approximation.20,21 A deep analysis on
the reproducibility of DFT calculations of solids has been published recently.22,23 Crystalline orbitals were represented
as a linear combination of Bloch functions defined in terms
of local functions (atomic orbitals) using Gaussian-type basis set.24
Taking into account that the choice of the proper functional is fundamental for the quality of the results, two of them have been tried for us: the B3LYP,25,26 and the
HSE0627 ones. B3LYP is a very popular functional used with
DFT for studying solids. It is a type of approximation to the exchange-correlation energy, based in the scheme introduced by Axel Becke in 1993.25 A comprehensive analysis of the
performance of B3LYP functional for a broad set of molecules has been reported by Jorgensen and Tirado-Rives.28
On the other hand, HSE06 is a functional derived from the PBE one,29-31 that apply a screened Coulomb potential
to the exchange interaction in order to screen the long-range part of the Hartree-Fock exchange.27 This functional was
implemented into CRYSTAL in the 2014 version. When
using the B3LYP functional the long range interactions were considered by adopting the Grimme approach32,33 (in this case
the functional is named B3LYP-D).34 In this approaching the DFT total energy is augmented with a semi-empirical dispersion term based on an additive atom-atom damped empirical potential, according to:34
(1)
where the summation is over all atom pairs and g lattice vectors excluding the i = j contribution for g = 0, s6 is a scaling factor related to the functional used, c6ij is the dispersion
coefficient for the pair ij computed by using a geometric
mean and Rij,g is the interatomic distance between atoms i in the reference cell and j in the neighboring cells at distance ||g||. The dumping function fdmp is used to avoid singularities for small Rij,g distances. Such function is implemented in the
CRYSTAL14 package as:34
(2)
were d is the constant that determines the steepness of the dumping function, and RvdW is the sum of van der
Waals atomic radii for atom pair ij. For the calculations
the dispersion term used was s6 = 1.05 (concerning to the B3LYP hybrid functional) and the steepness of the dumping function d = 20. Quite recently a new routine has been implemented for Grimme (named D3), where the atomic
radius of each atom is adjusted accordingly to the chemical
surroundings and the atomic coordination number.20,21 This
methodology has not been used in the present simulations, since it is not implemented in the commercial version of
CRYSTAL14, but may be applied in the future, which may lead to better results. A cutoff radio of 25.0 Å was used to
truncate the summation over the lattice vectors.35 The R vdW
and c6ij parameters used for Pb were those optimized for
PbO by Canepa et al.36 Although these parameters have
not been specifically optimized for α-PbO2 and so do not
account exactly its chemical environment, they improved
the description of the α-PbO2 properties compared to not
E
s
R
c
f
R
,
, disp
ij g ij
g
dmp ij g
j i N
i N
6 6
6
1 1
1 at at
=-= + =
-Q V
/
/
/
f
R
e
1
1
, /
dmp
Q
ij gV
=
+
-d RR ij g, RvdW-1WFigure 1. The unit cell and zigzag chain of α-PbO2 (some atom
consider dispersion factor. The C6 and RvdW parameters used for Pb were, respectively, 63.16 and 1.767,36 and for O were
0.70 and 1.342.33
A full optimization procedure was carried out to determine the equilibrium geometry. All structures were optimized by the use of analytical energy gradients with respect to atomic coordinates and unit cell parameters. Convergence was checked on gradient components and nuclear displacements with tolerances on their root mean square set to 0.0001 and 0.0009 a.u., respectively. The level of accuracy of the calculation
of Coulomb and the exchange series is controlled by five parameters. The 8, 8, 8, 8, and 14 parameters were chosen
for the Coulomb overlap, Coulomb penetration, exchange
overlap, first exchange pseudo-overlap, and second exchange
pseudo-overlap, respectively. The shrinking (Monkhorst-Pack and Gilat)37 was set up to 6, which corresponds to 40
independent k-points in the irreducible part of the Brillouin zone integration.
Mulliken population analysis was used. This choice was based on the simplicity, frequent application in theoretical calculations of similar systems, and convenient interpretation of the results on the light of chemical intuition. The XCrysDen program was used to draw the draft of the band structure, density of states (DOS) graphics, and maps of charge density distribution.38
Since the choice of the optimal basis set is difficult for
such crystalline materials, several of them have been tested to simulate the material. Two all-electron basis sets have been tried for oxygen: a 6-31G* basis set optimized by Gatti et al.39 and the Triple Zetta Plus Polarization (TZVP)
reported by Peintinger et al.40 In turn Pb was described for
an effective core pseudopotential DB31G* (where DB stands for Durand-Barthelat's large effective core potential),41 the
HAYWLC-211(1d)G,42 and the ECP60MDF-6111(51d)G.43 Pb was treated in the framework of core pseudopotential approximation, because its number of electrons makes the simulations very expensive. The lattice parameters reported by Scanlon et al.4 were fitted to decide on the better computational conditions for the simulations. To the best of our knowledge these are the only experimental properties that have been published for the material. Even the value
of the band gap, which would be extremely useful to judge
about the quality of results, is unknown. The analysis of the results permits to conclude that the B3LYP-D functional with oxygen 6-31G* and the DB31G* pseudopotential for lead were the computational conditions which provided the
best agreement between the theoretical and experimental crystalline structure and were used for calculation of the reported results. Just to give an idea of the divergence, results
obtained for α-PbO2 with B3LYP and HSE06 functionals
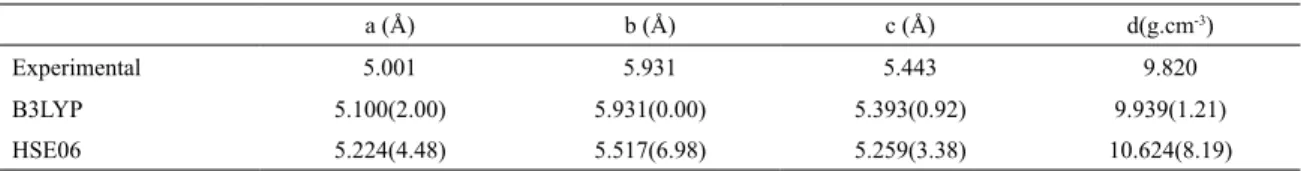
using those basis set are shown in the Table 1.
3. Results and Discussion
The experimental lattice parameters for α-PbO2, have been
recently obtained using neutron diffraction at ISIS Spallation
Neutron Source - Rutherford-Appleton Laboratory (UK),4 facility which has also been used for us to investigate the structure of other systems.44-47Table 1 shows the set of cell parameters of experimental and calculated results obtained for the oxide.
As it can be noticed from the Table, the parameters calculated with B3LYP-D functional show a better agreement with the experimental data available than the results obtained
with HSE06 one, which determined the choose of the first
functional to perform the simulations. This functional has been very successful in describing electronic and structural properties of several oxides and other materials.34,48-50 It deserves to point out that calculations without considering long range weak interactions give cell parameters in better agreement with the experimental ones (calculations were performed using the same input script excepting the GRIMME calculation routine). However, it was opted for keeping this routine in the simulations since describing
better the interactions between the atoms must reflect in a
better quality of the calculated electronic properties (also the comparison with HSE06 functional is more appropriated, since this functional considers long range weak interactions in its formalism).
The band structure of α-PbO2 obtained from the
calculations is shown in Figure 2. Both the top of valence band and the bottom of the conduction band are situated
on the same Г point, resulting in a direct band gap of 0.90
eV. It is worth remembering that pure density functionals like GGA and LDA usually underestimate band gaps, while hybrid functionals, as the B3LYP used in this work, usually provide a good agreement with experimental values.34,48-50
However, calculations performed in parallel for β-PbO2 using
both B3LYP and HSE06 functionals gave a band gap value of 0.21 eV, while the experimental value is 0.61 eV.4 Thus,
both the functionals tried for us underestimated the β-PbO2
band gap for about 66% respecting to the experimental value.
Table 1. Experimental4 and calculated (oxygen 6-31G* and lead DB31G*) equilibrium lattice parameters and density for α-PbO2.
Percentage deviation (%) in parenthesis.
a (Å) b (Å) c (Å) d(g.cm-3)
Experimental 5.001 5.931 5.443 9.820
B3LYP 5.100(2.00) 5.931(0.00) 5.393(0.92) 9.939(1.21)
Taking into account this result it can be considered that the
α-PbO2 band gap is at least 0.90 eV. In other words, can be
inferred that the α-PbO2 is less metallic than β-PbO2, which is
a sufficient reason to suppose that α-PbO2 would be a better
candidate for TCO than β-PbO2. Interestingly, it has been
reported that β-PbO2 (plattnerite) is black and opaque, while
α-PbO2 (scrutinyite) is brown and somewhat transparent. 51
The topography of the α-PbO2 band structure on the Г
point is very similar to that of β-PbO2, however, while in the
β-PbO2 there is a range of about 6 eV between the bottom
of the conduction band to the next highest portion of the band (Eintra), in the α-PbO2 that range is only about 4.7 eV.
Thus, according to what has been discussed for Walsh et al.3
it should be easier to manipulate the transparency in α-PbO2
(controlling the oxygen vacancies or doping, for instance), thanks to move the electron chemical potential inside the
conduction band, than to β-PbO2. As it can be seen in the
graphic, the theoretical valence band width is roughly 8.75
eV. Theoretical values reported for β-PbO2 are 8.02 eV and
8.45 eV, depending on the functional used.4 The conduction band shows a partition into two distinct regions separated by about 3 eV, which will be commented below when discussing the features of the density of states.
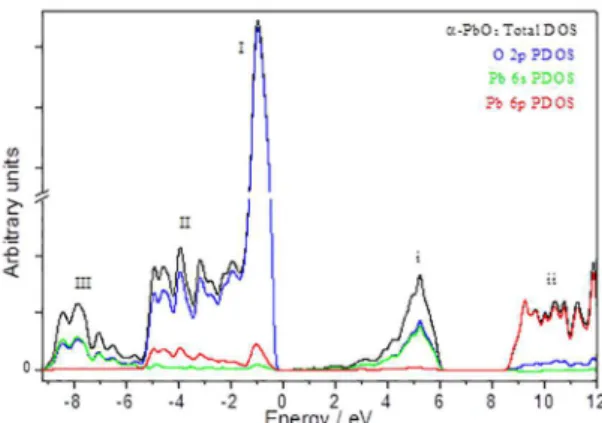
Total DOS profile and the most relevant projected
DOS (PDOS) for Pb and O atoms are depicted in Figure 3.
Following the notation adopted by Payne et al for β-PbO2, 7 it
has been identified three main features (labeled I - III) in the
valence states of the total DOS profile. Region III is basically composed by a mix of 50% Pb 6s and 50% O 2p orbitals,
Figure 2. Band structure of α-PbO2, with the energy scale set so
that the Fermi level corresponds to 0.0 eV. (left and right graphics
differ in the plotted energy range).
Figure 3. Total and partial DOS diagram for α-PbO2.
showing that the states of lower energy are predominantly occupied for electrons equally distributed for those orbitals (it is usual to speak in terms of orbital hybridization). Region II is predominantly composed by oxygen 2p orbitals, with a residual contribution of the lead 6p orbitals, while in the highest energy band closest to the Fermi surface (region I), the contribution of lead 6p orbitals is, proportionally, even smaller, indicating a strong asymmetry in the electron distribution among the atoms. Thus, the energy states near the top of the valence band are predominantly occupied for electrons located in oxygen 2p orbitals. It deserves to pay attention that in the case of PbO2, both lead 6s and 6p orbitals are, stoichiometric speaking, empty. Thus, it is
understandable there are significant differences between the
DOS distribution of this material and PbO, as it has been
found, for example, by Watson and Parker.52
On the other hand, the conduction band shows two well
defined regions, being that the empty states in the bottom
(region i) are composed by equal contributions of O 2p and Pb 6s orbitals, while the states at higher energy (region ii) are predominantly composed of Pb 6p orbitals. It is remarkable the partition of the conduction band states into two distinct regions separated by a range of about 3 eV. Clearly this
separation is related to that seen in the band structure profile,
which has been highlighted above.
For a deeper comprehension of the electronic distribution throughout the material it has been plotted maps of electronic
density distribution for some planes of α-PbO2 (Figure 4).
Some other planes have also been investigated, presenting
the same profile. As a general behavior, it is noticed that the density isolines profiles show a well-defined charge
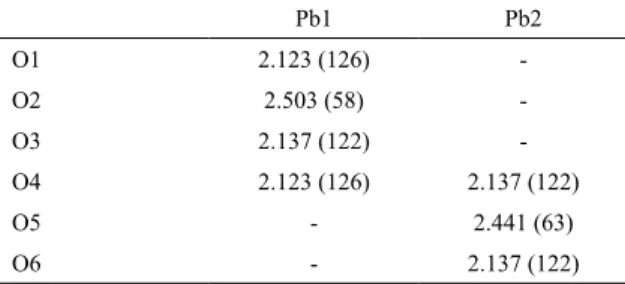
distribution around the Pb and O atoms, an indication of the ionic character of the atomic interactions, accordingly to analysis done above. Thus, there is an asymmetry on the charge distribution through the material depending on the crystal direction. Aiming to detail further these founds it has been calculated the Pb - O overlap populations, which results are listed in the Table 2 (see unit cell shown in Figure 1 for atom numbering). Firstly, the values of the overlap population
are about of that obtained for other studied oxide, ZnO (143 m|e|),53 while the C - C overlap population of carbon
nanotubes, a typical covalent bond is bigger than 400 m|e|.53
Figure 4. Charge density maps for 3 different α-PbO2 planes (red
denotes an excess of negative charge and blue a deficiency of it).
This result corroborates that Pb - O bond in α-PbO2 has a
ionic character. Secondly, there is a distinct difference among three of the oxygens (O1, O3 and O4) and O2 concerning
to the Pb1 - O bond. The same behavior is observed also in the Pb - O bonds evolving Pb2, namely, the O2 - Pb1 and O5 - Pb2 bonds present a character yet slightly more ionic than the other bonds studied. This result is directly related to the bond lengths, shorter than the other Pb - O bonds, leading
to an different charge distribution in each case.
Finally, the partial charges on the atoms calculated using Mulliken population analysis results -0.95 for oxygen and 1.90 for lead, yet indicating a predominate ionic character of the bonds. Obviously, these results should be viewed with caution, since the choice of Mulliken partition is arbitrary and the results depend on the basis set used. Besides, there is no unique method of performing the partition of the charge density. Even so, the choice of a particular scheme is still useful to support an argument.
4. Concluding Remarks
Electronic structure of α-PbO2 has been studied by
periodic DFT calculations. α-PbO2 presented a theoretical
band gap of 0.90 eV. The topography of the band structure suggests that transparency and conductivity can be achieved.
Significant population of states at the top of the valence band
arises from oxygen 2p states. The empty states are virtually composed of lead 6p and 6s, with a predominance of 6p orbitals. Maps of charge density for several planes shown
that the material is predominantly ionic, which is confirmed
by the overlap populations analysis. The charge distribution throughout the material depends on the crystal direction. Taking into account all these aspects, it may be expected
a better suitability of α-PbO2 to be applied as TCO than
β-PbO2. Several experimental techniques should be able of
confirm these theoretical founds. The methodology used in
the present case has also been used for studies of surfaces, doping and adsorption process, for example, and that will be the next goal in the investigation of the properties of both PbO2 phases. The results obtained could suggest new properties and functionalities of these materials.
5. Acknowledgments
This work is supported by Brazilian Funding Agencies:
CNPq (46126-4), CAPES (787027/2013, 8881.068492/2014-01), FAPESP (2013/07296-2, 2016/07476-9). The computational
facilities were supported by resources supplied by Molecular Simulations Laboratory, São Paulo State University, Bauru, Brazil, and Laboratory of Computational Chemistry, São Paulo State University, Ilha Solteira, Brazil. JMMC is deeply grateful to Dr. Armando Beltrán, from University Jaume I, Castellon de la Plana, Spain, for his kind and fruitful discussions.
6. References
1. Berry JJ, Ginley DS, Burrows PE. Organic light emitting
diodes using a Ga:ZnO anode. Applied Physics Letters.
2005;92(19):193304.
2. Fortunato E, Ginley D, Hosono H, Paine DC. Transparent Conducting Oxides for Photovoltaics. MRS Bulletin. 2007;32(3):242-247.
3. Walsh A, Kehoe AB, Temple DJ, Watson GW, Scanlon DO.
PbO2: from semi-metal to transparent conducting oxide by defect chemistry control. Chemical Communications.
2013;49(5):448-450.
4. Scanlon DO, Kehoe AB, Watson GW, Jones MO, David WIF,
Payne DJ, et al. Nature of the Band Gap and Origin of the Conductivity of PbO2 Revealed by Theory and Experiment.
Physical Review Letters. 2011;107(24):246402.
5. Rothenberg S, Payne DJ, Bourlange A, Egdell RG. A study of
the metal to nonmetal transition in Bi-doped β-PbO2 by high
resolution x-ray photoemission. Journal of Applied Physics. 2007;102(11):113717.
6. Payne DJ, Egdell RG, Paolicelli G, Offi F, Panaccione G,
Lacovig P, et al. Nature of electronic states at the Fermi level
of metallic β-PbO2 revealed by hard x-ray photoemission
spectroscopy. Physical Review B. 2007;75(15):153102.
7. Payne DJ, Egdell RG, Law DSL, Glans PA, Learmonth T, Smith KE, et al. Experimental and theoretical study of the electronic
structures of α-PbO and β-PbO2. Journal of Materials Chemistry.
2007;17:267-277.
8. Payne DJ, Egdell RG, Hao W, Foord JS, Walsh A, Watson GW. Why is lead dioxide metallic? Chemical Physics Letters.
2005;411(1-3):181-185.
9. Costa FR, Silva JM. Factors governing the formation of the
β-PbO2 phase electroformed galvanostatically on the carbon
cloth substrate. Química Nova. 2012;35(5):962-967.
10. D'Alkaine CV, Cordeiro JMM. Active-passive transition of lead in sulfuric acid solutions. in: Bullock KR, Pavlov D, eds. Advances in Lead Acid Batteries, Electrochemical Society Proceedings.
Pennigton: Electrochemical Society; 1984. p. 190-200.
11. Chopra KL, Major S, Pandya DK. Transparent conductors - A
status review. Thin Solid Films. 1983;102(8):1-46.
Table 2. Average Pb–O bond length (Å) and overlap population (m|e|) of α-PbO2
Pb1 Pb2
O1 2.123 (126)
-O2 2.503 (58)
-O3 2.137 (122)
-O4 2.123 (126) 2.137 (122)
O5 - 2.441 (63)
12. Payne DJ, Paolicelli G, Offi F, Panaccione G, Lacovig P, Beamson G, et al. A study of core and valence levels in β-PbO2 by hard
X-ray photoemission. Journal of Electron Spectroscopy and Related Phenomena. 2009;169(1):26-34.
13. Burbano M, Scanlon DO, Watson GW. Sources of Conductivity
and Doping Limits in CdO from Hybrid Density Functional Theory.
Journal of the American Chemical Society. 2011;133(38):15065-15072.
14. Yang Y, Jin S, Medvedeva JE, Ireland JR, Metz AW, Ni J, et
al. CdO as the Archetypical Transparent Conducting Oxide. Systematics of Dopant Ionic Radius and Electronic Structure
Effects on Charge Transport and Band Structure. Journal of the American Chemical Society. 2005;127(24):8796-8804.
15. Moss TS. The Interpretation of the Properties of Indium Antimonide. Proceedings of the Physical Society. Section B.
1954:67(10):775-782.
16. Burstein E. Anomalous Optical Absorption Limit in InSb.
Physical Review. 1954;93(3):632-633.
17. Kílíç C, Zunger A. Origins of coexistence of conductivity and
transparency in SnO2. Physical Review Letters. 2002;88(9):095501.
18. Segev D, Wei SH. Structure-derived electronic and optical
properties of transparent conducting oxides. Physical Review B. 2005;71(12):125129.
19. Dovesi RS, Saunders VR, Roetti C, Orlando R, Zicovich-Wilson CM, Pascale F, et al. CRYSTAL14 User's Manual. Turin:
University of Torino; 2014.
20. Maul J, Erba A, Santos IMG, Sambrano JR, Dovesi R. In silico infrared and Raman spectroscopy under pressure: the case of CaSnO3 perovskite. Journal of Chemical Physics.
2015;142(1):014505.
21. Albuquerque AR, Bruix A, Sambrano JR, Illas F. Theoretical Study of the Stoichiometric and reduced Ce-doped TiO2 anatase (001) surfaces. Journal of Physical Chemistry C.
2015;119(9):4805-4816.
22. Lejaeghere K, Bihlmayer G, Björkman T, Blaha P, Blügel S,
Blum V, et al. Reproducibility in density functional theory calculations of solids. Science. 2016;351(6280):aad3000. DOI:
10.1126/science.aad3000
23. Souza SF, Fernandes PA, Ramos MJ. General Performance of Density Functionals. Journal of Physical Chemistry A.
2007;111(42):10439-10452.
24. Pisani C, Dovesi R, Roetti C. Hartree-Fock Ab Initio Treatment of Crystalline Systems. Berlin Heidelberg: Springer-Verlag; 1988.
25. Becke AD. Density-functional thermochemistry. III. The role of exact exchange. Journal of Chemical Physics.
1993;98(7):5648-5652.
26. Lee C, Yang W, Parr GR. Development of the Colle-Salvetti
correlation-energy formula into a functional of the electron density. Physical Review B. 1988;37(2):785-789.
27. Heyd J, Scuseria GE, Ernzerhof M. Hybrid functionals based on a screened Coulomb potential. Journal of Chemical Physics. 2003;118(18):8207-8215.
28. Tirado-Rives J, Jorgensen WL. Performance of B3LYP Density
Functional Methods for a Large Set of Organic Molecules.
Journal of Chemical Theory and Computation.
2008;4(2):297-306.
29. Perdew JP, Ernzerhof M, Burke K. Rationale for mixing exact exchange with density functional approximations. Journal of Chemical Physics. 1996;105(22):9982-9985.
30. Ernzerhof M, Perdew JP, Burke K. Coupling-constant dependence of atomization energies. International Journal of Quantum Chemistry. 1997;64(3):285-295.
31. Ernzerhof M, Scuseria GE. Assessment of the Perdew-Burke-Ernzerhof exchange-correlation functional. Journal of Chemical Physics. 1999;110(11):5029-5036.
32. Grimme S. Accurate description of van der Waals complexes
by density functional theory including empirical corrections.
Journal of Computational Chemistry. 2004;25(12):1463-1473.
33. Grimme S. Semiempirical GGA-type density functional constructed with a long-range dispersion correction. Journal of Computational Chemistry. 2006;27(15):1787-1799.
34. Albuquerque AR, Garzim ML, Santos IMG, Longo V, Longo E,
Sambrano JR. DFT Study with Inclusion of the Grimme Potential on Anatase TiO2: Structure, Electronic, and Vibrational Analyses.
Journal of Physical Chemistry A. 2012;116(47):11731-11735.
35. Civalleri B, Zicovich-Wilson CM, Valenzano L, Ugliengo
P. B3LYP augmented with an empirical dispersion term (B3LYP-D*) as applied to molecular crystals. CrystEngComm.
2008;10(4):405-410.
36. Canepa P, Ugliengo P, Alfredsson M. Elastic and Vibrational
Properties of α- and β-PbO. Journal of Physical Chemistry C.
2012;116(40):21514-21522.
37. Monkhorst HJ, Pack JD. Special points for Brillouin-zone integrations. Physical Review B. 1976;13(2):5188-5192.
38. Kokalj A. XCrySDen-a new program for displaying crystalline
structures and electron densities. Journal of Molecular Graphics and Modelling. 1999;17(3-4):176-179.
39. Gatti C, Saunders VR, Roetti C. Crystal field effects on the
topological properties of the electron density in molecular crystals: The case of urea. Journal of Chemical Physics.
1994;101(12):10686-10696.
40. Peintinger MF, Oliveira DV, Bredow T. Consistent Gaussian
basis sets of triple-zeta valence with polarization quality for solid-state calculations. Journal of Computational Chemistry.
2013;34(6):451-459.
41. Nizam M, Bouteiller Y, Silvi B, Pisani C, Causa M, Dovesi
R. A theoretical investigation of electronic structure and some
thermodynamical properties of β-PbF2. Journal of Physics C: Solid State Physics. 1988;21(31):5351-5359.
42. Piskunov S, Heifets E, Eglitis RI, Borstel G. Bulk properties
and electronic structure of SrTiO3, BaTiO3, PbTiO3 perovskites:
an ab initio HF/DFT study. Computational Materials Science.
2004;29(2):165-178.
43. Sophia G, Baranek P, Sarrazin C, Rérat M, Dovesi R.
44. Cordeiro JMM, Soper AK. A hybrid neutron diffraction and
computer simulation study on the solvation of N-methylformamide in dimethylsulfoxide. Journal of Chemical Physics.
2013;138(4):044502.
45. Borges A, Cordeiro JMM. Hydrogen bonding donation of
N-methylformamide with dimethylsulfoxide and water. Chemical Physics Letters. 2013;565:40-44.
46. Cordeiro JMM, Soper AK. Investigation on the structure
of liquid N-methylformamide-dimethylsulfoxide mixtures.
Chemical Physics. 2011;381(1-3):21-28.
47. Almeida GG, Cordeiro JMM. A Monte Carlo revisiting of
N-methylformamide and acetone. Journal of the Brazilian Chemical Society. 2011;22(11):2178-2185.
48. Moura KF, Maul J, Albuquerque AR, Casali GP, Longo E, Keyson
D, et al. TiO2 synthesized by microwave assisted solvothermal method: Experimental and theoretical evaluation. Journal of Solid State Chemistry. 2014;210(1):171-177.
49. Floriano EA, Scalvi LVA, Saeki MJ, Sambrano JR. Preparation
of TiO2/SnO2 Thin Films by Sol-Gel Method and Periodic B3LYP Simulations. Journal of Physical Chemistry A.
2014;118(31):5857-5865.
50. Ferrer MM, Santana YVB, Raubach CW, La Porta FA, Gouveia AF, Longo E, et al. Europium doped zinc sulfide: a correlation
between experimental and theoretical calculations. Journal of Molecular Modeling. 2014;20:2375.
51. Miundat.org. Scrutinyite. Available from: <http://www.mindat. org/min-3598.html>. Access in: 02/01/2017.
52. Watson GW, Parker SC. Origin of the Lone Pair of α-PbO from
Density Functional Theory Calculations. Journal of Physical Chemistry B. 1999;103(8):1258-1262.