INTRODUCTION
Semiconductor nanoparticles have attracted much attention in the industrial and energy production applications [1-3]. ZnO nanoparticles exhibit excellent electrical, opticaland chemical properties, widely applied to produce semiconductors, optical devices, piezoelectric devices, surface acoustic wave devices, sensors, transparent electrodes and solar cells [4-6]. Besides, ZnO nanoparticles also exhibiting antimicrobial activities against Escherichiacoli and Staphylococcus aureus [7-11]. Several researchers reported doping of ZnO with metals such as Mn, Co, Cr, Cu, In and Laby various methods such as hydrothermal, sol-gel and coprecipitation method but only few reports are available ZnO doped with Al and Y [12-16].
In view of the above, pure and Y-doped ZnO nanoparticles synthesized by cost effective co-precipitation method and characterized by XRD, TEM, UV-Vis and bacterial activities were investigated. Results are presented in this paper.
EXPERIMENTAL
Samples with compositional formula Zn1-xYxO, with x =
0.00, 0.05, 0.10 and 0.15 were prepared by co-precipitation route in an alcoholic medium. In this procedure, zinc acetate dehydrate dissolved in methanol (100 mL) and NaOH in methanol (100 mL) were prepared and added by stirring with heating at 52 oC for 2 h. The precipitate separated from the solution by iltration, washed several times with distilled water and ethanol then dried in air at 127 oC to obtain ZnO nanoparticles. The samples obtained were annealed at 450 oC for 8 h. For the synthesis of Y-doped ZnO nanoparticles, zinc acetate dehydrate and yttrium acetate tetrahydrate were dissolved in methanol (100 mL) and NaOH in methanol (100 mL) were prepared and added by stirring with heating at 52 oC for 2 h. The precipitate separated from the solution by iltration, washed several times with distilled water and ethanol then dried in air at 127 oC to obtain Y-doped ZnO nanoparticles. The samples were annealed at 450 oC for 8 h.
Structural, optical and antibacterial properties of yttrium
doped ZnO nanoparticles
(Propriedades estruturais, ópticas e antibacterianas de
nanopartículas de ZnO dopadas com ítrio)
V. D. Mote1*, Y. Purushotham2, R. S. Shinde3, S. D. Salunke3, B. N. Dole4
1Department of Physics, Dayanand Science College, Latur - 413 512, India
2Centre for Materials for Electronics Technology, Cherlapally, Hyderabad - 500 051, India 3Department of Chemistry, RajarshiShahuMahavidyalay, Latur - 413 512, India 4Advanced Materials Research Laboratory, Department of Physics, Dr. B. A. M. University,
Aurangabad - 431 004, India
*corresponding author: [email protected]
Abstract
Yttrium-doped ZnO nanoparticles were synthesized by co-precipitation method to investigate structural, optical and antibacterial properties. X-ray diffraction analysis conirms hexagonal (wurtzite) structure with average crystallite size between 16 and 30 nm. Optical energy band gap decreaseswith increasing Y-doping concentration. ZnO nanoparticles were found to be highly effective against S. aureus and Y-doped ZnO nanoparticles against E. coli, B. subtilis and S. typhi. Undoped and Y-doped ZnO nanoparticles are good inorganic antimicrobial agents and can be synthesized by cost effective co-precipitation method.
Keywords: nanoparticles, ZnO, coprecipitation, antibacterial properties.
Resumo
Nanopartículas de ZnO dopado com ítrio foram sintetizadas pelo método de coprecipitação para investigar as propriedades estruturais, ópticas e antibacterianas. A análise de difração de raios X conirma a estrutura hexagonal (wurtzita) com tamanho médio de cristalito entre 16 e 30 nm. O gap de energia óptica diminui com o aumento da concentração do dopante Y. Foi veriicado qu nanopartículas de ZnO sãoaltamente eicazes para S. aureus e nanopartículas de ZnO dopado com Y para E. coli, B. subtilis e S. typhi. Nanopartículas de ZnO não dopadas e dopadas com Y são bons agentes antimicrobianos inorgânicos e podem ser sintetizadas pelo método de baixo custo de coprecipitação.
The crystalline structure, phase purity and size of the nanoparticles were determined by XRD (Philips PW-3710). Optical properties of the samples were recorded using UV-Vis spectrophotometer (Jasco) in the range 200-800 nm.
Anti-bacterial studies: nutrient broth (1.3 g) dissolved in 100 mL distilled water, pH adjusted to 6.8 then sterilized in autoclave at 121 oC for 20 min (15 lb). Nutrient agar (2.5 g) added tothe distilled water by adjusting pH then autoclaved at 121 oC for 20 min (15 lb). Pure cultures of bacteria E. coli, B. subtilis, S. typhi and S. aureus were used.
Preparation of Inolculum:100 mL nutrient broth distributed 25 mL each in 4 conical lasks labeled as E. coli, B. subtilis, S. typhi and S. aureus and autoclaved at 121 oC for 20 min. Pure culture of all these clinically isolated strain bacteria were added to each conical lask, kept on rotary shaker for 24 h at 37 oC.
Preparation and Inoculation of test plates: Nutrient broth (1.3 g) and Agar (2.5 g) mixed in 100 mL distilled water and sterilized in autoclave at 121 oC for 20 min then poured into sterile petriplates (15-20 mL) to solidify. Plates were labeled for each test organism then pure cultures of test organisms spreaded entire surface of the plates by swabbing in three directions. Plates were allowed to dry for 5 min. Then wells were cut on each plate with sterile cup borer and labeled as S1, S2, S3, S4. Each sample was then loaded with sterile pipettes in respective plates. Plates were incubated at 37 oC for 24 h.
RESULTS AND DISCUSSION
Structural properties
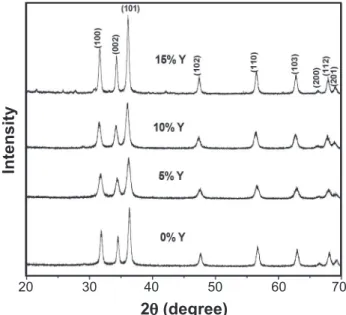
XRD patterns of undoped and Y-doped ZnO nanoparticles are shown in Fig. 1, all samples showing hexagonal ZnO phase and indexed peaks correspond to (100), (002), (101)
and (110) are matching well with the JCPDS data. Further, there are no extra impurities or formations of any phase of Y were detected in the prepared samples. Yttrium doping shows a pronounced effect on the lattice parameters of ‘a’ and ‘c’ as compared to undoped ZnO. The lattice parameters increased with increasing Y concentration as shown in Fig. 2. Similar trend for was reported for Y-doped ZnS nanoparticles [17]. The unit cell volume is also following similar trend. This is attributed to ionic radius difference between Zn (0.74 Å) and Y (1.04 Å) ions. The variation of unit cell volume and X-ray density with Y content is shown in Fig 3. X-ray density decreases with increasing Y concentration, indicating the substitution of Y ions in ZnO nanoparticles. All values are in Table I.
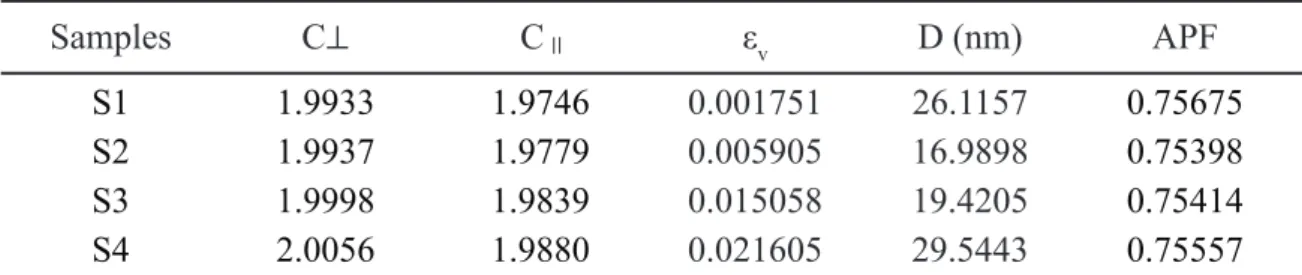
Bond lengthof doped and undoped ZnO are shown in Table II. It is found that the bond length values of perpendicular (C^) as well as parallel (C ) to c-axis increasing with increasing Y concentration. It could be due to the induced growth of the particle at higher temperature. Figure 1: XRD patterns of pure and Y-doped ZnO nanoparticles.
[Figura 1: Difratogramas de raios X de nanopartículas de ZnO puro e dopado com Y.]
20
2q (degree)
Intensity
40 60 70 30 50
Figure 2: Variation of lattice parameter (a and c)with Y content of Zn1-xYxO nanoparticles.
[Figura 2: Variação do parâmetro de rede (a e c) com teor de Y de nanopartículas de Zn1-xYxO.]
3.275 5.24
3.265 5.22
3.255 5.20
0.00
Y contente
Lattice parameter (a) (Å) Lattice parameter (c) (Å) 0.10
0.05 0.15
3.270 5.23
3.260 5.21
Figure 3: Unit cell volume and X-ray density vs Y concentration. [Figura 3: Volume da célula unitária e densidade por difração de raios X em função da concentração de Y.]
5.68 48.8
5.60 5.62
48.2
5.52 5.54
0.00
Y contente
V (Å)
3
X-ray-density (g/cm
3)
0.10
0.05 0.15 5.64
48.0
47.8
47.6 48.4
5.66 48.6
The lattice distortion (εv) was calculated using following equation:
ev= a2c - a02c0
a02c0 (A)
where a0 and c0 are the lattice parameters of pure ZnO
single crystal. The εv values are shown in Table II and are enhancing with increasing Y. It indicates that Y ions go into Zn crystallographic 2b site in ZnO crystal structure. Further, the atomic packing fraction (APF) was also calculated using XRD data and found that APF in the range of 75-76%. The crystalline size correspond to the most pronounce diffraction peak (101) has been calculated using Debye-Scherrer’s formula
D= b Kl
hkl Cosq (B)
where K is the shape factor, λ is wavelength, βhkl is the
full width at half maximum, θ is glancing angle. Table II summaries the results of crystallite sizes. The average crystalline size is in the range of 16-30 nm.
Optical properties
The UV-Vis absorption spectra of pure and Y doped nanoparticles are shown in Fig. 4 and vary linearly with increasing Y concentration. This may be due to the change
Table I - Lattice parameters, unit cell volume and X-ray density of Y-doped ZnO nanoparticles. [Tabela I - Parâmetros de rede, volume da célula unitária e densidade obtida por difração de raios X de nanopartículas de ZnO dopado com Y.]
Sample
code
Y
concentration
(x)
a (
Å
)
c (
Å
)
V (
Å
3
)
X-ray density
(g/cm
3)
S1
0.00
3.2552
5.1988
47.7078
5.6624
S2
0.05
3.2557
5.2187
47.9051
5.6437
S3
0.10
3.2658
5.2338
48.3423
5.5789
S4
0.15
3.2752
5.2389
48.6683
5.5324
in the average crystallite size of nanoparticles. Using optical absorption data, band gap energies were calculated.
As per theory of inter band optical absorption, at the absorption edge, the optical absorption coeficient (αhv)
varies with the photon energy (hv) according to the following
expression
(ahn)n = A(hn - E
g) (C)
Figure 4: UV-Vis spectra of Y-doped ZnO nanoparticles.
[Figura 4: Espectros UV-Vis de nanopartículas de ZnO dopado com Y.]
2.5
1.5
0.5 2.0
1.0
0 200
Wavelength (nm) 400 700 300 500 600 800
Absorption (a.u.)
Samples
C
^
C
ε
vD (nm)
APF
S1
1.9933
1.9746
0.001751
26.1157
0.75675
S2
1.9937
1.9779
0.005905
16.9898
0.75398
S3
1.9998
1.9839
0.015058
19.4205
0.75414
S4
2.0056
1.9880
0.021605
29.5443
0.75557
Table II - Bond length, lattice distortion parameter, crystallite size and APF of ZnO nanoparticles.
where A is constant, Eg band gap energy and n is a number
which characterizes the transition process.
The absorption coeficient (α) is calculated using the equation
a = 2.303 At (D)
where A is the absorption and t is the thickness of cuvate, i.e., 1 cm. The Eg values for direct and indirect transition
obtained by the plots of (αhv)2 Vs photon energy (hv) and
are shown in Fig 5. The optical band gap energies are found to be 3.16, 2.99, 2.68, 2.66 eV and are decreasing with increasing Y concentration. The values are relatively smaller than that of bulk ZnO (3.34 eV). This maybe due to average crystallite size and quantum coninement effect on Y doped ZnO nanoparticles.
Antibacterial activity
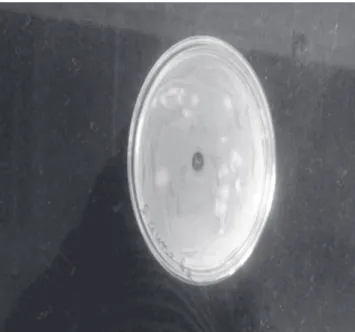
Well diffusion method is used for the assessment of antibacterial activity and the results are shown in Figs. 6-9. S2 and S3 samples are not showing any antibacterial
activity against any of the test microorganisms, whereas, S1 showingmaximum antibacterial activity against S.aureus
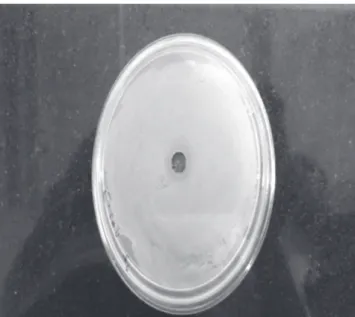
and S4 sample showing maximum antibacterial activity
against B.subtilis (18 mm), followed by E. coli and S. typhi (16 mm both) and no antibacterial activity against S.aureus. Undoped ZnO nanoparticles (S1) showing maximum
antibacterial activity against S. aureus, i.e., 18 nm as compared to 15% Y doped (S4) ZnO nanoparticles (16 mm).
Other microorganisms E. coli, S. typhi and B. subtils was not detected the antibacterial activity. Several researchers reported the antibacterial activity of undoped ZnO for E.coli [18, 19]. Zone of inhibition observed against pathogenic bacteria suggests that ZnO nanoparticles exhibit excellent
Figure 5: Photon energy (αhv)2 against (hv) of the Y-doped ZnO
nanoparticles.
[Figura 5: Energia dos fótons (αhv)2 em função de (hv) das nanopartículas de ZnO dopado com Y.]
30
20
10
5 25
15
0
hn (eV)
2.1 2.4 2.7 3.0 3.3
(
a
h
n
)
2 (cm -1 eV)
2
Figure 6: S1 sample activity against S. aureus. [Figura 6: Atividade da amostra S1 para S. aureus.]
Figure 7: S4 sample activity against S. typhi. [Figura 7: Atividade da amostra S4 para S. typhi.]
antibacterial activity for S. aureus.The antibacterial activity of ZnO nanoparticles depends on its size, surface area and concentration. The inhibitory effect increases with increasing Y concentration. The antibacterial activity results of pure ZnO and Y doped ZnO nanoparticles are in good agreement with reported literature [20-22].
CONCLUSIONS
Pure and yttrium-doped ZnO nanoparticles were synthesized by the co-precipitation method. Lattice parameters and unit cell volume increases with increasing Y concentration, indicating successful doping of Y ions into ZnO lattice. The average crystalline size is in the range 16-30 nm. The energy band gap decreases with increasing Y content. Antibacterial activity was observed using the disc diffusion method. Undoped ZnO (S1) nanoparticles have antibacterial activity against S. aureus. The doping of Y in ZnO (S4) increases its potential against E. coli, B. subtilis, S. typhi and no effect against S. aureus.
REFERENCES
[1] A. Erdem, Talanta 74 (2007) 318.
Figure 9: Activity of S4 sample against E. coli. [Figura 9: Atividade da amostra S4 para E. coli.]
[2] G.Q. Wang, Y.Q. Wang, L.X. Chen, J. Choo, Biosens. Bioelectron. 25 (2010) 1859.
[3] A.M. O’Mahony, J. Wang, Anal. Methods 5 (2013) 4296.
[4] W. Park, G.C. Yi, J.W. Kim, S.M. Park, Appl. Phys. Lett. 82 (2003) 4358.
[5] Z. Liu, Z. Jin, W. Li, J. Qiu, Mater. Lett. 59 (2005) 3620.
[6] A. Moezzi, A.M. McDonagh, M.B. Cortie, Chem. Eng. J. 1(2012) 185.
[7] K. Tam, A. Djurišić, C. Chan, Y. Xi, C. Tse, Y. Leung, W. Chan, F. Leung, D. Au, Thin Solid Films 516 (2008) 6167.
[8] O. Yamamoto, M. Komatsu, J. Sawai, Z. Nakagawa, J. Mater. Sci.- Mater. Med. 15 (2004) 847.
[9] V. Ischenko, S. Polarz, D. Grote, V. Stavarache, K. Fink, M. Driess, Adv. Funct. Mater. 15 (2005) 1945. [10] L. Znaidi, G.J.A.A. SolerIllia, S. Benyahia, C. Sanchez, A.V.Kanaev, Thin Solid Films 428 (2003) 257. [11] C. Wu, X. Qiao, J. Chen, H. Wang, Mater. Chem. Phys. 102 (2007) 7.
[12] A. Kargar, Y. Jing, S.J. Kim, C.T. Riley, X. Q. Pan, D.L. Wang, ACS Nano 7 (2013)11112.
[13] S. Martha, K.H. Reddy, K.M. Parida, J. Mater. Chem. A 2 (2014) 3621.
[14] T. Surendar, S. Kumar, V. Shanker, Phys. Chem. Chem.Phys.16 (2014) 728.
[15] J.-D. Wang, J.-K. Liu, Q. Tong, Y. Lu, X.-H. Yang, Ind. Eng. Chem. Res. 53 (2014) 2229.
[16] P.K. Sanoop, S. Anas, S. Ananthakumar, V. Gunasekar, R. Saravanan, V. Ponnusami, Arab. J. Chem., DOI: 10.1016/j.arabjc.2012.04.023, 54 (2012).
[17] R. Viswanath, H.S.B. Naik, Y.K.G. Somalanaik, P.K.P. Neelanjeneallu, K.N. Harish, M.C. Prabhakara, J. Nanotech., article ID 924797, 8 pages (2014).
[18] J.P. Huo, J.C. Luo, W. Wu, J.F. Xiong, G.Z. Mo, Y. Wang, Ind. Eng. Chem. Res. 52 (2013) 11850.
[19] A. Stoyanova, H. Hitkova, A. Bachvarova-Nedelcheva, R. Iordanova, N. Ivanova, M. Sredkova, J. Chem. Tech. Metall. 48 (2013) 154.
[20] M.A. Gondal, A.J. Alzahrani, M.A. Randhawa, M.N. J. Siddiqui, Env. Sci. Health Part A 47 (2012) 1413. [21] O. Yamamoto, M. Komatsu, J. Sawai, Z.E. Nakagawa, J. Mater. Sci. 15 (2004) 847.