AN EVALUATION OF THE POSSIBLE MERGER BETWEEN
ZON AND SONAECOM
Daniel Valério Martins Valbom
Project submitted as partial requirement for the conferral of Master in Finance
Supervisor:
Prof. Pedro Inácio, Prof. Auxiliar, ISCTE Business School, Departamento de Finanças
II
Agradecimentos
Gostaria de agradecer:
-Ao meu pai pela sua insistência;
-À minha mãe e ao meu irmão pelo apoio constante;
-À colega Joana Vieira e aos colegas Gonçalo Carvalho, Pedro Rafael e André Camelo pela motivação;
-Aos colegas de trabalho da Ernst & Young por me ouvirem; -Ao professor Pedro Inácio pela sua disponibilidade.
III
Resumo
Ao longo dos últimos cinco anos, a possibilidade de fusão entre a ZON e a Sonaecom tem sido alvo de especulação proveniente dos média, políticos e ambos os directores das empresas. Esta dissertação consiste num caso prático sobre uma eventual fusão entre estas duas empresas portuguesas do sector de telecomunicações
O enquadramento teórico foi definido em relação a este tema, monstrando como as empresas envolvidas serão financeiramente avaliadas, assim como a teoria associada a um processo de fusão.
Uma análise detalhada sobre a dinâmica do sector das telecomunicações em Portugal foi realizada (incluindo uma análise histórica e as novas tendências em termos de
concorrência, clientes e tecnologia), demonstrando como a situação actual indicia uma boa oportunidade para a consolidação, o que é igualmente suportado pelas últimas mudanças na estrutura de accionistas da ZON e Sonaecom.
De forma a avaliar correctamente as empresas envolvidas, foi realizada uma avaliação por múltiplos permitindo uma visão comparativa com empresas do sector na Europa, e posteriormente foi aplicado o método Discounted Cash Flow (mais especificamente o
Free Cash Flow to the Firm) para uma análise mais detalhada sobre as duas empresas.
Após a avaliação individual das empresas, é verificado que um eventual acordo seria financeiramente recompensador para os accionistas de ambas as empresas, através do cálculo do valor da nova empresa e das sinergias provenientes da operação.
Finalmente, é concebido o processo de uma aquisição por Consolidação; a proposta justa por troca de acções é demonstrada, assim como a resultante estrutura de accionistas da empresa criada.
Palavras-Chave: Telecomunicações, Fusões, Sinergias, Free Cash Flows to the firm JEL Classification: G32; G34
IV
Abstract
Over the last five years, a possible deal between Zon and Sonaecom has being target of speculation from the media, opinion makers, politicians and both companies’ executives. This research consists in a practical case over an eventual merger between these two Portuguese telecom companies.
The theoretical framework was defined regarding this topic, elucidating how both companies would be financial evaluated, as well as the theory behind a merger process appraisal.
A detailed analysis over the Portuguese telecom market dynamics was made (including prior and actual trends of the competition, clients and technology); illustrating as the current situation indicates a good opportunity for consolidation, which is also supported by the last events regarding the capital structures of ZON and Sonaecom.
In order to properly evaluate the firms involved, it was applied a relative valuation for a comparative analysis over other telecom companies in Europe, and then the Discounted Cash Flow method (more specifically the Free Cash Flow to the Firm) for a more detailed assessment of the enterprises under valuation.
After the individual valuation of the firms, it was verified that a possible deal would financially compensate the shareholders of both companies, through the achievement of the hypothetic new firm value and synergies from the operation.
Finally, the process of an acquisition by the Consolidation type approach is devised; the fair share exchange proposal is delivered as well as the resulting shareholders’ structure of the new created company.
Key words: Telecom, Mergers, Synergies; Free Cash Flow to the Firm JEL Classification: G32; G34
V Table of Contents Agradecimentos _______________________________________________________ II Resumo _____________________________________________________________ III Abstract _____________________________________________________________ IV 1. Theory ___________________________________________________________ 1 1.1 Discount Cash Flow methodology ___________________________________________ 1 1.2 Relative valuation ________________________________________________________ 6 1.3 Merger and Acquisitions __________________________________________________ 8 2. Portuguese Telecom Sector __________________________________________ 12 2.1 Technology ____________________________________________________________ 12 2.2 Market paradigm _______________________________________________________ 14
2.2.1 Fixed Service _______________________________________________________________ 16 2.2.2 Mobile Service ______________________________________________________________ 23
3. ZON and Sonaecom Valuation _______________________________________ 26 3.3 Valuation _____________________________________________________________ 26
3.3.1 Relative Valuation ___________________________________________________________ 27 3.3.1.1 The Peer Group _________________________________________________________ 27 3.3.1.2 The Multiples ___________________________________________________________ 28 3.3.2 Discounted Cash-Flow method _________________________________________________ 32 3.3.2.1 Income Statement Preview_________________________________________________ 32 3.3.2.1.1 Operating Revenues __________________________________________________ 32 3.3.2.1.2 Operating Costs _____________________________________________________ 39 3.3.2.1.5 Financial Results _____________________________________________________ 43 3.3.2.1.6 Income Tax and Minority Interests ______________________________________ 44 3.3.2.1.7 Income Statement ____________________________________________________ 45 3.3.2 Free Cash Flows to the Firm _________________________________________________ 47 3.3.2.1 Capital Expenditures ___________________________________________________ 48 3.3.2.2 Investment in Working Capital ___________________________________________ 49 3.3.2.3 Continuing Value ______________________________________________________ 50 3.3.3 Discounted cash flows ______________________________________________________ 51 3.3.3.1 Cost of Debt __________________________________________________________ 52 3.3.3.2 Cost of Equity ________________________________________________________ 53 3.3.3.3 Weighted Average Cost of Capital ________________________________________ 55 3.3.4 Equity value ______________________________________________________________ 56
4. M&A Valuation___________________________________________________ 57 4.1 Shareholders and Capital Structures overview ________________________________ 58 4.2 SonaeZon Forecasts _____________________________________________________ 60 4.3 SonaeZon valuation _____________________________________________________ 62 4.4 SonaeZon Synergies _____________________________________________________ 63
VI 4.5 Share Exchange Proposal _________________________________________________ 65 5. Conclusion _______________________________________________________ 68 References __________________________________________________________ 70 Annex ______________________________________________________________ 72
1
1. Theory
1.1 Discount Cash Flow methodology
The Free Cash Flow to the Firm (FCFF) methodology1, designed by Rappaport (1998) is one of the existents valuation methods that can be applied to the forecasts of the analyst in order to access the intrinsic value of a company.
These models access the capacity of the company to make earnings in the future in order to repay the debt and remunerate its shareholders. It is based in the calculation of Discounted Cash Flows, or, by other words, the present value of the future cash flows generated by the company.
Free Cash Flow to the Firm
First of all, it is crucial a detailed and critical analysis over the historical data available, involving the past Company Reports as well as the market sector dynamics including prior and current trends on the competition, clients and products.
With this taken into consideration, the income statement forecasts are constructed, usually for a period around 5 years, a time frame in which the analyst can have a more precise prediction over the evolution of the business.
The FCFF calculation embraces at the same time the components of profitability and investment of the company: Basically, it is, on a yearly basis, the remaining cash-flow in the firm, after taking into account taxes (NOPLAT2); and the reinvestment needs (CAPEX Investment in excess of depreciation and amortization, and Working Capital Investment).
Then, a continuing or horizon value is calculated, which considers the ability of the company to produce cash-flows after the time frame chosen, by applying an expected stable growth rate (g) over the inputs of the prior year cash-flow.
1
The formula calculations of the referred technical terms in this chapter are shown in Annex 1
2 NOPLAT (Net Operating Profit Less Adjusted Taxes) is used as an input of the DCF model,
representing the profits generated by the company´s core operations after subtracting the income taxes related to the core operations. Rather than Net Income, EBIT is used since it removes the effects of the capital structure (not considering the interests costs or minority interests as Net Income would).
2
Weighted Average Cost of Capital
The prior cash-flows, as well as the continuing value, in order to take into consideration the time value of money and the implicit risk, are discounted to the present time through a discount rate. The discount rate generally used is the Weighted Average Cost of Capital (WACC).
The WACC discount rate considers the capital structure of the company, taking into account the weight of each category of capital in the firm: Equity and Debt3.
Cost of Equity
The Cost of Equity (Re) can be calculated through various models as the Arbitrage Pricing Model, the Multi Factor Model or the Proxy model, but the most known model is the Capital Asset Pricing Model (CAPM).The CAPM model relates the risk with the expected return, being used to pricing the risky securities or in this perspective, the investment on a company.
CAPM states that “the expected return on any investment can be written as the sum of
the risk-free rate and an extra return to compensate for the risk”(Aswath Damodaran,
page, 1998; Investment Valuation, page 159).
While the risk-free rate(Rf) compensates the time value of money, the risk premium consists on the second half of the formula, representing the compensation needed to lead an investor to take additional risk: The risk measure (beta or ) and the market risk premium which is determined from the slope of the Security Market Line4.
However, Damodaran (1998) argues that a beta estimated from a regression is noisy and sometimes the standard error can be so large that the estimation should be considered useless. He also defends that using historical data is the bigger error, since firms do change over time (business mix, or leverage, or at least simply growing over time which implies a different beta).
3 Regarding the use of Debt in the capital structure, one can see on the WACC formula (Annex 1) that it
takes into account the tax savings provided from that choice.
4
The Security Market Line (SML) plots the results of the expected return for the different risks levels/measures (betas).
3 Levered Beta
The alternative suggested by Copeland, Koller and Murin (2000), supporting the theory of Kapland and Peterson (1998), is the search for published estimates of betas in various reliable sources for a group of similar companies (comparables), ending in the calculation of the industry average levered beta.
Taking into account the average industry capital structure as the average interest rate, one can achieve the Unlevered beta of the sector. Then, applying the tax rate and the current capital structure of the company under valuation, the beta levered of the company is finally reached.
Market Risk Premium
Regarding market risk premium, Damodaran suggests in his paper “Equity Risk Premiums”, a methodology entitled as the country premium risk approach.
Basically the base mature market premium consists in the use of the geometric average premium earned by stocks over treasury bonds with sufficient historical data in order to reduce standard error.
The country risk Premium calculation starts from the country rating from Moody´s, and a default spread in basis point5 is estimated based on the difference from the rating and the respective Treasury bond rate. This default spread is then multiplied by the relative equity market volatility.
Damodaran “ Measuring company exposure to country risk” paper suggests the adding of the use of the variable Y (lambdas) to the country risk, reflecting the exposure of a company in the countries where it is present, which was measured based upon the proportion of the profit in that country.
5 Basis Point is a unit that is commonly used to denote the change in a financial instrument, or calculating
changes in interest rates, equity indexes or yield of a fixed-income security: 1 basis point = 0,01% (www.investopedia.com/terms/b/basispoint.asp#axzz27y6vIQSF)
4
Cost of Debt
The methodology usually used consists in the sum of the risk free plus a credit spread corresponding to the rating of the company.
Risk-Free Rate
For the Risk-free rate, Damodaran suggests the gathering of the 10 years Treasury Bonds issued by countries whose rating is triple A, and, in order to pursuit a yield error minimization, instead of a simple average calculation, the median should be used, since it has the advantage of not being influenced by individual erratic values.
Spread
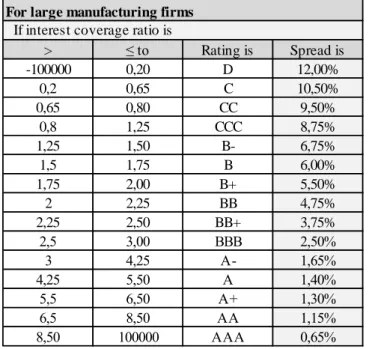
Damodaran approach suggests the change of the credit spread to an estimated spread based on the company´s Interest Coverage Ratio: He created 15 ranges of values, based in historical and forecasted costs of debt by non-financial large firms, assigning a rating to each one and finally an estimated Spread.
Table 1.Source: A. Damodaran spreadsheet
Equity Value
The equity value is the value of a company available to the shareholders. Equity value allows to compare the valuation of the company with its actual value on the Financial market (Market Capitalization), where the last only reflects the common shares outstanding while Equity value incorporates all the equity interests in a firm.
For large manufacturing firms
> ≤ to Rating is Spread is -100000 0,20 D 12,00% 0,2 0,65 C 10,50% 0,65 0,80 CC 9,50% 0,8 1,25 CCC 8,75% 1,25 1,50 B- 6,75% 1,5 1,75 B 6,00% 1,75 2,00 B+ 5,50% 2 2,25 BB 4,75% 2,25 2,50 BB+ 3,75% 2,5 3,00 BBB 2,50% 3 4,25 A- 1,65% 4,25 5,50 A 1,40% 5,5 6,50 A+ 1,30% 6,5 8,50 AA 1,15% 8,50 100000 AAA 0,65%
5 Starting from the discounted free cash-flows to the firm, the Enterprise Value is calculated, which is no more than a simple sum of all the discounted cash flows including the discounted continuing value, representing an economic measure reflecting the market value of the whole business.
To reach the firm value, the market value of non-operating assets, basically cash and equivalents, is added to the Enterprise value.
Since the Equity value only accounts the ownership interest in a firm, therefore, the Market Value of Debt as minority interests or preferred stock must be reduced from the Firm value.
Dividing the Equity value by the common shares currently outstanding, it is achieved, according to the assumptions and valuation output, the fair price per share of the company. Thereby, being comparable to the actual price per share, it is named as the “price target”, providing an insight of the potential future upside or downside of the price of share.
6
1.2 Relative valuation
The relative valuation is a valuation using multiples or ratios. It is also known as market valuation or comparable company analysis. This valuation is important because it allows, regardless of its size, a direct comparison between the value of a company with other comparable company (peer) or with the sector/industry average value.
Through the use of ratios (known as multiples), it is an easy and intuitive method to control for differences between companies, as the growth potential and the risk.
Based on the premise that the performance of a company in the future will tend towards the industry average (Damodaran, 2002), an average comparable multiple is compared with the one of the company. If the one from the company is lower, thus, the value of this company is undervalued, and therefore it has a growth potential on the share price (and vice versa).
To amount that underestimation, the average multiple is applied to the used variable of control and then is obtained the implied market equity value of the company that is undebr evaluation. Comparing the new implied market equity value to the actual equity market value, one can see for how much that, according to that specific multiple, this company is underestimated by the market.
It is argued that relative valuation should be seen as a complementary method and not a substitute for methods such as DCF (Discounted Cash-flow).
This argument is associated with one of the biggest criticisms of relative valuation: Its subjectivity presented in the selection of comparable companies and in the choice of which multiples to be used: As Goedhart, Koller and Wessels (2005) states, “finding the
right companies to the comparable set is challenging; indeed, the ability to choose appropriate comparables distinguishes sophisticated veterans from newcomers”.
To counter this criticism it is important to carefully screen the companies to compare, and always take into account that multiple analyses should be separated by specificity. Below, the three general types of existent multiples are indicated, with alternative ratios for each type:
7
Earnings Multiples:
PER ratio= Equity market value/Net income
EPS Earning per shares= Net Income/Number of shares Enterprise value/EBITDA or EBIT
Book value Multiples:
PBV price to book value=Equity Market Value/Equity Book Value Enterprise Value/Invested Capital
Revenues Multiples
Price to Sales ratio= Equity Market Value/Revenues Enterprise Value/Revenues
From the prior ratios, it is highlighted the EV/EBITDA multiple, since it is considered one of the most accurate and reliable multiple used in the financial markets. This specific multiple has some advantages over some other ratios:
-There are companies that cannot be compared through multiples using net income figure- PER or EPS ratios- (when they have that value as negative). Therefore EBITDA extends the number of companies available to be compared, since they can have the EBITDA figure as a still positive value and thus be included in the peer group.
Multiples using figures after taking into consideration depreciation costs, as the figures EBT, EBIT or Net Income, are subject to suffer modifications regarding depreciation methods, leading to misleads. Taking this into account, it was concluded by Marc Goedhart (2005) that EBITDA is a more accurate figure.
The Enterprise Value figure in the ratio ensures independence of the ratio in changes of capital structure (between the % of Equity and Debt) since it has no direct impact in this multiple, when it does have on multiples with Market capitalization figure in the ratio, for instance.
Still, is important to note that Fernandez, P. (2001) indicated some limitations of this multiple, as being subject to changes in capital investments and working capital variations.
8
1.3 Merger and Acquisitions
The term mergers and acquisitions, usually abbreviated as M&A, broadly refer to a set of complex operations regarding the acquirement of a company by other. These operations are triggered by various reasons; being classified within different forms, and can be carried forward by different legal procedures.
Acquisitions Reasons
The major reasons behind this kind of operations, usually applied by high dimension companies, are the following:
Synergies Gain (to enterprises of the same sector it enables the improvement of the supply chain as the client and/or suppliers base, representing the possibility of revenue enhancement with marketing gains and/or substantial costs reductions with economies of scale or the achievement of complementary resources).
Strategic Benefits (it allows the compensation of the lack of the know-how in the company or a client or supplier base, needed in order to develop a new strategy ,to access to new businesses, or to enable a faster entry in new country markets).
Gain of Market Share (it consists of an easier way to reduce competition, conquering fidelity clients in mature markets with stabilized market shares; it increases its pricing power, since there is less industry capacity in the market, improving the monopoly profits).
Business Restructuring (it permits to take the control of a company that has experience and a name on the market, and somehow is now in a bad moment, mainly due to financial or liquidity issues. Injecting money, and after some restructuring decisions, the acquiring company could eventually sell it in parts, or even the whole company for a better price than the one originally paid).
Assets or business divestment (it allows the application of aggressive strategies as the acquisition of a company with the aim of, in the future, divide it by businesses or sectors, selling it in parts)
Acquisitions Forms
Acquisitions can take 3 primary forms (Brealey, 2004):
9 Vertical: Involving companies in different stages of production, taking place along
the supply chain (in manufacturing, distributing or selling part).
Horizontal: Involves companies that have the same activity or industry, taking place between former competitors.
Acquisitions Types
There are three basic legal procedures that one firm can use to acquire another firm (Ross, Westerfield and Jaffe, 2005).
Merger or Consolidation
Acquisition by merger is when one firm completely absorbs the other, acquiring all the assets and liabilities of the acquired firm (which ceases the activity), and retains its name and identity.
In a consolidation, the assets and liabilities of the companies are also integrally combined, but the difference from a merger is the fact that both the acquiring and the acquired firms terminate their legal existence, being part of a new created firm. The distinction between acquiring and acquired firm is not relevant in this approach.
- Legally straightforward and less costly as the other forms -Must have the approval of the shareholders of both firms6.
-In a merger, shareholders of the acquired firm have appraisal rights7 Acquisition of Stock
One firm acquires other by purchasing that firm´s voting stock by cash, shares of stock or other securities. It is communicated an OPA (acquisition public offer) to buy shares of that target firm.
-No shareholder meetings have to be held, no vote is required and target´s firm management and board of directors can be bypassed8.
6 Usually, 2/3 of the votes of each firm are required for the approval.
7 Appraisal rights means the possibility that the acquired shareholders have to demand a fair price for the
purchase of their shares (which, when not easy agree, often leads to expensive legal proceedings)
10 -The acquisition is often unfriendly and the cost of acquisition tends to be higher than in a merger9
Acquisition of Assets
One firm acquires the other by buying all its assets (transferring titles). -Legal procedures of transfer assets are costly
- Must have the approval of the acquired firm shareholders -It avoids the potential problem of having minority shareholders10
Merger Valuation
To check if a merger or consolidation increases value for both shareholders of the companies involved, a direct comparison has to be made between the earnings and the costs that would result from the process.
The word synergy, in general could be defined as a situation where the result of a combination of two elements is greater than the sum of the results that these two elements would have separately.
Based on this premise, in other words, a merger would make sense if new company value (taking also into account all the process for its creation) would be bigger than the value of firm A and firm B separately: The total value of synergies is defined by the Equity value of the new company, less the individual equity values of both companies less the restructuring costs associate to the merger process (as legal, investment bank consultant, integration or possible termination costs).
Other type of cost that has to be taken into consideration is the premium paid to the bought company and, comparing the synergies with this premium, if a positive result is reached, the conclusion is that the merger process should go forward.
9
If the target firm´s management do not agree, they will resist, contacting the shareholders with packages of benefits trying to convince them to not accept the tender offer, which probably will lead to a second more costly offer from the bidding firm.
10
In the acquisition by stock approach, some shareholders can hold out of the offer, and therefore, the target firm is not completely absorbed.
11
Merger Process
This acquisition could be financed whether by cash or by shares of stock.
Financing by cash, has some disadvantages when compared to a share exchange or common stock approach:
It usually results in a taxable transaction, whether by exchanging stock is tax free.
When discussing a big transaction, having cash available or raising cash can be a problem.
If cash is used to finance an operation, the selling firm´s shareholders receive a fixed price, whether the share exchange approach allows the sharing of gains and risks associated with the new company business (meaning additional gains if there is a successful merger).
12
2. Portuguese Telecom Sector
2.1 Technology
There are different access networks available in the Portuguese telecommunication market as the wireless, Xdsl, HFC and FTTx. A brief explanation will be done about the last two since are the ones used by ZON, PT and Sonaecom (the main operators in the telecommunication sector).
HFC technology is used mainly by ZON whereas FTTx, considered the new generation network, is mainly used by PTC, but ZON and SONAECOM also have some access points that permit the use of that technology.
The ZON´s FTTx network were achieved by the acquisition of TvTel in 200811, and by the celebration of a contract with Alcatel-Lucent in 2010 (together will install and construct more km in a network based in that technology).
- About FTTx (fiber to the x) is a connection done by optical fiber and then metallic cables depending on each situation. Ordered in terms of quality connection, there are different variants: FTTH, FTTB12; FTTC13 and FTTN14 .These quality variants differ according to the last point of optical fiber installation.
The best would be FTTH (fiber to the home), meaning that the digital information all the way since the central to the home of the client is carried by optic fiber; however, that would also mean the most expensive option since the cost of the installation of optic fiber in the last meters until the client´s home increases a lot.
It is important to explain that this technology is believed to be the future trend, The optic fibers represent a lot of advantages against the other types of metallic cables (copper, coaxial and fiber), as its higher carrying capacity, its thinner volume, the less power required and less signal degradation which are translated in more quality,
11 TVTel was a regional Pay-Tv and internet provider company.
12 FTTB means fiber to the building, which imply the installation of optical fiber since the central until
the client´s building, and then it would exist metallic cables(cooper or coaxial) to carry the digital information these remaining last meters from the building to the client´s home
13 FTTC (fiber to the curb): the optical fiber is installed since the central until 200 to 400 meters of the
home of the client
14
FTTN (fiber to the node): the optical fiber is installed since the central until near the neighborhood - few km from the client´s home.
13 reliability and speed. All these advantages are associated to a lengthy implementation process and obviously a more expensive investment.
-HFC (hybrid fiber-coaxial) as the first word suggests, mixes fiber optic cables with coaxial cables. Its network is defined by the DOCSIS (data over cable service interface specification), which represents the possible speed provided for a cell. ZON made a big investment and passed the majority of its network (80%) from DOCSIS 1.0 to DOCSIS 3.0 which allowed an evolution from 50Mbps to 400 Mbps for downloads and 9mbps to 108 on up streams per cell (speed that will be shared by a set of clients). Being available to these kinds of upgrades for a relatively low cost is one advantage of HFC.
The big disadvantage of the HFC is the fact of the cell speed is shared by a set of costumers which means that the speed achieved by one client depends not just from its use but also on the use of the other clients that share the same cell: heavy users & rush hours could imply a problem. The solution passes by, wherever is needed, the installation of more nodes/cells, which decreases the number of users per cell, and consequently will normalize the speed close to the contract ones.
It can be concluded that both technologies have their advantages and disadvantages associated with the different levels of service quality, implementing-cost and revenue generating potential; therefore, the choice of one in favor of another cannot be defined as correct or wrong, it just depends on the perspective and strategy point of view of the company which is making that decision.
14
2.2 Market paradigm
The telecommunications sector can be divided in two segments: The fixed and the mobile service. The fixed segment is constituted by the Pay-Tv; the fixed voice and the fixed internet. The mobile segment is composed by the mobile voice and mobile internet.
Although they all play a role in the telecommunication sector, it is important to start to distinguish the Pay-Tv market, considered the most important market of the fixed telecommunications sector. This is due to the fact that it is increasingly seen as a basic
need, it has the bigger number of subscribers and over the last few years has become the main driver for multiple-play or package offers.
These multiplay-offers, translated in cross-selling15 are the new paradigm of the telecommunication business, since in general, as a matter of convenience, clients tend to sign different conjugations of the Pay-Tv, phone and internet fixed service from the same operator instead of choosing each service from a different operator.
This strategy started by ZON in 2008 that, with the creation of the fixed voice service, became pioneer in the triple-play market.
In result of that move, PT soon created services to play in the tripled fixed telecommunication market, and since then, with the help of other players, telecommunications sector is being involved in a big intense competition conducted by the constant demand for innovation.
More recently, some quadruple-play offer were available for clients, besides PT with its TMN brand, ZON entered in the Mobile sector and Vodafone into the fixed one. However, from the client´s perspective there is still no big correlation between the fixed and mobile options.
At the 3ºquarter of 2011, in Pay-Tv market, from the total of Pay-Tv subscribers, 32,9% were only Pay-Tv subscribers, whereas 67,1% had the TV integrated in a multiplay package.
From the multiplay package, the triple-play offer (TV+ fixed phone + fixed internet) is the most popular offer with 51,5%, followed by the 2 play (TV + fixed phone) with
15 12,3%. The remaining 3%, is composed by different conjugations of multiplay offer as TV+ fixed Internet; TV+ mobile internet and TV + fixed phone + mobile internet.
Figure 1.Source: ANACOM
Contributing to this paradigm, at the 3ºquarter of 2011, 80% of the fixed internet subscribers purchased that service in a multiplay offer. 11% of them in a double-play pack (adding TV or Fixed phone to the internet purchase) and 69% were triple play, the whole package.
These multiple-play offers also contributed significantly for the fixed phone market, which won a new pace, and moved for a positive trend since the end of 2008.
This new paradigm of services integration associated to the demand for the client fidelity, led to an intense competition from the operators to conquer the Pay-Tv market, since who conquers this market has the way facilitated to attract those clients to sign with them the remaining fixed options - the fixed phone and the fixed internet.
32,9%
52%
12% 3%
67,1%%
Subscribers by type of Service contracted
(3ºQ 2011)
Only Pay-Tv
Pay-Tv+ Fixed Phone + Fixed Internet
Pay-Tv + Fixed Phone
16
2.2.1 Fixed Service The Pay-Tv
Despite of Portugal going through a difficult time, with difficult measures and consequently lower income, the Pay-Tv national market has been growing with increasing penetration rates during the last years (Annex 6). This is justified by the fact that TV service is increasingly seen as a basic need. Thus, is expected a common trend for the next years with a slow increase in the number of subscribers.
In the last 4 years, the national Pay-Tv service market has been target by an intense competition through a lot of innovation in quality of contents and upgrades in technologies, mainly from the two stronger operators- ZON and PTC.
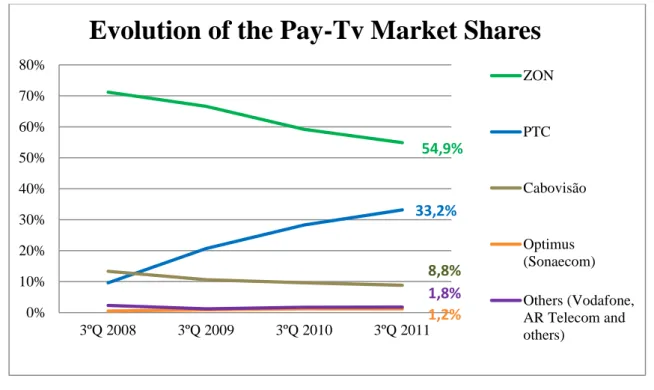
The graph bellow shows the evolution of the market shares of the different players since 2008 until 2011. After the spin-off from PT (end of 2007), ZON was an undisputed leader. But PT sooner started to strongly attack this Market (surpassing Cabovisão and conquering the 2nd position in the end of 2008). According to the latest data-3rd quarter of 2011- ZON is leader of the Pay-Tv market with 54,9 % market share followed by 33,2% PT.
Figure 2.Source: ANACOM
0% 10% 20% 30% 40% 50% 60% 70% 80% 3ºQ 2008 3ºQ 2009 3ºQ 2010 3ºQ 2011
Evolution of the Pay-Tv Market Shares
ZON PTC Cabovisão Optimus (Sonaecom) Others (Vodafone, AR Telecom and others) 54,9% 33,2% 8,8% % 1,2% % 1,8% %
17 As one can see ZON is losing market share to PT, but ZON is not being stolen in its client base: these changes in the market shares are mainly due to investments and aggressive campaigns of PT which is successfully picking up the new clients in this continuous growing market.
As it was stated before, it is known that Pay-Tv is the main driver for triple offers (clients tend to sign for Tv, phone and internet fixed service from the same operator), and ZON´s strategy consists in the defense of its subscribers clients16 at the same time intending to convince them to sign multiple offers which leads to an increase in its ARPU17.
In this growing market, it is expected that the dominance from these 2 will be even bigger compared to the other operators, and the tendency in short/medium term is to an approximation and probably an overtaking of the PT against the ZON market share. The past and future predicted evolution is strongly associated with the service technology used which will influence the quality of the provided product/service by the operators and consequently will lead or not to the achievement of new clients and capacity to keep the old ones.
The Technology Offer in Pay-Tv Segment
There are different technologies available to support national Pay-Tv market as the CATV (cable), DTH (satellite), FTTH (optical fiber), xDSL/IP (public telephone), FWA (radio fixed access) and the DTT (digital way- the alternative for the switch-off of the analogical signal that happened in January 2012, which did not directly affect the subscribed clients of the Pay-Tv).
-The CATV (Cable TV) associated to the HFC technology (which is mainly used by ZON) is the most representative of the total subscribers in 3rd Q 2011 (its 1.428 thousands clients are 49,4% of the total). However, it is visible that since 2nd Q 08, the number of clients using CATV has been decreasing and it is expected a similar behavior in the future.
16 Based on the actual advertisement campaign “stay with the leader”. 17
ARPU states for Average Revenue per User, meaning the average net revenue per user (or costumer), being commonly used on the telecom sector, in order to describe the revenue per month of a service.
18 -About DTH service (direct to home service television by satellite) according to the last data reached 683 subscribers, representing 23,6%. A gradual positive evolution as the one it can already be seen is awaited.
-The number of subscribers by other means had also a fast growth. Around 559 thousand clients are now using the Pay-Tv service distributed by FWA-fixed wireless access- technology (Ar telecom clients) and by xDSL/IP –public telephone network- (clients from PT, Sonaecom and Vodafone). The prospect is the continuation of the past trend and increase its actual share of 19,4%.
-Finally the TV service distributed by FTTH has the most recent technology-optical fiber- and had a fast expansion since it was launched in 1Q09, achieving now 220 subscribers representing already 7,6% of the total subscribers. It is believed that the future will be based in this service, so this positive trend is to remain in the coming years. An important note is that this superior technology is mainly used by PT (but as it is said in market paradigm chapter, ZON and Sonaecom also have some access points that permit the use of that technology).
Figure 3.Source:ANACOM
The general market is growing, and PT is the one taking mostly of it: It has been doing big investments in the FTTH and xDsl technologies with represent almost 100% of the new clients. This explains why PT market share is growing so fast.
On the other hand ZON aside from not competing in xDSL, has a small participation in FTTH growth and their services are mainly directed by CATV, which has led to its decreasing market share and to a negative preview for the future.
0 1000 2000 3000 4000 3ºQ 2006 3ºQ 2007 3ºQ 2008 3ºQ 2009 3ºQ 2010 3ºQ 2011 Su b scr ib er s in th o u san d s
Evolution of Pay-Tv subscribers by
used technology
FTTH Other Technologies DTH CATV19
Fixed Voice
According to ANACOM, and represented on the graph in Annex 7 the fixed voice system had achieved more than 4.5 million accesses registered. The penetration rate has also been gradually increasing, reaching 42,5 accesses per 100 habitants in the 3ºquarter of 2011.
The majority of access are done by analogue access (52,2%) which has been decreasing its percentage in the last few years. RDIS and Digital Access also have now less accesses number than had before. In opposition to the last ones, the two remaining type of access has been growing and supporting the small growth of the general market, having more relevance the VoIP/VoB access (Voice over internet protocol/Voice over broadbrand).
This last one, after 5 years of existence, already represents 22,6% of the total access and includes the xDSL, fiber optic based-access and the VoB access supported by cable network.
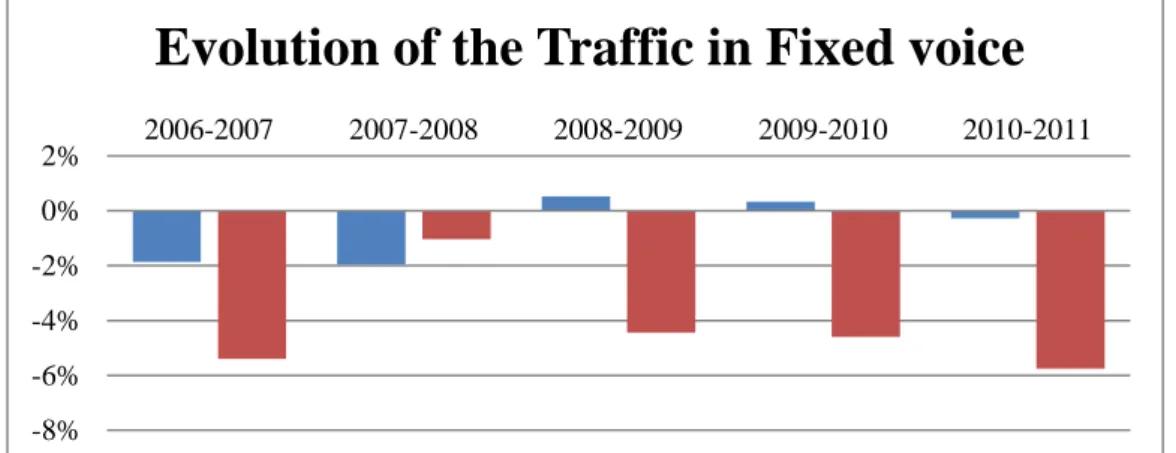
Analyzing the fixed voice segment with more detail, the chart bellow indicates a general negative evolution in the last years:
A significant decrease year after year of the “number of calls” denounces the less use of the fixed voice. This is due to the recent growth of the Mobile segment, which is cannibalizing18 the clients of the fixed one;
The “number of minutes” also has started to have a negative evolution. Fixed Voice segment is more and more seen as a secondary product and, according to that new perception, in 2008 there was a general change in the pricing system: the providers started to apply fixed and really cheap tariffs for it and/or selling it with “free calls” in a multiplay pack offer, which helped the figure.
18 Cannibalization meansthe negative impact of a new service/ product on the performance of an existing
20 Figure 4.Source:ANACOM
PT dominates this market with 59,1% of market share, ZON is second with 40,9%. As it can be seen on the graph bellow these 2 are approaching themselves:
On the one hand, in the last 4 years PT had a negative evolution loosing 9,8 percentage points of the prior market share, on the other hand, ZON, in the same period achieved the same amount of percentage points (9,8%) but in growth. This is due to the success that ZON is having with its sell of multiplay offers. In third place Sonaecom has been decreasing its market share, now with 12,5%. Cabovisão has 5,7% and is quite stable with its client base.
Figure 5.Source:ANACOM -8% -6% -4% -2% 0% 2% 2006-2007 2007-2008 2008-2009 2009-2010 2010-2011
Evolution of the Traffic in Fixed voice
Number of minutes originated in fixed voice Number of calls originated in fixed voice
0% 10% 20% 30% 40% 50% 60% 70% 80% 3ºQ 2008 3ºQ 2009 3ºQ 2010 3ºQ 2011
Market Shares of Fixed Voice (%)
PT ZON Optimus (Sonaecom) Cabovisão Others (Vodafone, AR telecom, ONITELECOM and Others alternative providers) 59,1% 40,9% 12,5% 5,7% 6,2%
21
Fixed Broadband
This market segment is increasing in the last years, achieved 2.194 thousands of clients in the 3rd quarter of 2011 (Annex 9).
Nowadays the clients have two ways to own fixed internet: Almost 99% of the clients access through broadband and the remaining by Dial-up access (which has been decreasing and it is believed that will be inexistent in the next coming years).
The growth on the general market was supported by the growth on both residential and non-residential broadband access, maintaining a stable relation around respectively 88% and 12% of the total broadband access.
Going along with the general increase in people using internet, the number of existing fixed broadband accesses attached to the technologies ADSL and Cable modem growth in the last years, representing respectively 50% and 40,1% of the total access (Annex 11).
Is important to highlight the increasingly less use of “others” technologies, and, since 2009, the growth at strong pace of the optic fiber accesses (ffth/b- fiber to the home /building).
About the last one, fiber optic, it was already stated in the technology chapter about its advantages and as it is believed to be the future trend, thus a growth in the next coming years was forecasted, which will mean a future decrease in the use of the technologies ADSL and Cable modem.
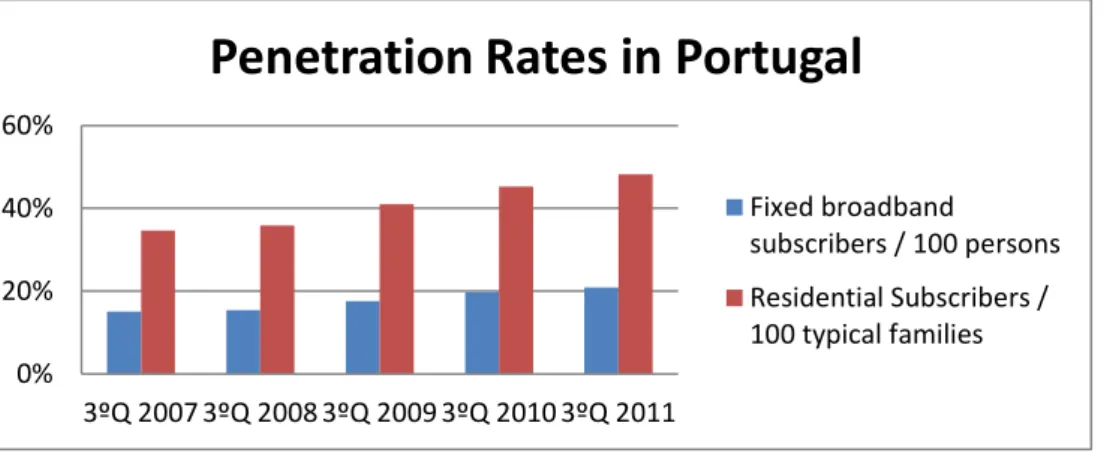
It is possible to confirm how the Portuguese market is continuously growing, first checking the growth of the two most important penetration rates in the graph bellow, and secondly noticing that there is still growth potential when doing the comparison between the Portuguese penetration rate (20,9% at 2nd quarter of 2011) and the European Union average (around 25,6%), portrayed in the Annex 10.
22 Figure 6.Source: ANACOM
According to the chart bellow, PTC is the leader of this segment with a market share of 48,5%, followed by ZON with 32,6%.
Since 2008 one can recognize the trend of this market: on the one hand the sustained growth from ZON and mainly from PTC, on the other hand the continuous decrease of Cabovisão, Sonaecom and others alternative provider market shares.
The continuation of this trend is forecasted in the future, which will generate a market more and more dominated by the 2 stronger operators (PTC and ZON).
Figure 7. Source: ANACOM
0% 20% 40% 60%
3ºQ 2007 3ºQ 2008 3ºQ 2009 3ºQ 2010 3ºQ 2011
Penetration Rates in Portugal
Fixed broadband subscribers / 100 persons Residential Subscribers / 100 typical families 0% 10% 20% 30% 40% 50% 60% 70% 80% 3ºQ 2007 3ºQ 2008 3ºQ 2009 3ºQ 2010 3ºQ 2011
Evolution of the fixed internet market
shares
ZON PTC Cabovisão Sonaecom Others (Vodafone, AR Telecom,TvTel, Onitelecom and others) 5,9% % 5,6% 7,3% 32,6% 48,5%23
2.2.2 Mobile Service
Voice & Broadband services
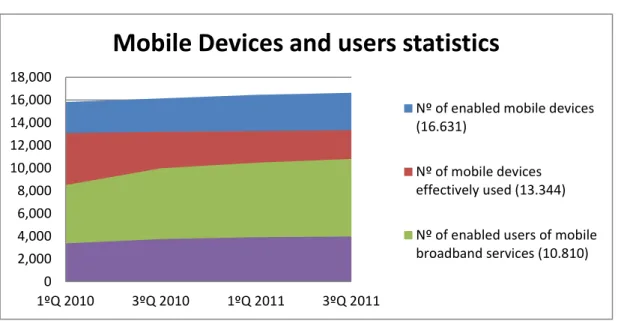
The mobile service industry in Portugal is well developed and it is in a positive trend. The Annex 8 shows the penetration rates of this sector, which, are growing over the years: Existing more cellphones than persons, we have now 156,3 cellphones by 100 habitants. If it would be consider only the devices effectively used (used in the last month of the 3ºquarter), the value would be 125,4 cellphones which is still a significant value.
The following chart confirms a good industry signal indicated:
Figure 8.Source:ANACOM
In the 3rd Quarter of 2011, there were 16.631 thousands of enabled mobile devices. These equipment are associated with a tariff plan, which in most is Pre-paid (71% of the total enabled mobile devices), but there are also others as post-paid, combined or hybrid services and other specific situations plans that share among them more or less equally the rest of the enable devices.
Over the last value, 80% were actually or “effectively used” in the last month of the 3rd quarter: 13.344 thousand devices.
There were 10.810 thousand equipments that permit the use of the mobile broadband services, but just 36,8% (3.977 thousands) actually had traffic in the last month with the
0 2,000 4,000 6,000 8,000 10,000 12,000 14,000 16,000 18,000 1ºQ 2010 3ºQ 2010 1ºQ 2011 3ºQ 2011
Mobile Devices and users statistics
Nº of enabled mobile devices (16.631)
Nº of mobile devices effectively used (13.344) Nº of enabled users of mobile broadband services (10.810)
24 use of 3G services as the video-telephony, transmission of data by broadband, mobile Tv, etc. And from them, 2.695 in that month also used internet.
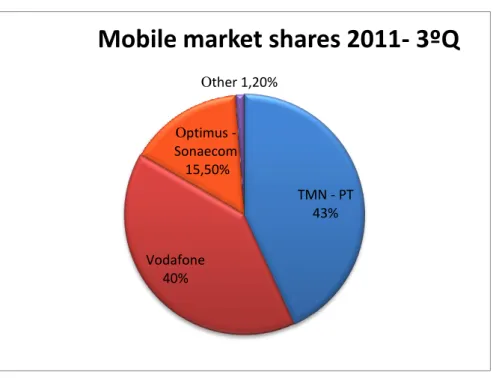
The mobile market is mainly disputed by 3 operators. At the 3rd quarter of 2011, TMN (that belongs to PT group) was the leader with 43,10% of market share, closely followed by Vodafone 40,20%, and then Optimus (Sonaecom) with 15,50%.
The “Other” market share corresponds to CTT with 0,4% and ZON with 0,8%.These two are competing in the market as MNVO (mobile virtual network operators).
Basically, to increase the competition in the sector, ANACOM allowed these MNVO contracts that permit to the new player the use of radio frequencies of some already existing operator, so they did not have to do large investments to acquire license and the infrastructure needed as the other players did before them.
CTT celebrated a contract with TMN in 2007, and ZON started in 2008 a 5 year contract with Vodafone.
Figure 9. Source:ANACOM
Clients tend to choose their operator depending on which operator that their relatives or
TMN - PT 43% Vodafone 40% Optimus -Sonaecom 15,50% Other 1,20%
25 friends have. This is due to the fact of the recent emergence of special tariff plans that allow the clients from same network and same tariff to have free calls and SMS/MMS between them19.
Since the launch of these plans, there was an increase by 9,5% of the number of conversation minutes done in the same operator, representing now 78,5% of the total weight of traffic in Portugal. Consequently there was a substantial reduction in calls off-net and from cellphone to fixed phone.
This new market paradigm translates into a difficulty for the smaller which do not possess in the moment so many clients as the Vodafone and TMN, and therefore, it will be more difficult to attract new clients and increase market share.
With this in mind, Anacom, supported by the Troika memorandum of understanding announced, in November 8, 2011, the will to reduce the mobile termination rates.
This is traduced in the fee that one player has when its client terminate a call in another operator´s network, which being lower, will favor the smaller players (costs reduction) and therefore will improve the general competition.
The Annex 12 shows the future evolution of the mobile termination rates implied in the Anacom´s proposal for the tariffs contemplating quarterly adjustments to be implemented starting in 1 February 201220.
19 Regarding Special Tariff plans; Vodafone has Extreme, TMN has the MOCHE, Optimus has the Tag
20
The new rates are set based on a LRIC cost model ("Long Run Incremental Costs"), published simultaneously with the proposal. This model is in line with the recommendations of the European Comission to the mobile termination rates.
26
3. ZON and Sonaecom Valuation
3.3 Valuation
A brief overview of Zon and Sonaecom history and source of revenues can be seen in Annex 2 and Annex 4, respectively.
In order to properly evaluate ZON and Sonaecom, a relative valuation for a broader view of the Europe telecom market was done (Relative Valuation Chapter), and then the Discounted Cash Flow method was applied for an individual and more detailed assessment of the enterprises under valuation (Discounted Cash Flow Valuation Chapter).
On the first methodology, a group of comparable companies was carefully chosen, and some multiples were used, in order to do a proper peer analysis.
Regarding the second methodology, it is important to state that the last historical data of Sonaecom and ZON results was from their 9m11 reports.
First, these values were converted into 2011 final year results. This was done in a very simple way known as trailing estimate: For the last quarter of 2011, the same evolution that happened on the last quarter of 2010 was assumed for the whole year (comparing the values of 9m 2010 and FY 2010 reports of the respective company).Having then the FY 2011 results, a more complex preview for the FY results of the coming years was made, through the construction of the forecasted income statements for a 5 years time frame (Income Statement Preview chapter).
It was decided not to extend the period of 5 years to a larger one, since it was believed that it would result in a more subjective analysis and therefore a valuation with less accuracy at a general level.
Then, over that forecasted years, where a terminal value was added, it was achieved the discounted free cash flows. This method is divided in two chapters, on the cash-flows calculation (Free Cash-flows chapter) and finally, the discount rate calculation and its application (Discounted Cash-Flows chapter).
Finally, the Enterprise, Firm and Equity value of each company were calculated, where the farthest output was the price target of Sonaecom and ZON (Equity Value chapter).
27
3.3.1 Relative Valuation 3.3.1.1 The Peer Group
As it was explained before, to get a more realistic output on relative valuation, is determinant a careful choice of the companies which will belong to the peer group and therefore, will influence the average multiple to be used to the evaluation.
Regarding this topic, the research was performed using the database provided in Damodaran website21: The information available was updated in January 2012 according to the prices and values of 31-December-2011 that were collected from a variety of sources, mainly Capital IQ data and Bloomberg.
Damodaran (2002) recommends analysts to choose comparable firms with similar values in terms of cash flows, growth and risk. In order to get the best possible comparable firms according to Damodaran perspective, the best way to deal with the growth and risk influences is to choose companies within the same industry and same region of the companies under evaluation, in this case, ZON and Sonaecom.
The goal was to include in this group 10 companies, in this way, a bad choice of one specific company wouldn’t have such a great impact as it would have if the chosen group was just 5 enterprises for instance
Selecting companies from Europe, and then filtering them for 4 industries (Cable TV, Telecom Equipment, Telecom Services and Telecom Wireless) it reduced the statistical universe to 148 firms. After this, it was excluded companies from European countries that are not considered so mature and developed as the Portuguese one.
Then, the way to elect the final group of companies was a short research about the telecom leader (market share in the cable-Tv and wireless networking sector) in the remaining mature countries.
Finally, it was reached the peer group, as well as the rubrics necessary to the calculation of the multiples, as it is showed on the Annex 13.
28
3.3.1.2 The Multiples
In the table bellow one can see the alternative ratios for each of the 3 multiple group for the peer analysis. The Enterprise Value, used to the most of the ratios, was calculated from the prior table as equal to the Equity market value plus Debt market value minus Cash and equivalents. In the last row, a simple average was made over the respective multiples of each company:
Table 2.Enterprise Value in millions and in Euro currency.
Peer comparison analysis has one big assumption: The peer group is, on average, fairly valued. This intuitive method allows an analyst to evaluate a company in a faster way by choosing a multiple from a company and comparing with the average.
One can easily see, that, in general the relative valuation indicates that Sonaecom is quite underestimated when compared with the average, while ZON depends more on the analyzed ratio.
For a more detailed analysis, the calculated average comparable multiple were applied to the financial data of ZON or Sonaecom (Sales, EBITDA, EBIT, Net income, book values) obtaining the implied market equity value of the respective company.
Per ratio (Price-Earnings ratio) EPS ratio (Earnings per Share) EV/EBIT EV/ EBITDA PBV (Price-to-Book Value) EV/IC PS ratio (Price to Sales) EV/ Revenues ZON 1.549,5 22,4 0,1 17,3 4,9 3,1 1,1 0,8 1,8 Sonaecom 703,0 5,4 0,2 5,5 2,8 0,4 0,8 0,5 0,8 Portugal Telecom 13.323,0 0,6 7,1 14,7 8,8 0,9 1,0 1,0 3,4 Telefonica 121.052,7 5,8 2,3 9,3 5,1 2,5 2,2 0,9 1,9 Belgacom 9.358,4 5,9 4,1 8,0 4,8 2,3 3,6 1,1 1,4 Deutsche Telekom 87.992,9 21,8 0,4 12,0 4,7 0,9 1,2 0,6 1,4 British Sky Broadcasting Group 18.094,5 15,1 0,6 13,1 10,2 12,2 4,4 1,9 2,2 France Telecom 68.333,3 6,3 1,9 7,5 4,3 0,9 1,8 0,7 1,4 Swisscom 23.111,6 10,2 29,0 9,8 6,2 3,5 3,4 1,5 2,3 Telecom Italia 51.347,3 4,7 0,2 7,4 4,2 0,5 2,1 0,5 1,8 Telekom Austria 7.842,9 20,2 0,5 14,6 5,1 5,1 2,5 0,8 1,6 Average 36.609,9 10,8 4,2 10,8 5,6 2,9 2,2 0,9 1,8 Name of the company Enterprise Value
29 Doing the comparison between the implied and the real market equity22 of the company, it is possible to verify if, when compared with its peers, and according with that specific multiple, the company is overvalued or undervalued in the Stock Exchange.
The peer analysis is going to be focused in 4 different multiples that are considered the best ones and the most appropriate to cover this theme:
Table 3.Values in Millions (average multiples are in units)
Table 4.Values in Millions (average multiples are in units)
Looking to table 11, over EV/EBITDA ratio, it is possible to conclude that, while Portugal Telecom is beating the peer group, both ZON and Sonaecom are undervalued by the market, since they are below the average.
Regarding the same ratio, on the table 12 and 13, is presented which fair price (implied equity market value), according to the peer analysis, they would have: ZON 915,3 M € and Sonaecom 1.135,9 M €, both higher than the real equity market value. To highlight the supposedly fair price of Sonaecom; which is more than the
22
In this case, the real market to equity is the multiplication between the price per share at 31/12/2011 by the number of outstanding shares in the same day.
Multiples Average Implied Enterprise Value Implied Equity Market value Equity Market Value 30-06-2011 Sonaecom Potential EV/EBITDA 5,6 1.393,9 1.135,9 155,3%
PER (Price-Earnings Ratio) 10,8 1.151,1 893,1 100,7%
PS (Price-to-Sales) 0,9 1.118,7 860,7 93,4%
PBV (Price-to-Book Value) 2,9 3.246,7 2.988,7 571,6%
445,0
Sonaecom
Multiples Average Implied
Enterprise
Implied Equity Market value
Equity Market
Value ZON Potential
EV/EBITDA 5,6 1747,3 915,3 27,6%
PER (Price-Earnings Ratio) 10,8 -486,9 345,1 -51,9%
PS (Price-to-Sales) 0,9 1642,0 810,0 12,9%
PBV (Price-to-Book Value) 2,9 1510,9 678,9 -5,4%
717,5
30 double of its actual price (445 M €), meaning that, according to its achieved EBITDA (FY 2011); assuming that it is an amount to be maintained and not an exceptional performance, the Sonaecom share price should be twice the price they are being negotiated (155,3% potential), representing a good investment opportunity.
Analyzing the Price-to-Earnings ratio, while the poor net income achieved by ZON suggests now that its stock is overvalued, Sonaecom once more outperforms the market peers: It is easy to verify that, considering the amount of net Income generated by Sonaecom, the implied equity market value is higher than the real market value (893,1 M € versus 445 M €), indicating a growth potential on the share price.
From revenues perspective, according to the Price-to-Sales multiple, the findings over Sonaecom and ZON indicate that both are undervalued by the market, but especially Sonaecom, since it had achieved higher revenues than ZON in 2011 TE (909,6 M € versus 856 M €), when its real market value is just 62% of its comparable. Once more, this multiple clearly shows that Sonaecom deserves to be higher priced.
According to the Price to Book value ratio calculated, ZON is overvalued by the market whereas SONAECOM is, once more, priced below its implied value. This happens due to the fact this ratio takes into consideration the book value of equity: Unlike ZON, Sonaecom presents high values in the financial statements rubrics of Capital and Reserves and Retained Earnings.
Concluding:
On the one hand, no relevant findings can be taken from ZON evaluation, since depending on the studied multiple, different directions are indicated:
Looking for the obtained Sales and EBITDA values, comparing to the peer group ZON price should be higher, but analyzing the ZON´s EBIT or Net income figure, the share price would now be overvalued, meaning that the presented level of depreciations and amortizations and the amount of financial costs are too high and the market should end to punish that.
31 On the other hand, regarding Sonaecom; even considering different rubrics of the income sheet, they all suggest that Sonaecom performance results are not well illustrated in its current real price:
They tell an investor that, assuming that the peer group was well chosen, and if it is fairly priced, Sonaecom should be priced higher. This represents a good opportunity of investment, since it is believed a growth potential for its shares price.
32
3.3.2 Discounted Cash-Flow method 3.3.2.1 Income Statement Preview 3.3.2.1.1 Operating Revenues
Telecommunication Revenues (ZON and Sonaecom)
Regarding the telecommunication revenues, it was not possible to access to the revenues disaggregation which difficult the general forecast. Obviously due to strategy and marketing reasons, neither ZON nor Sonaecom reports provide information about the amount of revenues originated by the different multi-play offers available, or by each of the individual segment.
Therefore, to facilitate the preview of the Telecom revenues, some assumptions were made:
The telecom revenue was divided in 4 single segments: Pay-Tv, Fixed Broadband, Fixed Voice and Mobile (which includes Voice & Broadband services). Meaning that each segment has its portion of revenues; and, ignoring existent multiplay-offers, these 4 segments would totalize the telecom revenues of the firm.
Having the 2011 total telecom revenues (by trailing estimate), and knowing the number of clients by each segment (provided by the firm report), it was assumed that the individual revenue was directly proportional to the % of costumers in that segment, ignoring different prices each service would have.
For the revenues forecast of each individual segment it was assumed two inputs, with the same level of importance:
a) The expected evolution in terms the Market Value of that segment (taking into account the price variation and growth of number of subscribers)
b) The expected evolution of the Firm service market share in the Portuguese telecom market.
To estimate the evolution of the Market Value (a), 3 inputs were into account, also discussed throughout the market analysis chapter:
Historical and actual trend of the Portuguese Market (evolution on the number of subscribers and penetration rates);
33 Growth potential of the Portuguese Market (comparison between Portuguese
penetration rates versus the European average penetration rate);
Importance of the segment for the clients (associated also to the macroeconomic scenario) which influences the client growth as well the variation in the price product.
The preview for the evolution of the market share of each firm (b), came from the analysis of the historical market share evolution of the players in that service (Annex 14 and 15). It was considered that the last years trend23 can fairly reflect the service technology used by the firm, when compared with the competition technology24.
The table 14 presents the annual growth forecast by general Market value, and by each firm Market Share.
Table 5.
23 For the market share evolution preview it was considered data from 2008 to 2011, and three different
levels of importance were given for each year growth: 2008-2009:2,5%; 2009-2010:7,5%; 2010-2011:90% (Annex 20 and 21)
24
The service technology is directed associated with the provided service quality and therefore, to the satisfaction of the client with that service compared with the competition.
Market Value (General) Zon Market Share Sonaecom Market Share Pay-Tv 3,0% -7,5% 4,5% Fixed Broadband 4,0% 2,1% -22,8% Fixed Voice -2,0% 4,9% -7,2%
Mobile (Voice & Broadband) 2,0% 1,0% -2,0%
34 Considering the two inputs, the result was the final growth per year by segment, which was directly applied25 to the respective revenues of the firm over the years.
Table 6.Values in Millions and in Euro currency
Table 7.Values in Millions and in Euro currency
In general the preview for Sonaecom telecom revenues is slightly negative. For the mobile segment, the most important for Sonaecom, maintenance is expected, thus the negative impacts come from the Fixed segment (CAGR26: -10,3%). The fixed broadband revenues decrease reflects the lack of Sonaecom’ quality technology in this segment, whil the general market of fixed voice is declining and, Optimus is going along with the movement.
On the other side, Zon telecom revenues are slowly increasing (CAGR: +0,4%), and that fact is directly associated to the segments mentioned above. Note that Zon revenues are increasing in 3 of 4 segments, but the general output it is not so fascinating. This happens due to the the huge decline showed in its Pay-tv Market Share, which is still its largest source of sales.
25
Growth per year by segment “A”= ((1+growth in the Market Value segment “A”) X (1+ growth in the Firm Market Share segment “A”))-1
26 CAGR: Compound Annual Growth Rate: Is the year-over-year growth rate of an item over a specified
period of time. It is calculated by taking the nth root of the total percentage growth rate, where n is the number of years in the period being considered.
Sonaecom Telecom Revenues Growth Per year 2012 P 2013 P 2014 P 2015 P 2016 P Pay-Tv 7,6% 17,3 18,6 20,0 21,6 23,2 Fixed Broadband -19,7% 61,7 49,6 39,8 32,0 25,7 Fixed Voice -9,0% 111,0 101,0 91,9 83,6 76,0 190,1 169,2 151,7 137,1 124,9
Mobile (Voice & Broadband) 0,0% 578,3 578,1 577,9 577,6 577,4
Total of Fixed Revenues
ZON Telecom Revenues Growth
per year 2012 P 2013 P 2014 P 2015 P 2016 P
Pay-Tv -4,76% 352,4 335,6 319,7 304,4 290,0
Fixed Broadband 6,20% 183,3 194,7 206,7 219,5 233,1
Fixed Voice 2,77% 206,5 212,2 218,1 224,2 230,4
Mobile (Voice & Broadband) 3,02% 32,6 33,6 34,6 35,7 36,7
774,8 776,1 779,1 783,8 790,2
35 ZON- Other Operational Revenues
Beyond, the telecom revenues, ZON is present on the Cinema and Audivisuals revenues. The table 17 shows the future behavior expected in ZON other operational revenues:
Table 8.Values in Millions and in Euro currency
Cinema and Audiovisuals Revenues
The business unit ZON Lusomundo, subdivided in the Cinema and Audiovisuals areas was already described in the ZON overview chapter. The revenues from these two segments could be forecasted from the evolution of the general market and the actual/historical position of ZON in these markets27.
About the distribution segment –Audiovisuals- had a negative evolution associated with the strong drop of DVD sales, directly affected by the actual crisis moment that is happening in Portugal. ZON also had a negative evolution (-2,5% in gross revenues), however not as bad as the general market, reinforcing it as the big reference in the national market (Annex 16).
In the management of the film exhibition spaces- Cinemas - not being a basic need, the evolution was negative from 2010 to 2011: there was a decrease of 5,2% at number of admissions and of 2,9% in gross revenues.
ZON followed the trend with a negative evolution of 3,9% of assistants in the last year. However, the 3D technology allowed to an increase in the price and therefore, ZON beat the market and achieved a positive growth of 0,6% in gross revenues in the last
27
Cinema and Audiovisuals market data was taken from ICA (Instituto do Cinema e Audiovisual) website as from “ Anuário Estatístico do ICA” 2010.
Growth Per year 2011 Trailing Estimate 2012 P 2013 P 2014 P 2015 P 2016 P Audiovisuals -4,0% 69,9 67,1 64,4 61,9 59,4 57,0 Cinema Exhibition 1,0% 59,2 59,8 60,4 61,0 61,6 62,3