Guilherme Cadete Paixão da Costa
Licenciatura em Engenharia de MateriaisSetembro de 2019
3D Printed Graphene Based Supercapacitors
Dissertação para obtenção do Grau de Mestre em Engenharia de Materiais
Orientador: Professora Doutora Isabel Mercês Ferreira, Professora Associada, FCT-UNL
Júri:
Presidente: Doutor João Paulo Miranda Ribeiro Borges
I 3D Printed Graphene Based Supercapacitors
Copyright © Guilherme Cadete Paixão da Costa, Faculdade de Ciências e Tecnologia, Universidade Nova de Lisboa.
A Faculdade de Ciências e Tecnologia e a Universidade Nova de Lisboa têm o direito, perpétuo e sem limites geográficos, de arquivar e publicar esta dissertação através de exemplares impressos reproduzidos em papel ou de forma digital, ou por qualquer outro meio conhecido ou que venha a ser inventado, e de a divulgar através de repositórios científicos e de admitir a sua cópia e distribuição com objetivos educacionais ou de in-vestigação, não comerciais, desde que seja dado crédito ao autor e editor.
III
IV
Agradecimentos
Gostaria de começar por agradecer à Professora Dra. Isabel Ferreira, que me ori-entou a tese e sempre se demonstrou recetível e disponível para todas as minhas dúvidas e ideias, fomentando sempre a procura de respostas através da experimentação.
Um especial agradecimento ao Nuno Lima, que aturou todos os meus brainstorms contribuindo com ideias que levaram à progressão deste trabalho de uma forma bem mais eficiente.
Não posso deixar de agradecer a todos os membros da equipa da Professora Isa-bel, que se mostraram sempre disponíveis a acompanhar-me e ensinar-me procedimen-tos que nunca tinha feito. Sem vocês isto não tinha corrido tão bem.
Obrigado ao professor Rui Silva que no decorrer do curso sempre estabeleceu qual o perfil que um engenheiro deve ter, dando o exemplo. Obrigado por estar sempre dis-ponível para ensinar.
Além, Dias, Carrelo, joseph, JP, Moniz, Magda, Moura e Fred obrigado por fazerem destes anos de faculdade dos melhores da minha vida.
Ao concilio, um obrigado por me aturarem todos estes anos. À minha namorada Inês, obrigado por tudo.
Obrigado aos meus pais por sempre me darem a liberdade para crescer e por me proporcionarem as experiências mais importantes que tive, ao meu irmão por não me ter agradecido na tese dele.
Por fim, à minha avó, que sempre incentivou os netos para sonharem.
Este trabalho teve o apoio financeiro dos seguintes projectos: ERC-CoG-2014, Cap-TherPV, 647596; ERC-POC-2019,CAPSEL, 855018 e UID/CTM/50025/2019.
V
Abstract
This thesis aims to develop graphene-based supercapacitors. There is an emerging interest in the development of lightweight, high capacity and high durability superca-pacitors. As the electronic equipment are getting lighter and lighter but simultaneously requiring more power supply, the energy density of batteries and/or supercapacitors should respond to this demand. Therefore, graphene-based supercapacitors have been investigated as potential material for high capacity power sources. The graphene is a very light material and has a huge surface area together with high conductivity, thus it is ideal for charge accumulation.
In this work graphene was obtained by electrochemical exfoliation as a greener and harmless technique when compared to Hummer’s method. Two rods of graphite we used as electrodes for electrochemical exfoliation in a bath of H2SO4 , being studied the influence of acid concentration and applied potential on the graphite/graphene powder quality. That was evaluated by XRD, SEM and micro Raman spectroscopy.
The obtained graphene-oxide powder was mixed with a polymeric binder agent and then used to print electrodes. The conductive of electrodes was optimized with a thermal treatment around 350ºC in different atmospheres. The performances of super-capacitors were tested for two different geometries, vertical (sandwich type) and planar (inter-digital configuration). These devices were studied for their stability and capaci-tance by CV curves and electrochemical impedance spectroscopy.
This work proves that it is possible to use graphene-oxide powder, produced via electrochemical exfoliation, to make 3D printable inks for supercapacitors applications.
Key words: Supercapacitors, 3D printing, graphene-oxide, electrochemical exfolia-tion.
VI
Resumo
Esta tese tem como objetivo desenvolver supercondensadores baseados em gra-feno. O interesse no desenvolvimento de supercondensadores leves, com elevada capa-cidade e estabilidade tem emergido nos últimos anos. À medida que os equipamentos eletrónicos ficam cada vez mais leves e cresce também a sua necessidade de consumo de energia, dispositivos como os supercondensadores podem dar resposta a esta neces-sidade. Portanto, os supercondensadores à base de grafeno têm vindo a ser investigados como material promissor para aplicações em fontes de energia de alta capacidade. O grafeno é um material extremamente leve com uma enorme área superficial, combinada com uma elevada condutividade, sendo por isso ideal para acumulação de cargas.
Neste trabalho, o grafeno foi obtido por exfoliação eletroquímica por ser uma téc-nica mais ecológica e menos perigosa quando comparada com o método de Hummer. Duas barras de grafite foram usadas como elétrodos num banho de H2SO4 e foi estudada a influência da concentração de ácido e do potencial aplicado na qualidade do pó gra-fite/grafeno obtido. DRX, SEM e espetroscopia de micro Raman foram as técnicas de caracterização utlizadas para avaliar a qualidade do material.
O pó de óxido de grafeno obtido foi misturado com um ligante polimérico a usado para imprimir elétrodos. A condutividade dos elétrodos foi otimizada com tratamento térmico a 350°C em diferentes atmosferas. O desempenho dos supercondensadores foi testado para duas geometrias diferentes, vertical (tipo sanduiche) e planar (configuração interdigital). A estabilidade e capacidade destes dispositivos foi estudada através de cur-vas CV e espetroscopia de impedância eletroquímica.
Este trabalho prova que é possível usar pó de óxido de grafeno, produzido por exfoliação eletroquímica, para fabricar pastas para impressão 3D e com elas produzir supercondensadores com qualquer geometria.
Palavras-chave: Supercondensadores, impressão 3D, oxido de grafeno, exfoliação eletroquímica
VII
Table of contents
1. MOTIVATION AND OBJECTIVES ... 12
2. INTRODUCTION ... 13
2.1 CARBON BASED MATERIALS ... 13
2.1.1 Synthesis ... 14
2.2 SUPERCAPACITORS ... 15
2.2.1 Electrodes ... 16
2.2.2 Electrolytes ... 16
2.2.3 3D printing... 17
3. MATERIALS AND METHODS ... 18
3.1 Production methods ...18
3.2 Characterization ...19
4. RESULTS AND DISCUSSION ... 21
4.1 GO POWDER PRODUCTION ... 21
4.1.1 Influence of the potential applied ... 21
4.1.2 Influence of the sulfuric acid concentration ... 23
4.1.3 SEM analysis ... 25
4.2 INK PRODUCTION ... 26
4.2.1 GO concentration influence ... 26
4.2.2 Heat treatment temperature and atmosphere Influence ... 28
4.2.3 Surfactant concentration influence ... 29
4.3 PRINTING THE ELECTRODES ... 31
4.3.1 SEM/EDS characterization ... 31
4.4 CAPACITORS ... 33
4.4.1 Contacts influence. ... 34
4.4.2 Electrolyte influence ... 35
4.4.3 Geometry Influence ... 37
4.4.4 Electrochemical impedance spectroscopy ... 38
4.4.5 Charge/discharge cycle stability ... 39
4.4.6 Device's time stability ... 41
5. CONCLUSION AND FUTURE ... 43
6. BIBLIOGRAPHY ... 45
7. ANNEXES ... 48
ANNEX A... 48
ANNEX B ... 51
VIII
List of tables
TABLE 4.1-GO POWDER YIELDING FOR THE DIFFERENT POTENTIALS TESTED. ... 21
TABLE 4.2-GO POWDER YIELDING FOR THE DIFFERENT SULFURIC ACID CONCENTRATIONS TESTED. ... 23
TABLE 4.3-MEAN RESISTIVITY OF THE INKS PRODUCED WITH DIFFERENT GO CONCENTRATION.MEAN RESISTANCE CALCULATED USING VALUES IN TABLE B1 IN ANNEX B. ... 27 TABLE 4.4-MEAN RESISTIVITY OF THE INKS HEAT TREATED WITH DIFFERENT ATMOSPHERES.MEAN RESISTIVITY
CALCULATED USING VALUES IN TABLE B2 IN ANNEX B. ... 28
TABLE 4.5-MEAN RESISTIVITY OF THE INKS HEAT TREATED AT DIFFERENT TEMPERATURES WITH A NITROGEN ATMOSPHERE.MEAN RESISTIVITY CALCULATED USING VALUES IN TABLE B3 IN ANNEX B. ... 29
TABLE 4.6-SURFACTANT INFLUENCE ON THE INK’S RESISTIVITY.MEAN RESISTIVITY CALCULATED USING VALUES IN TABLE B4 IN ANNEX B. ... 30 TABLE 4.7-EDS QUANTIFICATION OF THE ELEMENTS PRESENTS IN THE ELECTRODE'S SURFACE. ... 32 TABLE 4.8-SPECIFIC CAPACITY OF SAMPLE 1I USING A SIMULATED SWEAT SUBSTANCE AS ELECTROLYTE WITH THE
DIFFERENT CONTACTS. ... 35
IX
List of figures
FIGURE 2.1-RAMAN SCATTERING SPECTRA FOR DIFFERENT CARBON-BASED MATERIALS.ADAPTED FROM [5] ... 13
FIGURE 2.2-SCHEMATICS OF GRAPHENE OXIDE SYNTHESIS FROM GRAPHITE A) GRAPHITE STRUCTURE. B) GRAPHENE OXIDE WITH HIGHLIGHTED FUNCTIONAL GROUPS. C) REDUCED GRAPHENE OXIDE WITH HIGHLIGHTED FUNCTIONAL GROUPS.[17] ... 14
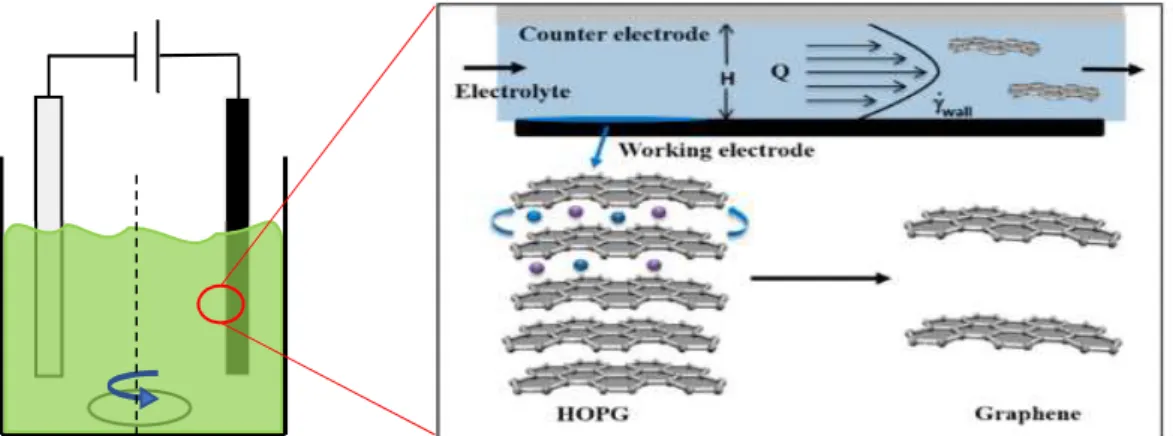
FIGURE 2.3-SCHEMATIC REPRESENTATION OF THE ELECTROCHEMICAL EXFOLIATION MECHANISM ON THE SURFACE OF A GRAPHITE ROD.ADAPTED FROM [18]... 15
FIGURE 2.4-SCHEMATIC OF THE 3D PRINTED INTERDIGITATED ELECTRODES.ADAPTED FROM [34] ... 17
FIGURE 3.1-SCHEMATIC REPRESENTATION OF ELECTROCHEMICAL EXFOLIATION OF GRAPHITE RODS FOR GO PRODUCTION. ... 18
FIGURE 3.2-ELECTRODES GEOMETRY DESIGNS STUDIED:(A) PLANAR,(B)INTERDIGITAL ... 19
FIGURE 3.3-GAMRY INSTRUMENTS POTENTIOSTAT/GALVANOSTAT/ZRA3000 USED TO DO THE ELECTROCHEMICAL CHARACTERIZATION FOR THIS THESIS ... 20
FIGURE 4.1-GO POWDER YIELDING VERSUS ELECTRICAL POTENTIALS APPLIED. ... 21
FIGURE 4.2-RAMAN SPECTRA OF POWDER PRODUCED BY APPLYING (A)5V,(B)10V,(C)13V AND (D) THE RESPECTIVE XRD PATTERN. ... 22
FIGURE 4.3-GO POWDER YIELDING VERSUS SULFURIC ACID CONCENTRATIONS TESTED... 23
FIGURE 4.4-RAMAN SPECTRA OF POWDER PRODUCED WITH SULFURIC ACID CONCENTRATION OF (A)0.2M,(B) 0.5M,(C)1MV AND (D) THE RESPECTIVE XRD PATTERN... 24
FIGURE 4.5-SEM IMAGES OF GO POWDER OBTAINED WITH MAGNIFICATIONS OF (A)4200×,(B)4400×,(C) 7300× AND (D)13500×. ... 25
FIGURE 4.6-SAMPLES PRODUCED BY EXTRUDING INK THROUGH A 1ML SYRINGE. ... 27
FIGURE 4.7-MEAN RESISTIVITY VERSUS DIFFERENT GO CONCENTRATION OF INK. ... 27
FIGURE 4.8-MEAN RESISTIVITY VERSUS TEMPERATURE TREATMENT OF INKS IN NITROGEN ATMOSPHERE... 29
FIGURE 4.9-DIFFERENCE BETWEEN THE SAMPLES PRODUCED USING INK (A) WITHOUT AND (B) WITH SURFACTANT. ... 29
FIGURE 4.10-SEM ANALYSIS OF THE PRINTED ELECTRODES SURFACE WITH DIFFERENT MAGNIFICATIONS (A) ×1500 AND (B)×5000... 31
FIGURE 4.11-EDS CHARACTERIZATION OF THE ELECTRODE'S SURFACE IN THE (A) TARGETED AREA CONTAINING (B) CARBON,(C) FLUORINE AND (D) OXYGEN ELEMENTS. ... 33
FIGURE 4.12-EXAMPLE OF THE ELECTRODE’S GEOMETRIES STUDIED IN THIS THESIS.(A) PLANAR AND (B) INTERDIGITAL GEOMETRIES. ... 34
FIGURE 4.13-CYCLIC VOLTOMETRIES PERFORMED FOR DIFFERENT CONTACTS IN SAMPLE 1I WITH A SIMULATED SWEAT SUBSTANCE AS ELECTROLYTE. ... 35
FIGURE 4.14-CYCLIC VOLTOMETRIES PERFORMED FOR THE DIFFERENT ELECTROLYTES STUDIED IN SAMPLES 1I. .. 36
FIGURE 4.15-ELECTRICAL CONDUCTIVITY VARIATION WITH FREQUENCY FOR SAMPLE 6I. ... 36
FIGURE 4.16-HYDROPHOBICITY SHOWN BY THE PRINTED ELECTRODES. ... 37
FIGURE 4.17-CYCLIC VOLTAMMETRY CURVES OF THE TWO GEOMETRIES TESTED (A) INTERDIGITAL (SAMPLE 1I) AND (B) PLANAR (SAMPLE 1P). ... 37
FIGURE 4.18--TEST RESULTS OF THE SPECIFIC CAPACITANCE FOR THE GEOMETRIES TESTED AT DIFFERENT SCAN RATES ... 38
X
FIGURE 4.19-EQUIVALENT CIRCUIT MODELING OF THE INTERFACIAL PROCESSES AT THE DOUBLE LAYER AND CONSIDERING BULK PROCESSES.ADAPTED FROM [39]. ... 38 FIGURE 4.20-(A)BODE AND (B)NYQUIST PLOTS FOR THE INTERDIGITAL GEOMETRY (SAMPLE 1I) AND (C)BODE
AND (D)NYQUIST PLOT FOR THE PLANAR GEOMETRY (SAMPLE 1P) USING THE FITTING MODEL FOUND IN LITERATURE [40]. ... 39
FIGURE 4.21-CURRENT AND POTENTIAL VARIATIONS THROUGH CHARGE AND DISCHARGE CYCLES 800,801 AND
802 FOR THE (A) PLANAR (SAMPLE 1P) AND (B) INTERDIGITAL GEOMETRY (SAMPLE 8I). ... 40
FIGURE 4.22-1000 CYCLES OF CYCLIC VOLTAMMETRY PERFORMED ON (A) PLANAR (SAMPLE 1P) AND (B) INTERDIGITAL GEOMETRIES (SAMPLE 8I), AND 1000 CHARGE/DISCHARGE CYCLES PERFORMED ON THE SAME
(C) PLANAR AND (D)INTERDIGITAL GEOMETRIES DEVICES. ... 41
FIGURE 4.23-BEHAVIOR PROGRESSION OF THE SUPERCAPACITORS PRODUCED FOR 2 MONTHS.(A)CV CURVE AND
XI
Acronyms
CV Cyclic voltammetry
DMF Dimethylformamide
EDLC Electric Double Layer Capacitors EDS Energy-dispersive X-ray spectroscopy EIS Electrochemical impedance spectroscopy ɛ0 Dielectric constant of vacuum (8.85 × 10⁻¹² F/m) ɛr Relative dielectric constant
GO Graphene oxide
HOPG Highly oriented pyrolytic graphite
M Molar
PVA Polyvinyl alcohol
PVDF Polyvinylidene fluoride
rGO Reduced graphene oxide
SEM Scanning electron microscope
12
1. Motivation and objectives
We live in a world where there is an increasing demand for better ways to store and transport energy. Each day more products are equipped with electronical compo-nents, and so this energy storage crisis is reaching almost every sector, from mobile phones to cars.
Supercapacitors promise to be the best option, when granting greater energy den-sities while preserving the power density of the conventional capacitor. Indeed, when compared to the common batteries supercapacitors can provide higher power in the same volume, but stores less amounts of charges, making it ideal for applications where high power bursts are necessary but no high energy storage capacity is needed [1].
Graphene raises as a super material related to several field of studies, from high-performance nanocomposites to electronics [2]. Possessing such fascinating properties, this material promises to transform several areas, including supercapacitors technology, thanks to its high surface area.
The principal purpose of this work is to fabricate graphene-based supercapacitors employing environmentally friendly methods for obtaining electronic quality graphene and the complete supercapacitor as well. Therefore, the work was divided in three main steps:
Optimization of the electrochemical exfoliation for the graphene oxide powder production.
Production of a 3D printable ink using GO powder and a polymer-based agent.
13
2. Introduction
Supercapacitors show promising properties for being the power devices of the future applications, being the subject of several studies in the last few years [3]. In this thesis 3D printed graphene-based supercapacitors were developed and characterized.
2.1 Carbon based materials
Graphene by definition is an isolated single-atom layer of graphite where the car-bon atoms are arranged in a hexagonal bi-dimensional honeycomb lattice [4]. Because of its prodigious properties, such as high surface area and high electrical conductivity, this material has proved to be a viable option for electrodes in supercapacitors [2].
The carbon atoms in the crystal lattice are connected by two different bonds, a strong one (σ bond) and a weak one (π bond). The σ bond is composed of the hybrid orbitals sp2, which is the product of the 2p
x and 2py orbitals combined with the 2s orbital, granting the 6-atom cell covalent bonds between the atoms. On the other hand, the π bonds are the result of the 2pz orbital of each atom
mixed with the respective from the adjacent layer [5]. One of the best ways to the detect the existence or nonexistence of these bonds is Raman spectroscopy. When excited with a 532nm laser, the spectra obtained from carbon-based materials shows three main bands: D band at ~1350 cm−1; G band at ~1580 cm−1; and 2D band at ~2690 cm−1, as seen in Figure 2.1. Distinct crystallo-graphic proprieties can be related to each one of these bands: two primary in-plane vibrational modes are re-lated to the D and G band, while the 2D band is rere-lated to the second-order overtone of D [4],[6].
In theory, this material has a high intrinsic mobility of 4,4 × 104 cm2 V-1 s-1 [7] and a specific surface area of 2630 m2g−1 [8], which can only be obtained in small
Figure 2.1 - Raman scattering spectra for different carbon-based materials. Adapted from [5]
14
samples or in specific substrates making it not available for large scale applications. But graphene alone is a material capable of a wide range of application in electronics [9]– [11].
2.1.1
Synthesis
Graphene can be synthesized through different routes, being the most used method chemical vapor deposition (CVD) [12] or mechanical exfoliation of bulk graphite [13]. Although these technics allow to obtain single-layer transferable graphene nanosheets of high purity, they show some limitations and are less adequate for large-scale applications. For industrial production of graphene-like materials the chemical syn-thesis route as shown to be the most promising way [8].
One way to achieve significant quantities of graphene-based single sheets is the chemical conversion of graphite into graphene oxide, and its posterior reduction [14]. The manufacturing of this material is being study for over 150 years, and since then three methods have emerged: Brodie[15], Staudenmaier[16] and Hummers method [17]. In all these three methods fuming acids are used to oxidize the graphite layers and obtain GO. With these methods it is possible to obtain a layered material of oxygenated graphene sheets with different oxygen functional groups throughout its basal planes and edges, as shown in Figure 2.2 [18]. These functional groups are responsible for the graphene’s oxide hydrophilicity [19].
Figure 2.2 - Schematics of graphene oxide synthesis from graphite. a) Graphite structure, b) graphene oxide with highlighted functional groups and c) reduced graphene oxide with highlighted functional groups.[17]
Electrochemical exfoliation emerged as an alternative method using less aggressive agents. In this method 2 electrodes are half dipped in an electrolyte solution, being one of them a graphite rod, and a controlled potential is applied for a period of time. The electrochemical reactions occur on the external layer of the graphite electrode and de-taches layers of graphite by intercalation and/or exfoliation as shown in Figure 2.3. By
15
varying the electrolyte solution and the electric field applied, it is possible to control the defect density, oxygen content and thickness of the exfoliated nanosheet. This process has emerged as an efficient way to produce different types of high-quality 2D nanosheets in a cost-effective way and in large scale quantities, making it ideal for energy storage and conversion, sensors and electronics applications [20], [21].
The graphene oxide obtained by electrochemical exfoliation can be reduced by different methods like photo reduction, chemical reagent reduction and thermal anneal-ing, leading to reduced graphene oxide (rGO) [22]. The oxide functional groups from the graphene oxide surfaces are reduced by heat, causing a mass reduction of about 30% but some structural defects may affect the mechanical and electrical proprieties of rGO[23].
2.2 Supercapacitors
Capacitors are devices composed by two conducting electrodes separated by an insulating dielectric material. Charge accumulation at the electrodes happens when a potential difference is applied to the contacts of the capacitors. Energy is stored since the charges are kept apart by the dielectric layer, creating an electric field [24].
The capacitance defines the capacitor characteristics and can be calculated ratio between the stored charge, Q, and the applied voltage. The stored charge Is however, correlated with the area of each electrode, A, the permittivity of the dielectric layer, ɛr×ɛ0, and by the separation between electrodes, d, equivalent to the dielectric thickness in case of parallel plate capacitor[24].
𝐶 =𝑄 𝑉 =
ɛ ɛ 𝐴
𝑑 ( 1 )
Figure 2.3 - Schematic representation of the electrochemical exfoliation mechanism on the surface of a graphite rod. Adapted from [18]
16
The equation above shows that the capacitance is proportional to the area of elec-trodes in contact with dielectric and to be enhanced the dielectric constant needs to be very high, which is a great limitation in terms of materials that can be used, or the contact area need to increase to great extension. Therefore, a way to enhance capacitance is to use contacts with very large surface area, but as it needs to be in contact with dielectric, this must penetrate somehow into the porous electrode. Thus, liquid or low viscosity dielectric are needed. Several works have been developed In this high porosity electrodes for supercapacitors to enable them to fill the hole between the batteries and capacitors since they have specific power comparable with the one from the capacitors, while also possessing a specific energy capable of overlap some batteries [25].
The physical principles that control conventional capacitors, can be applied to su-percapacitors with some adaptations. However, these devices are capable of achieving far higher capacitances by employing electrodes with much bigger surface area and thin-ner dielectrics [24].
Electric Double Layer Capacitors (EDLC’s) are an example. The charges gathered at the surface form an electric double-layer, at both electrodes, causing an enhanced charge accumulation and consequently the capacitance of the device.
The Helmholtz model, proposed in 1853, allows to estimate the capacitance of these devices.
𝐶 𝐴=
ɛ
4𝜋𝛿 ( 2 )
Where C is the capacitance, A is the surface area, ɛ is the relative dielectric constant of the electrolyte and δ is the distance between the center of the ion layer and the elec-trode, which is usually a few Angstroms [26].
2.2.1
Electrodes
As previously noticed, the electrode surface area plays an important role in the capacitance, and so, graphene comes up as a prominent candidate as an electrode ma-terial. On account of its large surface area and 2D geometry, it can further improve the capacitance of such devices [10], [27]–[29].
2.2.2
Electrolytes
Besides the electrodes, EDLC’s require an electrolyte layer between the electrodes. This component calls for specific characteristics, being the most important the ion sizes of the electrolyte. This will determine the ion’s mobility and even its penetration in the
17
electrode’s active material, which has a direct influence in the response time of the device [30].
The use of solid or gel electrolytes over liquid ones is an important development, which allows the fabrication of devices more compact, more dependable, environmen-tally safe and safer for the user [31]. However, the ion mobility in these sorts of electro-lytes is much slower when compared to liquid ones, having a negative effect on the de-vice’s performance.
2.2.3
3D printing
3D printing is an additive manufacturing technique creates a wide range of struc-tures and complex geometries from three-dimensional model data. In this process suc-cessive layers of material are printed on top of each other, forming a solid material. There are several methods, materials and equipment involved in 3D printing, which have been evolving over the years promising to transform manufacturing and logistics processes [32].
In the recent past, graphene oxide has shown noticeable qualities and viscoelastic properties as an aqueous dispersion where its rheological behavior is highly influenced by the graphene oxide concentration. When the dispersion has low concentration of gra-phene oxide, it shows a liquid-like behavior, which is not suitable for 3D printing. On the other hand, for high concentrations, the dispersion exhibits gel-like behavior with a high elastic modulus, which allows to print fine filaments or complex 3D architectures [33]. Studies show that an interdigital geometry shows the best capacitance in supercapaci-tors, and extruding the ink directly from the nozzle and stashing it layer-by-layer allows a high mass loading per unit area, as shown in Figure 2.4 [34]. Furthermore, the GO flakes are aligned along the extruding direction due to the shear flow conditions, enhancing the electrode’s electrical conductivity [35].
18
3. Materials and methods
3.1 Production methods
The GO synthesis and electrodes formation methods are presented, and a short description of the techniques is included.
For GO powder production, two com-mercially available graphite rods were half immersed in a sulfuric acid solution with a given concentration. An electrical potential was applied to the rods for 10 minutes under heavy steering as shown in Figure 3.1. Solu-tions with concentraSolu-tions of 0.2, 0.5 and 1 molar and electrical voltages of 5, 10 and 13V were applied in to understand the im-pact of this parameters in the obtained pow-der quality. The volume of the solutions pre-pared was kept constant at 100mL per cycle of 10 minutes to avoid solution saturation.
The product of this reaction was poured into a glass container and it was left un-touched until the black powder settled. The solution was then removed carefully with a pipette. Distillated water was added to the remaining powder. This process was repeated until the solution pH was neutralized.
The container was put into an oven at 60°C until the solvent was fully evaporated, leaving only a black powder at the bottom of the container. The black powder was than stored and characterized.
The ink was prepared with 15mL of DMF and 1g of PVDF in a screwed flask. The solution was left under and at a temperature of 70°C until the PVDF was fully dissolved in the DMF. The flask was kept sealed to prevent DMF evaporation.
H2SO4
5-13V
Figure 3.1 - Schematic representation of electro-chemical exfoliation of graphite rods for GO produc-tion.
19
Inks with different concentrations of GO powder were produced, by adding it care-fully to a solution of DMF/PVDF under steering until the powder was care-fully homogenized in the solution. To this mixture different concentrations ofof GO powder were added: 73%, 75% or 80% together with μL of surfactant agent. The ink was then loaded into a 1mL syringe, with a 0,90 mm needle diameter.
The electrodes geometry designs were created using Autodesk Fusion 360, as shown in Figure 3.2. Interdigital and planar
geome-tries were studied. The electrodes were printed using a 3D Potterbot Micro-8 adapted to fit a 1mL syringe. The printing parameters were kept constant with ex-ception of the extrusion multiplier, which was ad-justed according to the ink viscosity. Nozzle diameter was set to 0,9 mm and default printing speed to 400 mm/min, with 100% infill.
The printed pieces were then submitted to a thermal annealing at 350°C with a nitrogen atmos-phere to reduce the graphene oxide.
To understand the impact the dielectric has on the device’s capacitance, two dif-ferent dielectrics were studied, one liquid and one solid. The liquid dielectric was a sweat like substance produced according to C. Callewaert and others [36].
The solid dielectric tested was a PVA|H2SO4 resin with a 1:1 proportion, like de-scribed by X. Ding et al [37].
Both dielectrics were deposited between the electrode's surfaces using a 1mL sy-ringe with a 0,9mm diameter needle
3.2 Characterization
Raman spectroscopy was carried out at the materials department (FCT/UNL) us-ing a Witec Alpha 300 confocal RAS with, equipped with a 532nm argon laser at 2mW of power. The laser beam was focused at different parts of the powder sample to access Its composition.
The surface morphology of the GO powder was obtained by scanning electron mi-croscopy. The SEM analysis were made with a Phenom XL during the materiais 2019 con-vection.
Figure 3.2 - Electrodes geometry designs studied: (a) planar, (b) interdigital
20
The surface morphology and EDS analysis of the heat-treated printed electrodes was acquired using Scaning electron microscope Hitachi S2400 with bruker light ele-ments EDS.
XRD analysis was used to characterize the crystalline nature and phase purity of the synthesized GO powder. An X-ray diffractometer PANalytical X'pert PRO equipped with and X'celerator detector using Cu Kα radiation at 45kV and 40mA In a Bragg-Bretano configuration was used to characterize the samples.
Small cylindrical pieces with constant diameter were produced by extruding the fabricated ink trough the nozzle of a 1mL syringe. The length of the different pieces was measured using IC Measure software. The resistance was then measured before and after heat treatment using a Xindar DBOL500n multimeter.
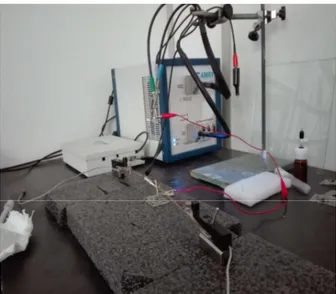
The supercapacitors fabricated were characterized in a Gamry Instruments poten-tiostat/Galvanostat/ZRA 3000, shown in Figure 3.3, using cyclic voltammetry sweeps from −0.5V to 0.5V with a step of 1mV at 9 different scan rates: 20mV/s, 40mV/s, 60mV/s, 80mV/s, 100mV/s, 200mV/s, 300mV/s, 400mV/s and 500mV/s.
EIS spectroscopy was also carried out for frequencies between 10 GHz and 10 mHz to access the equivalent circuit of the supercapacitors produced and determine the respective values.
Charge and discharge cycles were also done with a maximum charge time of 10 seconds and 1.5×10⁻⁴A of charge current. All the data obtained from these characterizations techniques was processed using Gamry Echem Analyst software.
Figure 3.3 - Gamry Instruments potentiostat/Gal-vanostat/ZRA 3000 used to do the electrochemical char-acterization for this thesis
21
4. Results and discussion
In this section the results of the GO powder obtained by electrochemical exfoliation and of the supercapacitors characterization are presented and discussed.
4.1 GO powder production
GO powder can be obtained by several methods but in this thesis the electrochem-ical exfoliation of graphite was the one tested and used to fabricate supercapacitors. To obtain the best quality of GO powder a preliminary study had to be conducted in order to access how the electrochemical exfoliation parameters such as potential applied and electrolyte concentration influence the GO obtained.
4.1.1
Influence of the potential applied
To understand how the potential applied influences the GO powder production method, the sulfuric acid concentration of the dielectric solution was kept constant at 0.2 molar and the potential was applied for 10 minutes. The process was then carried out has described before until GO powder was obtained. Three different potentials were tested: 5V, 10V and 13V. After properly dried, each powder was weighted and analyzed with Raman spectroscopy and XRD. Table 4.1 and Figure 4.1 shows the amount of pow-der obtained for each potential tested, where it is possible to observe a yield gain with increasing potential. Since the distance
be-tween the electrodes was kept at (2 cm), the electric field varied according to the applied potential.
Table 4.1 - GO powder obtained mass for the different potentials tested. Potential applied (V) 5 10 13 Obtained mass (g) 0.010 0.13 0.16
Figure 4.1 - GO powder obtained mass versus electrical potentials applied.
O bt ai ne d m as s (g )
22
However, we observe a high gain when potential changes from 5V to 10V but in-creasing voltage above 10V does not correspond to a further significant increase in mass of GO. In this range of values, a logarithmic growth seems the empirical best match of the results. Looking at the powder obtained at this electric field, the one produced by applying 13 V, bigger agglomerates than the ones produced using lower potentials can be seen. Meaning that the electric field is enough to detach small particles of the graphite rod which is most desirable to have good quality GO with few or single foils.
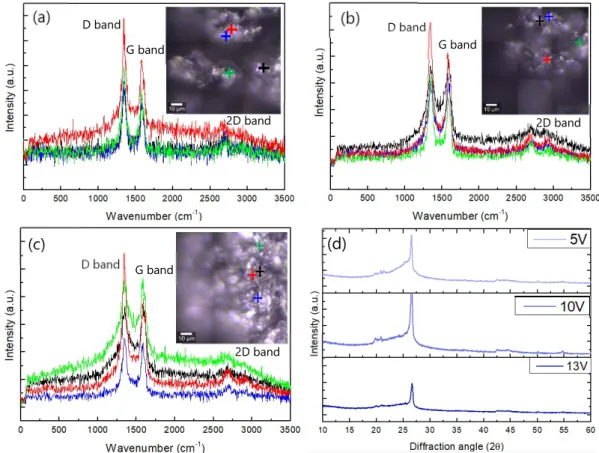
To better understand how this parameter affects the powder quality and to guar-anty GO powder is being produced, Raman and XRD analysis data were performed. The obtained data is plotted in Figure 4.2 and results compared to literature [38].
The Raman spectra of all three powders shows a D band (~1350 cm−1), G band (~1580 cm−1) and 2D band (~2690 cm−1) consistency with what is found in the literature [38]. The ratio between the bands intensity however varies, implying the presence of GO with different degrees of oxidation and purity.
(a) (b)
(c)
Figure 4.2 - Raman spectra of powder produced by applying (a) 5V, (b) 10V, (c) 13V and (d) the respective XRD pattern. (d) D band D band D band G band G band G band 2D band 2D band 2D band
23
The XRD patterns of the different samples show a clear peak at 2θ = 26°, coherent with XRD patterns of graphite found in literature. The peak appears to get wider with decrease of the potential applied entailing an increase in the oxidation degree of the GO obtained [38].
Therefore, this study allowed to determine the best voltage, 10V, to proceed with the production of GO by this method, since the powder produced showed the second-best yielding, no big agglomerates of powder and more homogeneous Raman spectra ob-tained along the sample. The difference in the powder size can be observed in Figure A1 to Figure A4 in annex A.
4.1.2
Influence of the sulfuric acid concentration
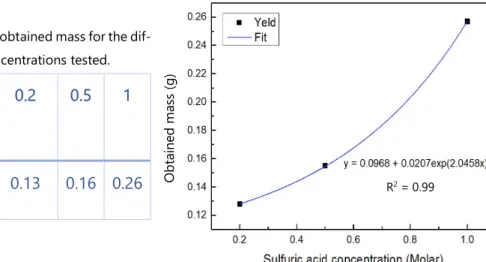
The sulfuric acid solution concentration was also tested to determine how it influ-ences the quality of the GO powder produced. To this study the potential applied was kept constant at 10V for 10 minutes. The process was then carried out as described be-fore until GO powder was obtained. Three different concentrations were tested: 0.2M, 0.5M and 1M. After properly dried, each sample was weighted and analyzed with Raman spectroscopy and XRD. Table 4.2 and Figure 4.3 shows the amount of powder obtained for each concentration tested, where it is possible to observe a yield gain with increasing concentration. The increase in concentration also produced bigger powder agglomer-ates, which is not ideal for ink manufacturing and therefore should also be considered. Although an exponential increase is fitted to the experimental points in this range of concentration, excessive increase in concentration leads to enhancement of big particles in the exfoliated GO powder, again not desired for the constitution of a good ink.
Table 4.2 - GO powder obtained mass for the dif-ferent sulfuric acid concentrations tested.
H2SO4 concentration (M) 0.2 0.5 1 Obtained mass (g) 0.13 0.16 0.26
Figure 4.3 - GO powder obtained mass versus sulfuric acid concentrations tested. R2 = 0.99 O bt ai ne d m as s (g )
24
The Raman spectra and XRD data were plotted in Figure 4.4 to study how the elec-trolyte solution concentration impacts the powder quality and assure GO powder is In fact being produced. These results were compared to results found in literature. [38]
It is possible to observe a D band (~1350 cm−1), G band (~1580 cm−1) and 2D band (~2690 cm−1) in all three samples. The bands intensity ratio suffers a variation, which implies the presence of GO with different degrees of oxidation [38]. The peak intensities decrease as concentration increases, implying formation of less crystalline compounds.
A peak located at 2θ = 26° can be observed in all the samples XRD patterns, which is coherent with XRD patterns of graphite found in literature. The patterns show little to no difference as studied concentration increases meaning this parameter has a small in-fluence in the oxidation degree of the GO produced.
Overall, it was possible to determine that the best concentration of sulfuric acid for this process is 0.2M since it showed little difference in yielding when compared to bigger concentrations, produced thinner powder and had a more defined 2D band in the
(a) (b)
(c) (d)
Figure 4.4 - Raman spectra of powder produced with sulfuric acid concentration of (a) 0.2M, (b) 0.5M, (c) 1MV and (d) the respective XRD pattern.
D band D band D band G band G band G band 2D band 2D band 2D band
25
Raman spectra along the samples. The characterized samples were composed by the full powder left in the solution, the use of only the supernatant powder can prove beneficial for the GO produced since it will be constituted of less dense particles meaning fewer layered GO. The difference in the powder size can be observed in Figure A1 to Figure A4 in annex A.
4.1.3
SEM analysis
The Figure 4.5 presents the SEM images of GO powder obtained using the best parameters values determined before, with four magnifications. The surface morphology shows formation of flack like structures (Figure 4.5 a) commonly found in exfoliated gra-phene like compounds. At higher magnifications it is possible to observe the bigger grains are formed by flakes (Figure 4.5 b) but further enlargement of the image reveals also few nanometer foils close to the graphite like sheets. Thus, graphene sheets are formed even though they are crumpled and forming micro-blocks of graphite. Indeed, this comes in agreement with the results obtained from Raman and XRD. From XRD only the graphite like flakes are detected while Raman also detects graphene oxide sheets.
Figure 4.5 - SEM images of GO powder obtained with magnifications of (a) 4200×, (b) 4400×, (c) 7300× and (d) 13500×.
(a) (b)
26
These were the expected results, since GO single foils are extremely difficult to obtain by electrochemical exfoliation.
This process proved to produce few layered graphene oxide sheets contained in the large flakes that would have high surface area and should be adequate for supercapaci-tors applications.
4.2 Ink production
After definition of the best electrochemical exfoliation parameters for obtaining GO sheets, the powder produced this way was used as an active ingredient in a 3D print-able ink: The ink was initially composed of GO powder and a PVDF|DMF solution. To understand the impact of the GO concentration in the ink’s conductivity, inks with differ-ent powder concdiffer-entration were produced, heat treated, and the conductivity measured. The concentrations tested were: 73% GO, 75%GO, and 80%GO.
The heat treatment temperature and atmosphere have an influence on the ink’s conductivity therefore, various heat-treating temperatures were tested on the ink with containing 73% of GO concentration under a nitrogen atmosphere.
Three different atmospheres were tested by heat treating the same ink at a tem-perature of 320°C in order to understand the impact this parameter has on the powder produced this way. Oxygen, vacuum and nitrogen were the different atmospheres stud-ied.
Through the experimental work, the pieces printed with the GO powder and PVDF|DMF solution showed severe cracks as the DMF evaporated, and so there was a need to add a surfactant agent. This enable to solve the problem and further Inks were produced with a few μL of surfactant.
4.2.1
GO concentration influence
Finding the best concentration of GO in the ink fabricated is finding a balance be-tween the best electrical conductivity and the rheological properties that make the ink printable. For this the rheological characterization was not possible due to system maintenance, but inks with different concentrations were extruded through a 1mL sy-ringe to make small cylinder pieces, as shown in Figure 4.6, with a constant diameter which were left drying for a day. The extrusion with the syringe enables to conclude about
27 the possibility of printing the ink. These pieces were heat treated using a heating ramp of 5°C/min until it reached 320°C, staying for 1 hour at that temperature. The samples were then left cooling inside the oven until room temperature. The cylin-ders electrical resistance was measured from end to end and the electrical resistivity was calculated. The resistivity values for the samples produced with GO concentrations of 73%, 75% and 80% are shown in Table 4.3 and Figure 4.7. The ink's
resis-tivity was calculated using the Ideal approximation for a conductive material found in literature [39].
There is a clear relation between the GO concentration and the ink's resistivity. As concentration increases, there is a decrease in the samples resistivity. The problem here is, as the load increases in the PVDF|DMF solution, it leads to high viscosity properties and the ink be hardly extruded through the tip 3D printing. And so, an ink produced with 80% concentration of GO provides the lowest resistivity but it is also the ink most dificult to print.
With all this in consideration, the parameter that had finds a compromise between conductivity and rheological proprieties is the 73% of GO concentration. Although it shows the biggest resistance, which is not good for supercapacitors electrodes, it also provides less granulated ink making it more ideal for 3D printing. According to the fitting of experimental results a minimum in resistivity seems to be found at around 78%, and in further studies this should be considered.
Table 4.3 - Mean resistivity of the inks produced with different GO concentration. Mean resistance calculated using values in table B1 in annex B.
GO concentration (%) Mean resistivity (Ω.cm) Standard deviation (Ω.cm) 73 7.6 1.3 75 4.9 1.6 80 3.4 0.20
Figure 4.7 - Mean resistivity versus different GO concentration of ink.
y = 0.152x2 − 23.927x + 942.207
R2=1
Figure 4.6 - Samples produced by extruding ink through a 1mL syringe.
M ea n re si st iv ity (Ω *c m )
28
4.2.2
Heat treatment temperature and atmosphere Influence
The heat treatment is a crucial part for printing graphene electrodes for superca-pacitors since it is responsible for the GO reduction, making the ink more conductive. To study how the atmosphere of the heat treatment affects the conductivity of the samples obtained, inks produced with 73% of GO and 27% PVDF were heat treated at 320°C with three different atmospheres: oxygen, nitrogen and vacuum. The heating ramp used was 5°C/min until it reached 320°C, where it stayed for 1 hour. The samples were then left cooling inside the hoven until room temperature. The samples produced had the same geometry as the samples produced for the previous study. The resistivity of the cylinders was measured and displayed in the Table 4.4 where it is possible to observe the resistivity of the different samples analyzed.
The results obtained by the different atmospheres tested show that, heat treating with a nitrogen atmosphere produces samples with the least resistivity. It was already expected that an oxygen atmosphere would not be adequate for a thermal annealing since at high temperatures the oxygenation of the powders will increase drastically [22]. Therefore, we conclude that a reduction atmosphere Is the most proficient in reducing GO to obtain rGO.
On the other hand, there was the need to understand what the temperatures impact is and see if it would be possible to obtain similar results but at lower tempera-tures. Thus, temperatures of 100°C, 150°C, 200°C, 270°C and 320°C were studied using a nitrogen atmosphere and processing as before. Table 4.5 and Figure 4.8 show variation on the resistivity values obtained for the different temperatures studied.
Table 4.4 - Mean resistivity of the inks heat treated with different atmos-pheres. Mean resistivity calculated using values in table B2 in annex B.
Atmosphere Mean resistivity (Ω.cm) Standard deviation (Ω.cm) Oxygen 55.6 4.5 Nitrogen 5.0 1.2 Vacuum 26.3 2.2
29
The results show that the resistivity obtained follows an exponential decay in re-spect to the annealing temperature increase, therefore heat treating at temperatures around 320°C proves to be the best annealing temperature. There was no interest in studying temperatures above 400°C since PVDF starts deteriorating, making the physical properties of the obtained samples not suited for these kind of applications.[40]
4.2.3
Surfactant concentration influence
As mentioned before, when the best parameters for the inks production were set and electrodes started to be printed, the pieces presented several cracks before the heat treatment. This meant that as the DMF evaporated from the samples, it left empty spaces leading to severe cracks such as the ones shown in Figure 4.9, due to non-coalescence of the GO particles.
Table 4.5 - Mean resistivity of the inks heat treated at different temperatures with a nitrogen atmos-phere. Mean resistivity calculated using values in ta-ble B3 in annex B. Temperature (°C) Mean resistivity (Ω.cm) Standard deviation (Ω.cm) 100 353.8 2.3 150 182.1 2.4 200 54.30 1.6 270 32.50 1.9 320 5.0 1.2
Figure 4.8 - Mean resistivity versus temperature treatment of inks in nitrogen atmosphere.
Figure 4.9 - Difference between the samples produced using ink (a) with-out and (b) with Surfactant.
(a) (b) M ea n re sis tiv ity (Ω *c m )
30
Thus, there is a need for a surfactant in the ink to allow GO particles to be bonded and form a uniform ink without particles agglomeration. A surfactant agent helps be-cause It has a long molecule that contributes to maintain GO particles separated. The surfactant chosen for this study was polysorbate.
In addition, the surfactant allows to increase the load of GO in the ink to 80% with-out compromising its rheological proprieties making it printable and led to the fabrica-tion of electrodes with higher definifabrica-tion. Table 4.6 provides informafabrica-tion about the impact of the concentration of surfactant in the ink’s resistance. The inks produced had 80% of GO and 20% of PVDF, and the surfactant was added relative to the volume of PVDF|DMF solution used. The procedure for this study was the same used in previous ones, whereas here the temperature used for the thermal annealing was 340°C due to hoven overshoot-ing.
The addition of just 2μL of surfactant per millimeter of PVDF|DMF is enough to increase significantly the ink's resistivity by a factor of 33. To guarantee the best perfor-mance of the electrodes it is imperative they possess the lower resistivity possible, but the presence of cracks can also be a factor that can lead to a bad operation, and so it is important to find a compromise between these two factors.
The results obtained show no significant differences between adding 2μL/mL or 5 μL/mL in terms the ink's resistivity, however using 5 μL/mL resulted in samples with less
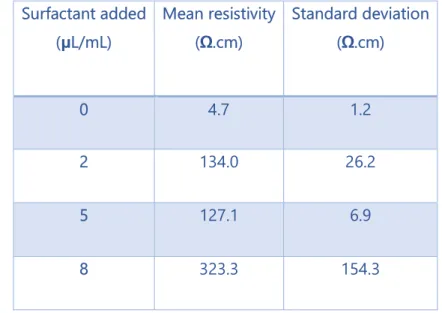
Table 4.6 - Surfactant influence on the ink’s resistivity. Mean resistivity calculated using values in table B4 in annex B. Surfactant added (μL/mL) Mean resistivity (Ω.cm) Standard deviation (Ω.cm) 0 4.7 1.2 2 134.0 26.2 5 127.1 6.9 8 323.3 154.3
31
cracks. Therefore, in the capacitor devices 5 μL/mL of surfactant was used in the ink for printing the electrodes.
4.3 Printing the electrodes
Defined the best composition for the ink it was introduced in a 1mL syringe with a 0.9mm diameter needle and loaded on the 3D potter printer. The printing parameters were set by trial and error attempts until it was possible to print the desired geometries. All the values used for printing were the ones set by simplify 3D software as default for PLA filament, except the ones displayed in in table B5 in annex B
With these parameters it was possible to print both the geometries intended to be studied in this thesis. During the trial and error attempts the parameter that seemed to have a bigger influence in the printing quality were the extrusion multiplier and the de-fault printing speed, since the first controls how much ink is extruded during the time of printing and the second controls the printers arm speed.
4.3.1
SEM/EDS characterization
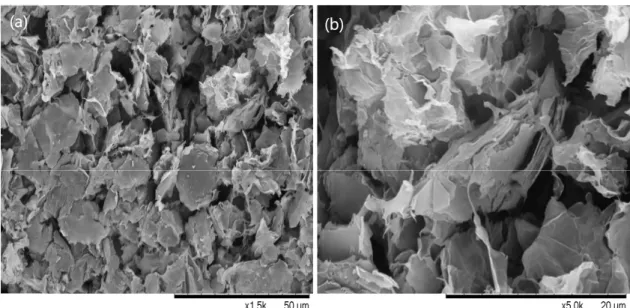
The Figure 4.10 shows SEM images from the printed electrode's surface with two dif-ferent magnifications. The surface seems to be composed of oriented sheet like struc-tures, just as expected from a 3D printing extrusion method.[33] Furthermore, it is pos-sible to observe micro grains formed by foils with empty spaces between them, meaning the structures present in the GO powder produced were conserved after heat treatment.
Figure 4.10 -SEM analysis of the printed electrodes surface with different magnifications (a) ×1500 and (b) ×5000.
32
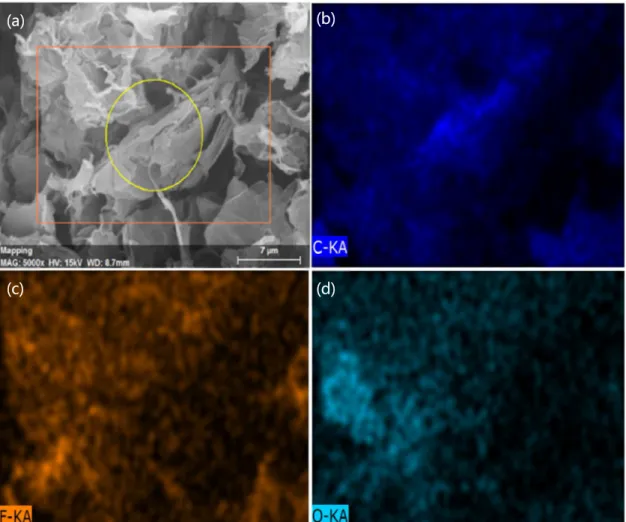
With this SEM analysis is also possible to observe small filaments that connect the micro grains, being possibly the PVDF working as a binding agent for the GO powder. To better understand the composition of the observed structures, EDS quantification and mapping was carried out and the results can be observed in Table 4.7 and Figure 4.11.
The samples show high percentage of C and O, since GO is mainly composed by these two ele-ments. The presence of fluorine is explained by the PVDF used as a binding agent, and it proves PVDF did not evaporate during the thermal treatment. The only element which presence cannot be explained is silicon, since it is not an element present in any of the compounds used for the fabrication of these electrodes. Its low percentage may indicate it as a contamination from other samples analyzed at the same time.
Table 4.7 - EDS quantification of the ele-ments presents in the electrode's surface.
Element Wt% Atm% Carbon 68.41 76.40 Oxygen 15.36 12.88 Fluorine 12.97 9.16 Silicon 3.27 1.65 Total 100
33
The mapping images suggest the carbon is the main constituent of the micro grains and the oxygen is filling the empty spaces around them. Fluorine appears to be spread along the grain's surface and in the spaces between them, meaning it is working as a binding agent which is what was intended for it to do.
4.4 Capacitors
With the best ink and printing parameters determined, electrodes with interdigital and planar geometries were printed and characterized. images of the electrodes printed can be seen in Figure 4.12. These geometries were chosen as a first approach to validate the 3D printing process for supercapacitor fabrication. Besides that, two different dielec-trics were used for this study to understand its influence on the device’s performance.
Figure 4.11 - EDS characterization of the electrode's surface in the (a) targeted area containing (b) carbon, (c) fluorine and (d) oxygen elements.
(a) (b)
34 For these studies 2 planar supercapacitors and 8 interdigital were fabricated and tested to verify the reproducibility of the process. All the samples printed can be seen in Figure A5 to Figure A7 in an-nex A.
As the resistivity of rGO electrodes is high, there is a need to add contacts made of a more con-ductive material, to better collect the charges stored. For this purpose, carbon and silver inks were tested as possible contacts.
4.4.1
Contacts influence.
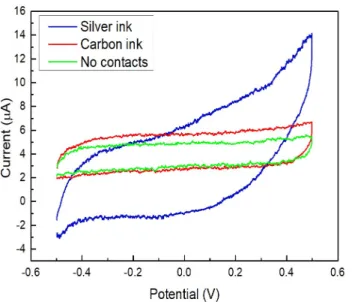
To test how different contacts affect the devices preformance, the same device was tested without contacts, with carbon contacts and with silver contacts using a sweat simulated substance as the dielectric. 5 cycles of cyclic voltometries were performed to each contact tested, with a potential range between −0.5V and 0.5V, a scan rate of 60mV/s, Figure 4.13 shows the 5th cycle for each case. The spectific capacity of the device was determined for each contact, using Gamry Echem Analyst software, and the results are displayed in Table 4.8. This study was performed on the supercapacitors with an interdigital geometry.
The results of this tests show a boost in the current when silver contacts are used for all 4 samples tested, however the metallic contact also increased the devices resistence as evidenced by the voltommetry slope. This resistance gain is probably caused by the contact interface with the GO electrode, since the carbon ink showed no slope difference when compared to the device with no contacts. Surely the increase in the corrent collection is due to lower resisntance of the silver ink so the electrical contact is better, but probably it penetrates in depth of rGO electrode reducing the interaction of the electrolyte with it so, interfaces resistance is enhanced. Due to increase of current, the capacitance is higher when compared to carbon ink or without contact, as show in Table 4.8.
Figure 4.12 - Example of the electrode’s geometries studied in this thesis. (a) pla-nar and (b) Interdigital geometries.
35
Considering the contact worked better with this device was the silver one largely enhancing the devices capacitance when compared to the carbon ink.
4.4.2
Electrolyte influence
The electrolyte is an important component for the supercapacitors performance since it controls the charge accumulation due to interaction with the electrodes interface. That is reflected in the intensity of the electric field generate with consequent impact on the device’s capacitance. Two electrolytes were tested PVA/H2SO4 and sodium chloride solution. The supercapacitors fabricated with these electrolytes were each submitted to 5 cycles of cyclic voltometries with a potential range between −0.5V and 0.5V, a scan rate of 60mV/s, and the 5th cycle of each device tested was ploted in Figure 4.14. The spectific capacity of the devices was determined using Gamry Echem Analyst software, and the results are displayed in Table 4.9. This study was only performed on the supercapacitors with an interdigital geometry.
Considering the same area of capacitor and the quantity of electrolyte added be-tween electrodes, the cyclic voltammetry shape for the PVA/H2SO4 shows a higher cur-rent and more defined rectangular shape.
Figure 4.13 - Cyclic voltometries performed for different contacts in sample 1i with a simulated sweat substance as electrolyte.
Table 4.8 - Specific capacity of sample 1i us-ing a simulated sweat substance as electro-lyte with the different contacts.
Contact type Specific capacity (μF/cm2)
No contact 120.5 Carbon ink 188.1 Silver ink 458.5
36
The calculated device's specific capacitance value is an order of magnitude higher when using the PVA/H2SO4 as an electrolyte. This can be explained by the presence of a higher number of ionic molecules attracting more electrons to the surface area of the electrodes, thus higher number of charges are stored.
Electrochemical impedance spectroscopy was carried out for both electrolytes using an interdigital geometry to access the electrolyte's conductivity and the results can be observed in Figure 4.15. The conductivity
var-iation with frequency from all the samples can be found in Figure C1 to Figure C2 in annex C. The sweat simulated substance displays lower conductivity values when compared to the PVA/H2SO4 electrolyte, however this dif-ference gets smaller as frequency increases. Both electrolytes display conductivities be-tween 10-7 S/cm and 10-3 S/cm for high fre-quencies, which is within the desirable values for electrolyte conductivity [41].
Table 4.9 - Specific capacity of sample 1i with different electrolytes.
Electrolyte Specific capacity (μF/cm2)
Sodium
chloride 458.5 PVA | H2SO4 1759.6
Figure 4.14 - Cyclic voltometries performed for the dif-ferent electrolytes studied in samples 1i.
Figure 4.15 - Electrical conductivity variation with frequency for sample 6i.
37 The liquid electrolyte proved to be harder to de-posit than the solid one, due to the electrode’s hydro-phobicity, creating a droplet of the liquid on top of the electrodes, as shown in Figure 4.16, which would eventually pop draining all the dielectric already de-posited. This behavior also made it complicated to ensure to fully cover the electrodes surface with the dielectric. With all this in mind, using the solid dielec-tric provided the best results for the fabrication of a functional supercapacitor. By being solid it also stays
in the device without a need of enclosure, whereas the liquid one evaporates with time, making the device less durable.
4.4.3
Geometry Influence
The supercapacitors geometry is a factor with a huge impact on the device's capac-itance, since active area for charges storage should be optimized against the total area of the electrodes. The two geometries tested were printed, and the cyclic voltammetry curves were plotted, as showed in Figure 4.17. The CV curves from all the samples pro-duced can be found in figure C3 to Figure C11 in annex C.
Comparing the plotted values of both geometries, it is possible to see that the planar geometry reaches current levels a lot higher than the interdigital one. Indeed, although the quantity of material used to print the electrodes is similar the active area between the electrodes is bigger in the planar geometry, 1cm2 for the planar geometry and 0.26cm2 for the interdigital.
Figure 4.17 - Cyclic voltammetry curves of the two geometries tested (a) interdigital (sample 1i) and (b) planar (sample 1p).
(a) (b)
Figure 4.16 - Hydrophobicity shown by the printed electrodes.
38
Both devices display a stable behavior with a very symmetric rectangular-like shape, even at high scan rates, demonstrating an excellent capacitive behavior and rate perfor-mance. No redox peaks existed in the CV curves, indicating that the electrodes offer an excellent electrochemical stability.
At lower scan rates, the ions in the dielectric have enough time do diffuse into the graphene layers resulting in a higher specific capacitance. Figure 4.18 shows that as scan rate increases, the charge and discharge process is too quick to allow full ion diffusion, meaning less surface of the electrode is used re-sulting in a lower specific capacitance.
4.4.4
Electrochemical impedance spectroscopy
Electrochemical impendence spectroscopy is an important characterization for su-percapacitors since it allows to understand how the different components of the device affect its performance. A model describing the circuit equivalent of an EDLC was found in the literature and it was used for this analysis, such model is displayed in Figure 4.19. [42].
Figure 4.20 shows the plotted values for the EIS characterization preformed on the supercapacitors with different geometries for frequencies between 10-2Hz and 10-6Hz. The capacitance seems to decrease proportionally with the frequency stabilizing as it reaches the lower frequencies which is an expected behavior for a supercapacitor.
Figure 4.19 - Equivalent circuit modeling of the interfacial processes at the double layer and considering bulk processes. Adapted from [42].
Figure 4.18 - Test results of the specific capacitance for the geometries tested at different scan rates
39
The model used for the fitting on this test also seems to be the adequate one, since it has a goodness of fit in the magnitude of 10-6, suggesting the devices fabricated exhibit an electrical double layer storage mechanism. The values of the parameters calculated by the model are displayed in Table B6 and Table B7 in annex B.
4.4.5
Charge/discharge cycle stability
Devices such as supercapacitors must be able to keep a stable behavior throughout its use, meaning the device's capacitance needs to keep the properties after a consider-able number of cycles. The already tested supercapacitors were submitted to 1000 cyclic voltammetry cycles followed by1000 more of chronoamperometry to understand how it behaved. The CV was done in a potential range between −0.5V and 0.5V with a scan rate of 100mV/s, and the cycles 1, 100, 500 and 1000 were plotted in Figure 4.22 and show that the symmetric rectangular-like shape was kept constant over the cycles.
Figure 4.20 - (a) Bode and (b) Nyquist plots for the Interdigital geometry (sample 1i) and (c) Bode and (d) Nyquist plot for the planar geometry (sample 1p) using the fitting model found in literature [42].
(a) (b)
40
This means the device's capacitance had no big variations, however this type of characterization is not very precise to study the capacitance variation and so the 1000 chronoamperometry cycles were performed on the same devices. Figure 4.22 shows the variation of the capacitance along the charge and discharge cycles, the current and po-tential variations through time for cycles 800, 801 and 802 are displayed in Figure 4.21.
The capacitance of the planar geometry seems to gradually drop until it reaches 200 cycles, and so it starts to stabilize at values between 2.5mF and 3mF. Furthermore, the current values for each cycle vary between −100μA and 100μA, and the potential has a variation expected from a supercapacitor, adopting a triangular shape.
The capacitance obtained for the interdigital geometry shows a higher deviation between cycles values, however the values constantly drop until it reaches 200 cycles, and it starts to stabilize 0.3mF and 0.6mF. Between cycles 250 and 750 some cycles ap-pear to produce significantly higher capacitance values than what is expected, and the reason for that is unknown but it may be related to the electrolyte exposure to the at-mosphere resulting in unforeseen reactions. The current and potential variations through time show a curve close to a triangular shape, confirming the formation of an efficient electrical double layer and a good charge propagation across the two electrodes.
(b) (a)
Figure 4.21 - Current and potential variations through charge and discharge cycles 800, 801 and 802 for the (a) planar (sample 1p) and (b) interdigital geometry (sample 8i).
41
Overall, it is safe to say the devices fabricated behave like a supercapacitor and are stable even after more than 1000 cycles. The planar geometry had a more stable behavior and produced higher current and capacitance values. The Interdigital geometry should be further studied with a better encapsulation for better understanding of its behavior.
4.4.6
Device's time stability
Due to expected stability from the devices, they were kept in storage in room air conditions and re-measured after 1 month and 2 months, and results are displayed in Figure 4.23. The device used for this study had an interdigital geometry.
After 1 week of the device's production, the CV curve shows an oxidation peak and no apparent reduction peak, implying a none reversible redox reaction occurred (Figure 4.23 a). After 1 month however, the oxidation peak disappeared, and the voltammetry
(a) (b)
(d) (c)
Figure 4.22 - 1000 cycles of cyclic voltammetry performed on (a) planar (sample 1p) and (b) Interdigital geometries (sample 8i), and 1000 charge/discharge cycles performed on the same (c) planar and (d) Interdigital geometries devices.
42
geometry acquired a more defined rectangular-like shape with higher current values and maintaining this behavior after 2 months.
The device's specific capacity progression follows an asymptotic exponential growth with almost a 70% capacitance increase after 2 months of its fabrication.
This improvement maybe related to the electrolyte high viscosity that, has time passes after its deposition, gradually migrates more deeply into the electrode’s pores making more contact with the surface increasing the active storage area.
.
Figure 4.23 - Behavior progression of the supercapacitors produced for 2 months. (a) CV curve and (b) capacitance's progression.
(a) (b)
43
5. Conclusion and future
The objectives of the thesis were successfully achieved. GO powder was produced by electrochemical exfoliation with properties that allow its use in inks for 3D printing. The two parameters studied show no need of fine tuning and represent inconsequential changes between the samples, displaying little discrepancies in the Raman spectra. How-ever, the process can still be explored to obtain higher quality graphene sheets in the powder. One of the process steps that can be improved is the powder washing, during which the powder that stayed on top and in the bottom of the flask was kept. This powder separation can be explained by different densities of the micro grains in the powder. By only removing the powder from the top, we are ensuring the micro grains are composed by smaller stacks of graphene sheets, and therefore, possess a higher quality. The impact of this change in the process should be further studied and a design of experiment could be conducted to analyze the interdependence of the parameters.
It was also possible to manufacture 3D printable inks using the GO powder by mix-ing it with a bindmix-ing agent. The choice of other bindmix-ing agents may enable enchantmix-ing electrical conductivity, and therefore there could be other options that would yield better physical properties electrodes. Although the printed electrodes had acceptable conduc-tive properties, the physical properties lacked elasticity leading the pieces to crack with-out a solid substrate, like glass. Different binding agents must be tested to optimize the ink's mechanical and electrical properties and print electrodes that do not require a solid substrate. Binding agents such as Hydroxy propyl methyl cellulose (HPMC) [43] and Car-boxymethyl cellulose (CMC) [44] have proven to be a good alternative for extrusion based 3D printing inks, granting good mechanical properties to the pieces printed
From the two dielectrics analyzed, the solid one composed of PVA and diluted sul-furic acid showed to greatly increase the device's capacitance and to improve its electrical behavior, generating constant rectangular-like CV curves. This substance also proved to improve the device's behavior as it dried, which is a desired property. The sweat similar substance proved to be ineffective to fully cover the electrodes surface, making the
44
effective area used for charges storage smaller affecting drastically the device's specific capacitance.
Both device's geometries studied display conclusive results in its capacitance and durability. The planar geometry showed the lowest specific capacitance of the two and uses a lot more material, however it revealed to be as durable and stable as the interdig-ital geometry. For additional studies, testing a stacking approach using printed elec-trodes intercalated with the dielectric material could prove to be beneficial for the de-vice's specific capacitance.
The capacitance values of the devices fabricated are comparable to supercapacitors technology at the same development stage, as seen in table B8 in annex B, meaning this low-cost process can still be improved for higher capacitance values.
The initial objectives of this work were accomplished. The devices were fabricated using a printable ink with GO powder, through an addictive manufacturing technique creating an all-solid-state supercapacitor with plenty of room to be optimized with a specific capacity of ~2mF/cm2, stable for more than one month when stored at atmos-pheric conditions, with a decay capacitance less than 60% over more than 2000cycles.
45
6. Bibliography
[1] A. González, E. Goikolea, J. A. Barrena, and R. Mysyk, “Review on supercapacitors: Technologies and materials,” Renewable and Sustainable Energy Reviews. 2016.
[2] Y. Huang, J. Liang, and Y. Chen, “An overview of the applications of graphene-based materials in supercapacitors,” Small, vol. 8, no. 12, pp. 1805–1834, 2012.
[3] M. Vangari, T. Pryor, and L. Jiang, “Supercapacitors: Review of Materials and Fabrication Methods,” J. Energy Eng., 2012.
[4] I. Childres, L. Jauregui, W. Park, H. Cao, and Y. Chen, “Raman Spectroscopy of Graphene and Related Materials,” New Dev. Phot. Mater. Res., 2013.
[5] M. J. Allen, V. C. Tung, and R. B. Kaner, “Honeycomb carbon: A review of graphene,” Chem. Rev., 2010.
[6] Y.-H. Lin, C.-Y. Yang, S.-F. Lin, and G.-R. Lin, “Triturating versatile carbon materials as saturable absorptive nano powders for ultrafast pulsating of erbium-doped fiber lasers,” Opt. Mater. Express, 2015.
[7] R. S. Shishir and D. K. Ferry, “Intrinsic mobility in graphene,” J. Phys. Condens. Matter, 2009.
[8] Y. Zhu et al., “Graphene and graphene oxide: Synthesis, properties, and applications,” Adv. Mater., 2010.
[9] F. Yavari and N. Koratkar, “Graphene-based chemical sensors,” Journal of Physical Chemistry Letters. 2012.
[10] J. Zhu, D. Yang, Z. Yin, Q. Yan, and H. Zhang, “Graphene and graphene-based materials for energy storage applications,” Small. 2014.
[11] Q. Zhou, X. Ye, Z. Wan, and C. Jia, “A three-dimensional flexible supercapacitor with enhanced performance based on lightweight, conductive graphene-cotton fabric electrode,” J. Power Sources, 2015.
[12] R. Muñoz and C. Gómez-Aleixandre, “Review of CVD synthesis of graphene,” Chem. Vap. Depos., vol. 19, no. 10–12, pp. 297–322, 2013.
[13] K. S. Novoselov et al., “Electric field in atomically thin carbon films,” Science (80-. )., 2004. [14] S. Gilje, S. Han, M. Wang, K. L. Wang, and R. B. Kaner, “A chemical route to graphene for
device applications,” Nano Lett., 2007.
[15] B. C. Brodie, “the atomic weight of graphite,” Phil. Trans. R. Soc. Lond., 1859.
[16] C. Hontoria-Lucas, A. J. López-Peinado, J. de D. López-González, M. L. Rojas-Cervantes, and R. M. Martín-Aranda, “Study of oxygen-containing groups in a series of graphite oxides: Physical and chemical characterization,” Carbon N. Y., 1995.
[17] W. S. Hummers and R. E. Offeman, “Preparation of Graphitic Oxide,” J. Am. Chem. Soc., 1958.
[18] D. A. Dikin et al., “Preparation and characterization of graphene oxide paper,” Nature, 2007.