366
ABSTRACT
Introduction: The increase, or maintenance, of lean body mass and muscle strength are major deter-minants of functional independence in the elderly, since they are associated with bone remodeling, and therefore with a reduced risk of falls and fractures. However, the regional relationship between lean body mass/strength and bone mineral content (BMC) has not sufficient theoretical support. Objective: To analyze whether regional body composition and muscle strength are factors potentially related to BMC. Methods: Ten older men (63.3±6.4 years, 169.4±6.8 cm and 79.3±10.5 kg) underwent body composition assessments using dual energy X-ray absorptiometry (DXA) to obtain regional and whole-body lean mass and BMC measures. The subjects also underwent the one-repetition maximum (1RM) test involving flat bench press, 45º leg press, arm curl and knee extension. Regional/whole-body composition and 1RM values were correlated to BMC using Pearson’s coefficient (r). The level of significance for the correlations was p ≤0.05, the confidence interval was 95% (Z1-a/2=1.96), and the sample power was 80% (1-b). Results: The flat bench press 1RM was
related to BMC in the left (r=0.764) and right (r=0.748) arms, while the 45º leg press 1RM was associated with BMC in the left (r=0.677) and right (r=0.714) legs and trunk (r=0.810), with sample power of 77.7%, 66.8%, 12.7%, 40.4% and 97.0%, respectively. Whole-body BMC was related to abdominal skinfold (r=0.819), lean mass of left arm (r=0.834), left (r=0.845) and right (r=0.868) legs, and whole-body lean mass (r=0.787), with sample power of 98.4%, 99.6%, 99.9%, 100.0% and 90.1%, respectively. Conclusion: The results supported regional lean body mass as a parameter related to BMC, with potential similar to that consistently reported for whole-body lean mass. Results also suggested that muscle strength plays an important role in improving or maintaining regional and whole-body BMC.Level of Evidence II; Development of diagnostic criteria in consecutive patients (with ‘‘gold’’ benchmark standard applied).
Keywords: Muscle strength; Body composition; Bone density; Aged.
RESUMO
Introdução: O aumento ou a manutenção, da massa magra e da força muscular são importantes fa-tores que determinam a independência funcional em idosos, uma vez que se associam ao remodelamento ós-seo e, assim, à redução dos riscos de quedas e fraturas. Todavia, a relação regional da massa magra e da for-ça muscular com o conteúdo mineral ósseo (BMC) não apresenta suficiente apoio teórico. Objetivo: Anali-sar se a composição regional e a força muscular são fatores possivelmente relacionados à BMC. Métodos: Dez homens idosos (63,3 ± 6,4 anos; 169,4 ± 6,8 cm e 79,3 ± 10,5 kg) submeteram-se às avaliações de compo-sição por meio de absorciometria por feixe duplo de raio-X (DEXA) para obter a massa magra e BMC regionais e corporais. Os participantes também foram submetidos ao teste de uma repetição máxima (1RM) com supi-no horizontal, leg press 45°, rosca direta e extensão de joelho. Os valores de composição regional e corporal e de 1RM foram relacionados ao BMC pelo coeficiente de Pearson (r). O nível de significância para as cor-relações foi p ≤ 0,05, o intervalo de confiança foi 95% (Z1-a/2=1,96) e o poder da amostra foi 80% (1-b). Resul-tados: A 1RM no supino horizontal relacionou-se ao BMC do braço esquerdo (r = 0,764) e direito (r = 0,748), as-sim como 1RM no leg press 45º associou-se ao BMC da perna esquerda (r = 0,677), direita (r = 0,714) e do tronco (r = 0,810), com poder de amostra de 77,7%, 66,8%, 12,7%, 40,4% e 97,0%, respectivamente. O BMC corporal rela-cionou-se a prega cutânea abdominal (r = 0,819), massa magra do braço esquerdo (r = 0,834), perna esquerda (r = 0,845) e direita (r = 0,868) e massa magra corporal (r = 0,787), com poder de amostra de 98,4%, 99,6%, 99,9%, 100,0% e 90,1%, respectivamente. Conclusão: Os resultados confirmaram a massa magra regional como parâmetro relacionado ao BMC, com potencial similar ao da massa magra corporal e também sugerem que a força muscular tem papel importante no aumento ou manutenção do BMC regional e corporal. Nível de Evidência II; Desenvolvimento de critérios diagnósticos em pacientes consecutivos (com aplicação do padrão de referência).
Descritores:Força muscular; Composição corporal; Densidade óssea; Idoso.
REGIONAL BODY COMPOSITION AND MUSCLE
STRENGTH ARE RELATED TO BONE MINERAL
CONTENT IN ELDERLY
COMPOSIÇÃO CORPORAL REGIONAL E FORÇA MUSCULAR SE RELACIONAM COM O CONTEÚDO
MINERAL ÓSSEO EM IDOSOS
COMPOSICIÓN REGIONAL Y FUERZA MUSCULAR SI RELACIONAN CON ÉL CONTENIDO MINERAL
ÓSEO DE MAYORES
Leandro Oliveira Da Cruz Siqueira1,2 (Physical Education Professional) César Fernandes Machado3 (Physical Education Professional) Astor Reis Siminato2
(Physical Education Professional) Andrei Sancassani2
(Physical Education Professional) Luiz Gustavo Almeida dos Santos3 (Physical Education Professional) Larissa Aparecida Takehana Gomes3 (Physical Education Professional) Anderson Saranz Zago3 (Physical Education Professional) Dalton Muller Pessôa Filho3 (Physical Education Professional)
1. Centro Universitário UNIFAFIBE, Bebedouro, SP, Brazil.
2. Universidade Estadual Paulista “Júlio de Mesquita Filho”, Instituto de Biociências, Rio Claro, SP, Brazil. 3. Universidade Estadual Paulista “Júlio de Mesquita Filho”, Faculdade de Ciências, Bauru, SP, Brazil.
Correspondence:
Dalton Muller Pessôa Filho Universidade Estadual Paulista “Júlio de Mesquita Filho”, Department of Physical Education. Av. Eng. Luiz Edmundo Carrijo Coube, 14-01, Vargem Limpa, Bauru, SP, Brazil. 17033-360.
ORIGINAL ARTICLE
ARTIGO ORIGINAL
367
INTRODUCTION
Long duration exercises, as much as high intensity and short duration exercises have aspects and characteristics that benefit morphofunctional decline associated with aging.¹ The maintenance and improvement of the cardiovascular system, prevention of lean mass loss and improve-ment of bone health are aspects obtained through practicing physical exercises regularly, which improve quality of life.
On the other hand, physical inactivity is associated to the reduction of physical aptitude and motor autonomy, mainly among the elderly. Research points that: (i) muscular strength starts declining at 50 years old, at a 15% per decade rate, until 70 years old, declining at a 30% per decade rate, from that age on; and (ii) muscular power declines at a 1.5% per year rate from 65 to 84 years old, along with isometric force, which declines 1.5% per year,1,2 beside the reduction in muscular area up to
40% at 80 years old, when compared to maturity peak, at 20 years old, mainly by loss of 39% of type II fibers.³ With aging, a reduction in bone mineral density (BMD) is observed, which, in men, begins at 50-60 years old, declining 0.3% per year, and in women, that decline floats around 1% per year, after 40 years old.4
Some exercises may revert, or retardate, bone mass loss in the el-derly, as it has been recommended to resisted exercise and running. Although, the prescription must present sufficient overload, beyond a given osteogenic threshold, by means of mechanical stress over the bones, and as such, activate tissue remodelation with consequential increase in BMD and bone mineral content (BMC).7,8 Although recent
studies demonstrating that BMD and BMC are not the only determining parameters of the bone’s capacity to support the body’s load, both are important indicatives of bone functional capacity.9 Particularly,
concer-ning resisted exercise, there is evidence of its stimulus potential over skeletal tissue remodeling among the elderly,7,10 making the effect of
mechanical tension an effective factor in the increase/upkeep of bone mass, especially in regions more susceptive to mechanical stress, such as the femoral neck.11,12 For example, elders of both genders present an
increase in regional BMC and strength, when submitted to high intensity
RESUMEN
Introducción: El aumento o mantenimiento de la masa delgada y fuerza son determinantes de independencia funcional de adultos mayores, debido a asociaciones con la modulación ósea y, de la misma forma, con la reducción de riesgos de fracturas y caídas. Sin embargo, las relaciones regionales de masa delgada y fuerza con el contenido mineral óseo (CMO) no tienen suficiente apoyo teórico. Objetivo: Analizar si la composición regional y la fuerza están potencialmente relacionadas con CMO. Métodos: Diez adultos mayores (63,3±6,4 años, 169,4±6,8cm y 79,3±10,5kg) se sometieron a las evaluaciones de composición corporal por absorciometría de doble rayos-X (DXA) que proveyó la masa delgada para y CMO regional y corporal, así como el test de repetición máxima (1RM) en supino horizontal, leg press 45º, flexión de brazo y extensión rodilla. Los valores de la composición regional, corporal y de 1RM se relaciona-ron con CMO por el coeficiente de Pearson (r). El nivel de significancia fue p≤0,05 para las correlaciones, y el índice de seguridad de 95% (Z1-α/2=1,96) y potencia de muestra de 80% (1-β) para evaluar el poder de la muestra. Resultados: El 1RM en supino horizontal se relacionó con CMO del brazo izquierdo (r=0,764) y derecho (r=0,748), así como el 1RM en leg press 45º se relacionó al CMO de la pierna izquierda (r=0,677), derecha (r=0,714), y tronco (r=0,810), con poder de muestra, respectivamente, de 77,7%, 66,8%, 12,7%, 40,4% y 97,0%. El parámetro CMO corporal se relacionó con el pliegue cutáneo abdominal (r=0,819), masa delgada del brazo izquierdo (r=0,834), pierna izquierda (r=0,845), derecha (r=0,868) y masa delgada corporal (r = 0,787), con poder de muestra, respectivamente, de 98,4%, 99,6%, 99,9%, 100,0% y 90,1%. Conclusión: Los resultados confirman haber relación entre masa delgada regional e CMO, con potencial similar a la masa delgada corporal, sugiriendo también que la fuerza muscular ejerce un papel promisor en el aumento, o manutención, del CMO regional y corporal. Nivel de Evidencia II; Desarrollo de criterios diagnósticos en pacientes consecutivos (con estándar de referencia “oro” aplicado).
Descriptores:Fuerza muscular; Composición corporal; Densidad ósea; Adulto mayor.
Article received on 07/14/2017 accepted on 04/13/2018 DOI: http://dx.doi.org/10.1590/1517-869220182405182694
training (80% 1-RM) as well as lean mass.1 In a study by Huuskonen
et al.,13 there was an observable increase of femur BMD in 3.8%, after
four months of planned resisted exercises with three weekly sessions and charge from 5 to 15-RMs, involving middle aged men (54-61 years old). Another study, with elders between the ages of 70 and 79, with different genders and ethnies, reveals that there is correlation between femur BMD and body lean mass (r=0.41), body fat mass (r=0.38), lean mass of the upper limbs (r=0.35), fat mass of upper limbs (r=0.36) and knee extensor strength (r=0.19), but only the increase in lean mass was capable of altering femur BMD between 5.7% and 5.9%.14 In a more
recent study, Matsui et al.15 demonstrate that the knee extensor strength
reduction was associated with osteopenia of the femoral neck between 763 men and 476 women, ranging from 40 to 81 years old. Collectively, these studies suggest the existence of a direct correlation between re-gional and whole-body composition and strength with BMC, although still being contradictory and demanding practical questions about the type of resisted exercise capable of gathering articular actions of which strength could express the condition of BMC among elderly people, and as such, allow the definition of strategies specific to age and gender, with the objective of reducing bone loss along with aging.4,16,17
This present study analyzes the association between BMC (whole-bo-dy and regional) and muscular strength and the general regional bo(whole-bo-dy composition among elderly men. The presumption of such association is based on the regional tendency of BMC and strength and body com-position parameters relation, which is made evident for young adults by Gimarães et al.18 These authors state that the local variables of strength,
368
METHODS
This study analyzes 10 (ten) elderly men (63.3 ± 6.4 yo.; 169.4 ± 6.8 cm tall and 79.3 ± 10.5 kg in body weight). It is sampled by type variety, including individuals according to the age criterion (>55 yo.), absence of comorbidity associated with metabolic and cardiac dis-turbances, and practicing resisted exercise regularly for at least two months. Among these, variety occur by ethnie, body fat and physical conditioning level. All the subjects signed a consent form, agreeing to participate in this study, after being briefed by the research team about procedures and risks which they might be exposed to. This research was submitted to approval by the Research Ethics Comission, under process 517/46/01/07.
Bone Density and Body Composition
The dual X-ray absortiometry (DXA, Hologic®model, QDR Discovery Wi®) method was used in order to obtain whole and regional body compo-sition. The body composition software (Hologic APEX) provides values for absolute fat mass (MG), relative fat mass (%G), lean mass (MM), bone mineral content (BMC), as well as, legs and arms mass, for both sides of the body, composing the references for regional composition of upper and lower limbs.19,20 Regional torso and head compositions were also
considered, complementing the data for whole-body composition. The equipment was tuned following factory guidelines and all procedures were operated by an experienced laboratory technician.
One Maximum RSEEtition Test (1RM)
The 1RM test was conducted during the following exercises: (a) flat brench-press, (b) 45º leg-press, (c) arm curls and (d) knee extension. All tests were conducted after a 15 minutes non-specific warmup (static stretches, cycling or low intensity running). The 1RM test protocol follows guidelines by Baechle and Earle:21 (1) a specific warmup was
conduc-ted with low charges and as to not stimulate concentric failure, (2) the initial test charge was determined according to maximum strength mean values for age, gender and weight, (3) the participants executed, at least, three series of attempts, with 3 min for resting between them, raising or lowering the initial 1.1 – 4.5 kg , according to the difficulty with which the first attempt was executed. The charge that could not be suspended twice represents the maximum weight and is considered reference to maximum strength in 1RM (kg). The 1RM value was confirmed twice, during different attempts separated by 24 hours, with random executions at 95, 100 and 105% 1RM, adopting the mean value of the maximum execution charges completed in the last three tests. Before the test, arterial pressure was verified and only subjects that presented pressure below or equal to 140 mmHg for systolic pressure and 90 mmHg for diastolic pressure were considered able to be evaluated, following Brazilian Hypertension Guidelines.
Statistical Analysis
The strength values (1RM), body composition (whole and regional) and skinfold were analyzed as to normality by Shapiro-Wilk and presented as mean±standard deviation, variance by standard error of estimate (SEE) and minimums and maximums. Agreements level between 1RM tests was verified by inter-class correlation coefficient (ICC). After not rejecting normality, the associations between BMC (regional and body) and body composition (whole and regional), strength (1RM) and skinfolds were analyzed by the Pearson coefficient (r), with respective index of agree-ment of 95% (IC). Multiple linear regressions provided the association model between regional and whole-body BMC (dSEEndent variables) and regional and whole-body composition, strength (1RM) and skinfolds (indSEEndent variables). As for dispersion analysis, it was employed the determination coefficient (R²), SEE and 95%IC. The minimum squares
approach was utilized as criterion for adjusting the data at regression analysis. Significance level in all analysis was P≤0,05. The sample statis-tical power, as by normal distribution Z1-β, for the comparison between correlated means was determined by Equation 1, following guidelines by Díaz and Fernandéz22 and considering an “n” of 10 participants. The
inserted parameters were as follows: (a) Pearson’s “r”, (b) Z1-α/2=1.96 for a safety index of 95%, in a bilateral distribution; and (c) the Z1-β value related to normal distribution for sample power determination table(1-β). The statistics package SPSS 18 was used for data treatment.
Equation 1:
RESULTS
Maximum strength mean values in 1RM tests were 51.6±15.5 kg (SEE: 4.83 kg; variation: 27.8-67.2 kg) in flat bench-press, 255.6±50.7 kg (SEE: 4.83 kg; variation: 166.7-333.3 kg) in 45º leg-press, 30.6±5.2 kg (SEE: 1.72 kg; variation: 21.4-36.1 kg) in arm curls and 89.0±22.0 kg (SEE: 7.32 kg; variation: 60-140 kg) in the extensor chair. Level of agree-ment between these 1RM tests (ICC) was 0.998 (bench-press), 0.986 (leg-press), 0.885 (arm curl) and 0.989 (extensor chair), with significance index at P<0.01 for all of them.
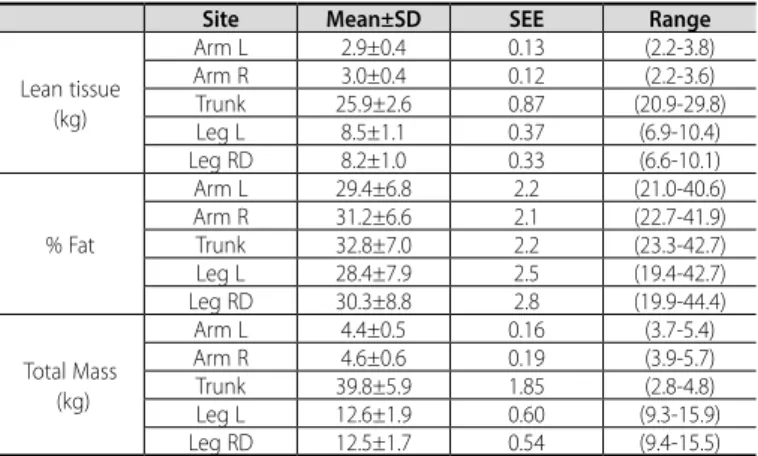
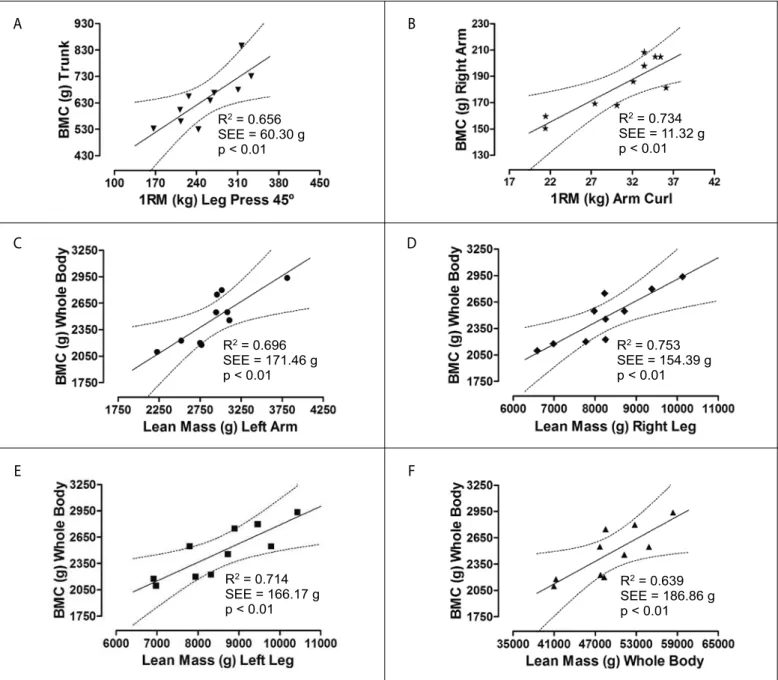
Subjects presented 29.3±6.9% of whole-body MG (SEE: 2.8%; varia-tion: 20.7-39.9%), 49.2±5.6 kg of whole-body MM (SEE: 1.8 kg; variavaria-tion: 39.5-58.3kg). Regional body composition characteristics are presented in Table 1. Whole-body BMC was 2474.2±293.2 g (SEE: 92.7 g; variation: 2098.2-2937.5 g), and regional BMC presented values of 183.0±20.7 g (SEE: 6.5 g; variation: 150.5-208.3 g) for R Arm, 178.0±15.2 (SEE: 4.8 g; variation: 154.9-208.0 g) for L Arm, 448.8±65.9 g (SEE: 20.9 g; variation: 331.0-545.6 g) for R Leg, 468.4±67.4 g (SEE: 21.3 g; variation: 347.3-558.6 g) for L Leg, and 644.5±97.0 g (SEE: 30.7 g; variation: 529.9-846.2 g) for Torso. There is a regional tendency which can be observed by the asso-ciation between BMC of the arms, legs and torso with their respective regional lean masses (Table 2). It is possible to observe, for all relations, that the correlation coefficient was elevated and positive between regional lean mass and BMC. As for the correlation between strength capacity in upper and lower limbs exercises and BMC, it is highlighted that the 45º leg-press exercise strength is associated to left leg BMC (r=0.677; P=0.032; 95%IC: 0.23-0.93) and right leg (r=0.714; P=0.020; 95%IC: 0.38-0.92). It is also observed that 45º leg-press strength is associated with torso BMC (r=0.810; P<0.01; 95%IC: 0.56-0.96). For the BMC correlations between left and right legs and strength in 45º leg-press, sample power was 12.7% and 40.4%, respectively. However, the statistical power of the association between 45º leg-press strength vs. torso BMC was 97.0%, parameters
Table 1. Regional and whole-body composition between elders. N = 10.
Site Mean±SD SEE Range
Lean tissue (kg)
Arm L 2.9±0.4 0.13 (2.2-3.8) Arm R 3.0±0.4 0.12 (2.2-3.6) Trunk 25.9±2.6 0.87 (20.9-29.8) Leg L 8.5±1.1 0.37 (6.9-10.4) Leg RD 8.2±1.0 0.33 (6.6-10.1)
% Fat
Arm L 29.4±6.8 2.2 (21.0-40.6) Arm R 31.2±6.6 2.1 (22.7-41.9) Trunk 32.8±7.0 2.2 (23.3-42.7) Leg L 28.4±7.9 2.5 (19.4-42.7) Leg RD 30.3±8.8 2.8 (19.9-44.4)
Total Mass (kg)
369
to which are presented in Figure 1 (Panel A). No significant correlations were observed between BMC (whole-body or regional) and knee ex-tensor exercise strength. For the upper limbs, it is highlighted that flat bench-press strength is related to left arm BMC (r=0.764; P=0.010; 95%IC: 0.05-0.96) and right arm BMC (r=0.748; P=0.013; 95%IC: -0.03-0.091), as well as arm curl exercise strength is related to right arm BMC (r=0.688;
Table 2. Correlations between regional lean mass (LM) and regional and whole-body bone mass content (BMC). N = 10.
BMC LM Arm L Arm R Leg L Leg R Trunk
Arm R 0.733* 0.886** 0.736* 0.724* ---95%IC (0.85-0.95) (0.71-0.96) (0.35-0.95) (0.25-0.94) Arm L 0.946** 0.767** 0.744* 0.752* 0.697*
95%IC (0.65-0.99) (0.21-0.96 (0.34-0.95) (0.15-0.97) (0.27-0.94) Leg R 0.748* 0.793** 0.864** 0.894** 0.737*
95%IC (0.49-0.93) (0.43-0.96 (0.69-0.97) (0.75-0.98) (0.31-0.92) Leg L 0.753* 0.738* 0.912** 0.953** 0.817**
95%IC (0.25-0.95) (0.27-0.95 (0.77-0.98) (0.89-0.99) (0.35-0.96) Torso 0.827** --- 0.674* 0.726*
---95%IC (0.38-0.97) (0.21-0.93) (0.25-0.94) Whole-body 0.834** 0.755* 0.845** 0.868** 0.682*
95%IC (0.64-0.96) (0.35-0.95) (0.57-0.96) (0.61-0.98) (0.15-0.91) Sides L – left and R – right of body. Significative at *p ≤ 0.05; **p ≤ 0.01.
P=0.028; 95%IC: -0.21-0.95) and right arm BMC (r=0.856; P=0.002; 95%IC: -0.50-0.98) and whole-body BMC (r=0.673; P=0.033; 95%IC: 0.36-0.90). Sample power for the correlations between BMC and left and right arms and flat bench-press have reached, respectively, 77.7% and 66.8%; meanwhile, sample power for correlations between arm curl strength and left and right arms and whole-body was, respectively, 20.6%, 99.8% and 9.6%. Figure 1 (Panel B) presents reliability parameters for this association between arm curl strength and right arm BMC.
Beside regional tendency, there was also a global tendency of asso-ciation between BMC and strength and body composition. This tendency revealed the relation between whole-body BMC and: (i)flat bench-press strength (r=0.701; P=0.024; 95%IC: 0.18-0.94), (ii) 45º leg-press strength (r=0.718; P=0.019; 95%IC: 0.30-0.96) and (iii) whole-body MM (r=0.787; P<0.01; 95%IC: 0.42-0.94). Although, whole-body BMC and muscular strength in the flat bench-press and 45º leg-press associations presented sample power of 30.3% and 43.8%, respectively. But, left arm lean mass, left and right legs lean mass and body lean mass vs. whole-body BMC, presented sample power of, respectively, 99.6% (Figure 1, Panel C), 99.9% (Figure 1, Panel D), 100.0% (Figure 1, Panel E) and 90.1% (Figure 1, Panel F).
Figure 1. Dispersion analysis between regional or whole-body BMC and strength parameters (Panels A and B) and regional upper limbs (Panel C), lower limbs (Panels D and E) and whole-body lean mass (Panel F).
A
C
E
B
D
F
R2 = 0.656
SEE = 60.30 g p < 0.01
R2 = 0.734
SEE = 11.32 g p < 0.01
R2 = 0.696
SEE = 171.46 g p < 0.01
R2 = 0.753
SEE = 154.39 g p < 0.01
R2 = 0.714
SEE = 166.17 g p < 0.01
R2 = 0.639
370
DISCUSSION
Results show that BMC variation, among elderly men, is associated with muscular strength capacity in upper and lower limbs, in an order of magnitude similar (or slightly inferior) to the association presented by regional and body lean mass composition parameter and BMC. If on one hand, the whole-body lean mass presents well documented evidence of association with BMC, particularly among elderly men;23,24
on the other hand, regional lean mass is still timidly investigated,25
maybe due to the fact that experimental delimitations involve specific measures of BMD/BMC (hips and spinal column) and that it involves elderly participants diagnosed with bone mineral disturbances (os-teopenia and osteoporosis).14,24,25 As such, the present study confirms
the expectation of positive association between regional lean mass and regional and whole-body BMC, adding the occurrence of a local tendency that makes this association more specific among variables of a same body region. This local tendency was also observed in associations between strength capacity and BMC, but this evidence has not been as well observed, despite lean mass being consistently reported as an indicative of muscular mass and functional motor quality among the elderly, be it because it relates to muscular strength26 or
lower propensity to accumulate fat.27
The maximum strength evaluation in global exercises presents itself, therefore, as a tool with a practical potential to indicate variations in BMC, both body and local, in elders. There is, though, information that the influence of strength over BMC/BMD tends to be higher than that presented by body or regional lean mass (legs or arms), as observed by Frontera et al.28 On the other hand, present results don’t align with the
results observed in the study by Vincent et al.,29 for which the increase in
muscular strength does not relate to increase in muscular mass, as it was not observed the potential of muscular strength to indicate variations in body BMC. Therefore, the results here presented corroborate that lean mass of the legs (right and left) ratifies as an indSEEndent factor of bone mineral integrity, similar to the potential of whole-body lean mass, besides pointing muscular strength in resisted exercises as an promising indexer of lean mass and it’s functional capacity and of BMC variations among elderly people.
As for muscular strength, it is relevant to highlight the associa-tion presented by strength in flat brench-press and 45º leg-press (both multi joint exercises that represent the functional aptitude of upper and lower limbs),21 which relate moderately to the regional
and body BMC and to body lean mass. This association is due to the presumption that flat brench-press and 45º leg-press are considered global exercises, which engage a great quantity of muscular mass in their execution21 and that, therefore, don’t promote local
influen-ce. Such results are in accordance to the data analyzed by Hughes et al.30 about the absence of association between muscular strength
for single joint exercises and bone mineral density, which showed to be related only to body lean mass. These results also corroborate the findings in the study by Lee et al.,31 which stated the relation
between body lean mass and hip bone mass (region that presents higher levels of osteopenia), concluding that, therefore, the increase in lean mass reduces the chances of osteoporosis. In our results, the torso regional composition (which includes the pelvic girdle, spinal column, ribs and shoulder girdle) also presented significant associa-tion with body BMC, or legs regional. However, 45º leg-press strength
also presented association with torso BMC, allowing to extend the findings of Lee et al.,31 by defining this strength variable as indexer
as important as lean mass (body or regional) in the prevention of osteoporosis in the torso’s bone sites.
It is also worth highlighting that the decline in physical activity is associated with aging, as are the reductions on BMC and whole-body and regional lean mass. Proctor et al.24 observe that, ranging from 20
and 80 years old there is a tendency of reduction in physical activity between 34-38% for men and women, simultaneously body lean mass reductions (18-17%) and BMC reductions (16-30%). However, among women, the torso’s regional fat tends to have a protective effect over hips BMD, presumably because of its part in the regulation of estrogens secretions and the effect of this humoral factor over the activity of osteoblasts.23,32,33 Although, both in women and men, body
fat accumulation, caused by aging and a sedentary lifestyle, causes reduction of bone mass and skeletal muscles, respectively.16,17,27,34 It is,
therefore, highlighted the potential of resisted exercise in the upkeep of the muscle-bone unity’s integrity, once the upkeep/raise of lean mass and strength are answers effectively provided by weight training and, as such, recommended to provide locomotive indSEEndence and reduce risks of fracture among the elderly. However, there is a limitation of this present study when proposing BMC (whole-body or regional) as a variable related to lean mass (regional and whole-body) and to strength, due to the fact that these were not observed after a training period (evidences of concomitant alterations to the related parameters), or due to the fact that there are no other indicative of bone mineral state among the analyzed elderly people, as biochemi-cal variables of bone metabolism (example: osteobiochemi-calcin and alkaline phosphatase), evidencing bone formation indicatives and its relations to lean mass and maximum strength.
CONCLUSION
In the present study, results confirm regional lean mass as a factor related to mineral bone integrity, in magnitude similar to body lean mass. Results also suggest the muscular strength capacity presents similar as-sociation tendency to regional and body BMC. So, the muscular strength development is rSEEatedly important in the upkeep of body lean mass in elderlies and directly contributes to a healthy bone mass state, once the relation between regional/whole-body lean mass and body BMC is high. It is recommended, therefore, that resisted exercise figures in training plans for elderlies, focusing on increasing regional lean mass in upper and lower limbs, reduces fat accumulation and secures functional indSEEndence. By this bias, future studies should explore different routines of resisted training (or its combination with cardiorespiratory resistance, such as running) which would be more conclusive about the efficiency of morphological changes in lean tissue and strength, with effect over whole-body and regional BMC.
ACKNOWLEDGEMENTS
The authors would like to thank all participants for their incom-mensurable contribution, as well as the University Social Program: The Gym of the Square for supporting the evaluation of the subjects and training execution.
All authors declare no potential conflict of interest related to this article.
371
REFERENCES
1. Gomez-Cabello A, Ara I, González-Agüero A, Casajús JA, Vicente-Rodríguez G. Effects of training on bone mass in older adults: a systematic review. Sports Med. 2012;42(4):301-25.
2. Baumgartner RN, Koehler KM, Gallagher D, Romero L, Heymsfield SB, Ross RR, et al. Epidemiology of sarcopenia among the elderly in New México. Am J Epidemi. 1998;147(8):755-63.
3. Lexell J, Taylor CC, Sjöström M. What is the cause of the ageing atrophy? Total number, size and proportion of different fiber types studied in whole vastus lateralis muscle from 15-to 83-year-old men. J Neurol Sci. 1988;84(2-3):275-94.
4. Going S, Willians D, Lohman T. Aging and body composition: biological changes and methodological issues. Eur Pub Cent. 1995;23(1):411-58.
5. Kerr D, Morton A, Dick I, Prince R. Exercise effects on bone mass in postmenopausal women are site-specific and load-dSEEndent. J Bone Miner Res. 1996;11(2):218-25.
6. Korth WM, Snead DB, Slatopolsky E, Birge SJ. Additive effects of weight-bearing exercise and estrogen on bone mineral density in older women. J Bone Miner Res. 1995;10(9):1303-11.
7. Creighton DL, Morgan AL, Boardley D, Brolinson PG. Weight-bearing exercise and markers of bone turnover in female athletes. J Appl Physiol (1985). 2001;90(2):565-70.
8. Pruitt LA, Jackson RD, Bartels RL, Lehnhard HJ. Weight training effects on bone mineral density in early postmenopausal women. J Bone Miner Res. 1992;7(2):179-85.
9. Ott SM. Bone strength: more than just bone density. Kidney Int. 2016;89(1):16-9.
10. Andreolli A, Monteleone M, Van Loan M, Promenzio L, Tarantino U, De Lorenzo A. Effects of different sports on bone density and muscle mass in highly trained athletes. Med Sci Sports Exerc. 2001;33(4):507-11. 11. Maimoun L, Lumbroso S, Manetta J, Paris F, Leroux JL, Sultan C. Testosterone is significantly reduced in
endurance athletes without impact on bone mineral density. Horm Res. 2003;59(6):285-92. 12. Cullen DM, Smith RT, Akhter MP. Bone-loading response varies with strain magnitude and cycle number.
J Appl Physiol (1985). 2001;91(5):1971-6.
13. Huuskonen J, Vaisanen SB, Kroger H, Jurvelin JS, Alhava E, Rauramaa R. Regular physical exercise and bone mineral density: a four-year controlled randomized trial in middle-aged men – the DNASCO study. Osteoporos Int. 2001;12(5):349-55.
14. Taaffe DR, Cauley JA, Danielson M, Nevitt MC, Lang TF, Bauer DC, et al. Race and sex effects on the association between muscle strength, soft tissue, and bone mineral density in healthy elders: the Health, Aging and Body Composition Study. J Bone Miner Res. 2001;16(7):1343–52.
15. Matsui Y, Takemura M, Harada A, Ando F, Shimokata H. Effects of knee extensor muscle strength on the incidence of osteopenia and osteoporosis after 6 years. J Bone Miner Metab. 2014;32(5):550-5.
16. Bocalini DS, Serra AJ, dos Santos L, Murad N, Levy RF. Strength training preserves the bone mineral density of postmenopausal women without hormone replacement therapy. J Aging Health. 2009;21(3):519–27.
17. Marques EA, Gudnason V, Sigurdsson G, Lang T, Johannesdottir F, Siggeirsdottir K, et al. Are bone turnover markers associated with volumetric bone density, size, and strength in older men and women? The AGES–Reykjavik study. Osteoporos Int. 2016;27(5):1765–76.
18. Guimarães BR, Pimenta LD, Massini DA, dos Santos D, da Cruz LOS, Simionato AR, et al. Muscle strength and regional lean body mass influence on mineral bone health in young male adults. PloS One. 2018;13(1):e0191769.
19. Laskey MA. Dual-energy X-ray absorptiometry and body composition. Nutrition. 1996;12(1):45-51. 20. Lukaski HC. Soft tissue composition and bone mineral status: evaluation by dual-energy x-ray
absorp-tiometry. J Nutr. 1993;123(2 Suppl):438-43.
21. Baechle TR, Earle RW. Essentials of strength training and conditioning/National Strength and Conditioning Association. 3rd ed. Champaign: Human Kinetics, 2008.
22. Díaz SP, Fernández SP. Determinación del tamaño muestral para calcular la significación del coeficiente de correlación lineal. Cad Aten Primaria. 2002;9:209-11.
23. Makovey J, Naganathan V, Sambrook P. Gender differences in relationships between body composition components, their distribution and bone mineral density: a cross-sectional opposite sex twin study. Osteoporosis Int. 2005;16(12):1495-505.
24. Proctor DN, Melton LJ, Khosla S, Crowson CS, O’Connor MK, Riggs BL. Relative influence of physical activity, muscle mass and strength on bone density. Osteoporosis Int. 2000;11(11):944-52. 25. Menkes A, Mazel S, Redmond RA, Koffler K, Libanati CR, Gundberg CM, et al. Strength training increases
regional bone mineral density and bone remodeling in middle-aged and older men. J Appl Physiol (1985). 1993;74(5):2478–84.
26. Goodpaster BH, Park SW, Harris TB, Kritchevsky SB, Nevit M, Schwarts AV, et al. The loss of skeletal muscle strength, mass, and quality in older adults: the health, aging and body composition study. J Gerontology Med Sci. 2006;61(10):1059-64.
27. Horber FF, Gruber B, Thomi F, Jensen EX, Jaeger P. Effect of sex and age on bone mass, body composition and fuel metabolism in humans. Nutrition. 1997;13(6):524-34.
28. Frontera WR, Meredith CN, O’reilly KP, Knuttgen HG, Evans WJ. Strength conditioning in older men: skeletal muscle hypertrophy and improved function. J Appl Physiol (1985). 1988;64(3):1038-44.
29. Vicent KR; Braith RW. Resistance exercise and bone turnover in elderly men and women. Med Sci Sports Exer. 2002;34(1):17-23.
30. Hughes VA, Frontera WR, Dallal GE, Lutz KJ, Fisher EC, Evans WJ. Muscle strength and body composition: associations with bone density in older subjects. Med Sci Sports Exer. 1995;27(7):967-74.
31. Lee N, Radford-Smith GL, Forwood M, Wong J, Taaffe DR. Body composition and muscle strength as predictors of bone mineral density in Crohn’s disease. J Bone Miner Metab. 2009;27(4):456-63. 32. Zehnacker CH, Bemis-Dougherty A. Effect of weighted exercises on bone mineral density in post
menopausal women: a systematic review. J Geriatr Phys Ther. 2007;30(2):79-88.
33. Welsh L, Rutherford OM. Hip bone mineral density is improved by high-impact aerobic exercise in postmenopausal women and men over 50 years. Eur J Appl Physiol Occup Physiol.1996;74(6):511-7. 34. Maddalozzo Gf, Snow CM. High intensity resistance training: effects on bone in older men and women.