Somatic maturation and body composition in female healthy adolescents
with or without adjustment for body fat
Maturação somática e composição corporal em adolescentes eutróficos do sexo feminino com ou sem adequação de gordura corporal
Maturación somática y composición corporal en adolescentes eutróficos del sexo femenino con o sin adecuación de grasa corporal
Valter Paulo N. Miranda1, Franciane Rocha de Faria1, Eliane Rodrigues de Faria1, Silvia Eloiza Priore1
Instituição: Departamento de Nutrição e Saúde da Universidade Federal de Viçosa (UFV), Viçosa, MG, Brasil
1UFV, Viçosa, MG, Brasil ABSTRACT
Objective: To evaluate the relationship between the stages of somatic maturation and body composition in eutro-phic female adolescents with or without excessive body fat.
Methods: Cross-sectional study of 118 female adoles-cents, from 14 to 19 years-old, in Viçosa, Minas Gerais, Southeast Brazil. The adolescents were divided in two groups: Group 1 (G1), eutrophic with adequate body fat percentage, and Group 2 (G2), eutrophic with high body fat percentage. The somatic maturation was assessed by the formula for estimating the Peak Height Velocity (PHV).
Results: The PHV had higher average score in G1 adoles-cents compared to G2 (0.26 versus 0.05; p=0.032). There was an association between G1, G2 and the somatic maturation (p=0.049). The female adolescents before and during PHV presented higher values of fat body BMI (p=0.034) and per-centage of central fat (p=0.039) compared to the adolescents after PHV. There was a correspondence between before PHV stage and the excess of body fat (α=0.751).
Conclusions: There was an association between somatic maturation and body composition in eutrophic female adolescents. Length, BMI and fat percentage were differ-ent among the somatic maturation stages. It is relevant to evaluate the somatic maturation and the changes occurring
in the body composition during adolescence in order to better evaluate and manage the nutritional status and the body fat excess.
Key-words: adolescent/growth & development; body composition; body fat.
RESUMO
Objetivo: Avaliar a relação entre os estágios de maturação somática e de composição corporal em adolescentes do sexo feminino eutróficas, com ou sem excesso de gordura.
Métodos: Estudo transversal com 118 adolescentes do sexo feminino, de 14 a 19 anos, em Viçosa, Minas Gerais, divididas em dois grupos: Grupo 1 (G1) – eutróficas com percentual adequado gordura corporal – e Grupo 2 (G2) – eutróficas com percentual elevado de gordura. Avaliou-se a maturação somática pela fórmula de estimativa do Pico de Velocidade de Crescimento (PVC).
Resultados: O PVC teve maior escore médio nas ado-lescentes do G1 em comparação ao G2 (0,26 versus 0,05;
p=0,032). Houve associação entre G1, G2 e os estágios de maturação somática (p=0,049). As adolescentes nos estágios pré e durante PVC apresentaram maiores valores de IMC de gordura (p=0,034) e percentual de gordura
Endereço para correspondência: Valter Paulo N. Miranda Avenida Peter Henry Rolfs s/n Campus Universitário CEP 36570-000 – Viçosa/MG E-mail: [email protected]
Fonte financiadora: Fundação de Amparo à Pesquisa do Estado de Minas Gerais (Fapemig)
Conflito de interesse: nada a declarar
central (p=0,039) do que as adolescentes pós-PVC. Houve correspondência entre o estágio pré-PVC e o excesso de gordura corporal com poder discriminatório satisfatório (α=0,751).
Conclusões: Os resultados mostraram associação entre a maturação somática e a composição corporal de adolescentes eutróficas do sexo feminino.Variáveis como estatura, IMC e percentual de gordura foram diferentes entre os estágios de classificação da maturação somática. Assim, é relevante analisar a maturação somática e as alterações que ocorrem com a composição corporal durante a adolescência, visando avaliar e controlar o estado nutricional e o acúmulo de gor-dura corporal.
Palavras-chave: adolescente/crescimento & desenvolvimento; composição corporal; gordura corporal.
RESUMEN
Objetivo: Evaluar la relación entre las etapas de matura-ción somática y de composimatura-ción corporal en adolescentes del sexo femenino eutróficas, con o sin exceso de grasa.
Métodos: Estudio transversal con 118 adolescentes del sexo femenino, de 14 a 19 años, en Viçosa, Minas Gerais (Brasil), divididas en dos grupos: Grupo 1 (G1) – eutróficas con porcentaje elevado de grasa corporal – y Grupo 2 (G2) – eutrófica con porcentaje adecuado de grasa. Se evaluó la maturación somática por la fórmula de estimativa del Pico de Velocidad de Crecimiento (PVC).
Resultados: El PVC tuvo mayor escore mediano en las adolescentes del G1 en comparación al G2 (0,26 versus 0,05;
p=0,032). Hubo asociación entre G1, G2 y las etapas de ma-turación somática (p=0,049). Las adolescentes en las etapas pre y durante PVC presentaron valores mayores de IMC, de grasa (p=0,034) y porcentaje de grasa central (p=0,039) que las adolescentes post-PVC. Hubo correspondencia entre la etapa pre-PVC y el exceso de grasa corporal con poder discriminatorio satisfactorio (α=0,751).
Conclusiones: Los resultados mostraron asociación entre la maturación somática y la composición corporal de adoles-centes eutróficas del sexo femenino. Variables como estatura, IMC y porcentaje de grasa fueron distintos entre las etapas de clasificación de la maturación somática. Así, es relevante evaluar la maturación somática y las alteraciones que tienen lugar con la composición corporal durante la adolescencia, visando a evaluar y a controlar mejor el estado nutricional y la acumulación de grasa corporal.
Palabras clave: adolescente/crecimiento y desarrollo; composición corporal; grasa corporal.
Introduction
According to the World Health Organization(1),
ado-lescence is deined as the period of life ranging from ten to 19 years, being a phase of transition from childhood to adulthood. Puberty comprises the physical and biological changes; however, adolescence encompasses puberty and psychosocial transitions(1). Puberty starts 1 year earlier in
girls, but their peak height velocity (PHV) occurs two years earlier, compared to boys(1).
During adolescence, there is an increase of approximately 50% in weight and of 15-25% in the individuals’ adult height(2). The girls begin the growth spurt at 9.5 years, 1 or
2 years earlier than boys(3). The changes in body
composi-tion include changes in the relative proporcomposi-tions of water, lean mass, fat mass and skeletal, as well as characteristics of pubertal maturation, resulting in phenotypic differences between the sexes(4). The relative amount of fat in females
gradually increases during adolescence(5). Growth is rapid
in early childhood and pre-adolescence, increasing sharply during the adolescence growth spurt, reducing and, even-tually ending, as adult dimensions are achieved(6). Physical
growth is particularly sensitive to environmental conditions, among which stand out: immigration, emerging diseases, low levels of physical activity, the various types of urbani-zation, differences in socioeconomic terms and basic health care, in addition to different dietary habits, and pollution(7).
Somatic maturation is used to evaluate the biologi-cal development, using, for this, the analysis of PHV in height(8,9), which can be obtained by the formula of Mirwald
et al(10), which has anthropometric measures of height, height,
and cephalic length.
All changes in body composition that occur during adolescence are associated with the biological maturation state(9). Changes in the nutritional status of adolescents may
vary between individuals, according to genetic, hormonal, and environmental processes(1,11). In the study by Pinto
et al(12),the prevalences of overweight and abdominal obesity
Given the above, the aim of this study was to evaluate the relationship between the stages of somatic maturation and body composition in eutrophic adolescent females or without excess body fat.
Method
Cross-sectional study, with 118 female adolescents from 14 to 19 years, students of public schools in the municipality of Viçosa, state of Minas Gerais, with the following inclusion cri-teria: presence of menarche for at least 1 year; to be eutrophic by the BMI with adequate or excess body fat percentage; do not make use of medications; do not present chronic illnesses and not having been pregnant, or to be pregnant.
The adolescent were grouped into: Group 1 (G1), eutro-phic by BMI for age and sex (IMC/A)(13) and with adequate
body fat percentage (>20% and <25%)(14); Group 2 (G2),
eutrophic by BMI/A(13), but with a high percentage of body
fat (≥30%)(14). The percentage body fat (%BF) was
estima-ted by bipolar bioelectrical impedance (Tanita®) and by the
biceps, triceps, subscapular, and suprailiac skinfold thickness measured by a Lange Skinfold Caliper (Beta Technology Inc), according to techniques proposed by Cameron(15). We
classi-ied %BF as proposed by Lohman(14). To be included in the
study, the adolescent’s %BF should match the classiication range by the two methods.
To calculate the sample size, we used the software Epi-Info 6.04. We considered the population of 3,608 adolescents in the age range and sex for the study(16), the prevalence of
excess body fat of 25%(17), an acceptable variability of 11%
and a conidence level of 95%, with minimum sample of 59 adolescents in each group (G1 and G2), totaling a sample of 118 adolescents.
For the sample selection, we chose randomly four public schools by convenience, located in the urban area of the muni-cipality. Screening was performed with measurement of weight, height, and %BF in 560 adolescents. Of these, all students who met the inclusion criteria participated in the random selection draw. The selected adolescents from both groups underwent anthropometric and body composition assessments.
According to the techniques proposed by Jellife(18), weight
was measured using an electronic digital scale with a ma-ximum capacity of 150kg and 100g sensitivity, and height was measured with a portable stadiometer with 2.0m-lenght and 0.1cm-resolution. We classiied the nutritional status by BMI and height by age and sex, as proposed by the World Health Organization(13).
For the location of the peripheral and central body fat, we used the sum of the biceps and triceps skinfolds and the subs-capular and suprailiac skinfolds. Body fat in kilograms (Fat kg) was calculated from the %BF estimated by the bioimpe-dance analyzer and the adolescent’s weight. The fat-free mass in kilograms (FFM kg) was obtained subtracting the Fat kg from the total weight.
The waist circumference (WC) and the hip circumferen-ce (HC) were measured with a lexible and inelastic tape measure, with extension of 2m, divided into centimeters and subdivided into millimeters, care being taken not to compress the soft parts. The measure f the WC was ob-tained at the midpoint between the last rib and the iliac crest, and the HC as the largest circumference of the hip--buttocks region. We calculated the waist-to-hip ratio (WHR) and the waist-to-height ratio (WHtR). The WC, the RCQ, and the RCE were classiied as: adequate (<90th percentile) and inadequate (≥90th percentile). The 90th percentile is the cutoff used for the studied population(19).
We calculated the somatic maturation with the for-mula to estimate the PHV for adolescents, developed by Mirwald et al(10). The formula of somatic maturation for
girls, according to Mirwald et al(10), is: -9,376 + [0.0001882
x (leg length and sitting height interaction)] + 0.0022 x (age and leg length interaction) + 0.005841 x (age and sitting height interaction) – 0.002658 x (age and weight interaction) + 0,07693 x (weight by height ration). From the resulting value, adolescents were classiied into three stages: pre-PHV (PHV<-1), during PHV (PHV≥-1 or PHV≤+1) and post-PHV (PHV>+1).
For data analysis we used the software Epi-Info 6.04 and the Statistical Package for the Social Sciences (SPSS), ver-sion 17.0. We performed the Kolmogorov-Smirnov test to verify the normality of data. We used the Mann-Whitney; Kruskall-Wallis, and the Bonferroni’s post hoctest (for the latter, we considered p<0.025). Pearson’s chi-square test for linear association was used to verify the relationship between somatic maturation and nutritional status of adolescents. We also used the multiple correspondence analysis, as a method of multivariate exploratory analysis, to observe the association between groups of adolescents regarding body fat, stages of somatic maturation, and the classiication of WC, WHR and the WHtR.
Variables PHV – Median (Minimum-Maximum) p-value*
Pre-PHV During-PHV Post-PHV
Weight 51.1 (38.0–58.0) 51.1 (38.8–66.6) 50.6 (43.6–68.8) 0.983
Height 1.6 (1.5–1.63) 1.6 (1.47–1.74) 1.6 (1.5–1.7)a 0.015
BMI 21.4 (17.2–23.0) 19.6 (16.6–24.5) 19.2 (17.3–24.74) 0.278
FBMI 7.6 (4.2–8.93)b 4.9 (3.4–9.9)b 4.6 (3.71–9.9) 0.034
FFBM 13.9 (12.96–14.9)c 14.3 (12.9–16.1)c 14.6 (13.3–15.3) 0.264
%BF 32.5 (25.0–34.0) 25.0 (21.5–37.8) 25.0 (20.5–34.8) 0.039
%BF4S 54.1 (41.7–60.9) 51.4 (38.2–65.6) 49.2 (43.8–58–5) 0.148
WC 68.5 (57.0–74.0) 66.0 (57.0–80.0) 65.5 (60.0–78.0) 0.607
HC 93.5 (82.0–100.0) 91.8 (81.0–103.0) 90.0 (58.0–105.0) 0.741
WHR 0.73 (0.68–0.80) 0.72 (0.61–0.85) 0.73 (0.64–0.8) 0.859
WHtR 0.44 (0.38–0.49) 0.40 (0.34–0.5) 0.40 (0.37–0.48) 0.076
FFM 34.7 (28.7–38.9) 37.1 (30.46–44.5) 37.8 (33.3–41.34) 0.068
FKg 18.0 (9.3–21.0) 13.0 (8.34–27.31) 12.2 (9.5–27.5) 0.215
Table 1 - Stages of somatic maturation and evaluation of anthropometric and body composition variables in eutrophic adolescents from 14 to 19 years, with adequate or high body fat percentage. Viçosa (2005)
PHV: peak height velocity; WC: waist circumference; HC: Hip circumference; BMI: body mass index; BFMI: body fat mass index; FFBM: fat-free body mass; %CBF: central fat percentage; %CF4S: central fat percentage 4 skinfolds; WHR: waist-to-hip ratio; WHtR: waist-to-height ratio;
FFM: fat-free mass (kg); Fkg; total fat in kg. *signiicant value by the Kruskall Wallis test with Bonferroni’s post hoc test. apost-puberty classiication
greater index of height, veriied by the post hoc de Bonferroni’s post hoc (p<0.025). bclassiication pre-PHV and during PHV with greater indexes
of BFMI. cclassiication pre-PHV and during PHV with greater indexes of central fat percentage.
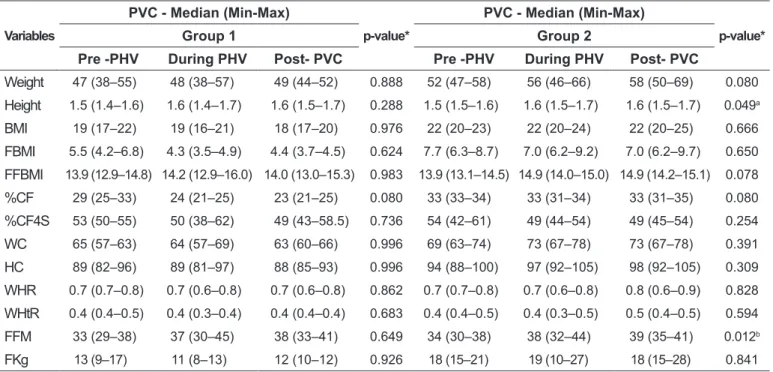
Table 2 - Classiication of stages of somatic maturation and evaluation of anthropometric and body composition variables of eu -trophic adolescents from 14 to 19 years, according to study groups. Viçosa, 2009
Variables
PVC - Median (Min-Max)
p-value*
PVC - Median (Min-Max)
p-value*
Group 1 Group 2
Pre -PHV During PHV Post- PVC Pre -PHV During PHV Post- PVC
Weight 47 (38–55) 48 (38–57) 49 (44–52) 0.888 52 (47–58) 56 (46–66) 58 (50–69) 0.080
Height 1.5 (1.4–1.6) 1.6 (1.4–1.7) 1.6 (1.5–1.7) 0.288 1.5 (1.5–1.6) 1.6 (1.5–1.7) 1.6 (1.5–1.7) 0.049a
BMI 19 (17–22) 19 (16–21) 18 (17–20) 0.976 22 (20–23) 22 (20–24) 22 (20–25) 0.666
FBMI 5.5 (4.2–6.8) 4.3 (3.5–4.9) 4.4 (3.7–4.5) 0.624 7.7 (6.3–8.7) 7.0 (6.2–9.2) 7.0 (6.2–9.7) 0.650
FFBMI 13.9 (12.9–14.8) 14.2 (12.9–16.0) 14.0 (13.0–15.3) 0.983 13.9 (13.1–14.5) 14.9 (14.0–15.0) 14.9 (14.2–15.1) 0.078
%CF 29 (25–33) 24 (21–25) 23 (21–25) 0.080 33 (33–34) 33 (31–34) 33 (31–35) 0.080
%CF4S 53 (50–55) 50 (38–62) 49 (43–58.5) 0.736 54 (42–61) 49 (44–54) 49 (45–54) 0.254
WC 65 (57–63) 64 (57–69) 63 (60–66) 0.996 69 (63–74) 73 (67–78) 73 (67–78) 0.391
HC 89 (82–96) 89 (81–97) 88 (85–93) 0.996 94 (88–100) 97 (92–105) 98 (92–105) 0.309
WHR 0.7 (0.7–0.8) 0.7 (0.6–0.8) 0.7 (0.6–0.8) 0.862 0.7 (0.7–0.8) 0.7 (0.6–0.8) 0.8 (0.6–0.9) 0.828
WHtR 0.4 (0.4–0.5) 0.4 (0.3–0.4) 0.4 (0.4–0.4) 0.683 0.4 (0.4–0.5) 0.4 (0.3–0.5) 0.5 (0.4–0.5) 0.594
FFM 33 (29–38) 37 (30–45) 38 (33–41) 0.649 34 (30–38) 38 (32–44) 39 (35–41) 0.012b
FKg 13 (9–17) 11 (8–13) 12 (10–12) 0.926 18 (15–21) 19 (10–27) 18 (15–28) 0.841
PHV: peak height velocity; Max: maximum value; WC: wait circumference; HC: hip circumference Min: minimum value; BMI: body mass index; BFMI: body fat mass index; FFBMI: fat-free body mass index; %CF: percentage of central fat; %CF4S: percentage of central fat 4 skinfolds; WHR: waist-to-hip ratio; WHtR: waist-to-height ratio; FFM: fat-free mass; Fkg: total fat in kg. *significant value (p<0.05) by Kruskall Wallis test.
aIn Group 2 post-PHV adolescents with higher height than pre-PHV veriied by Bonferroni’s test (p<0.05); bIn Group 2 the post-PHV adolescents
Results
The study included 118 adolescents with a mean age of 16.4±1.4 years. Adolescents from G2 presented higher va-lues for weight, BMI, BMI of fat, WC, HC, WHR, WHtR, and percentage of central and peripheral fat (p<0.001). Regarding the classiication of somatic maturation, 10 (8.5%) were classiied as in the pre-PHV, 92 (78.0%) in the PHV, and 16 (13.5%) in the post-PHV stage.
PHV in height had higher scores in adolescents from G1 in comparison to G2 (0.26 versus 0.05 points; p=0.032). An association was found between groups and stages of soma-tic maturation (p=0.049). There was a greater proportion of G1 adolescents (96.2%) in the stages during and post-spurt in comparison to G2 adolescents (86.42%). Girls in the pre-PHV and during PHV presented higher BMI values of fat (p=0.034) and percentage of central fat (p=0.039), when compared to those in post-PHV (Table 1).
By analyzing the somatic maturation separately in each group, no difference was found between the PHV stage and anthropometric measures in G1. On the other hand, adolescents from G2 who were in the period of spurt and post-spurt presented higher values of height and fat-free mass (Table 2).
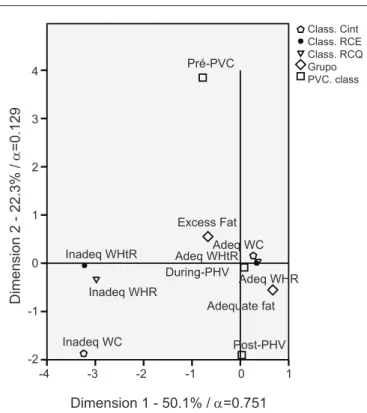
In multiple correspondence analyses (Figure 1), the main plain (dimension 1=50.1% and dimension 2=22.3%) explained 72.4% of data variability. The irst dimension presented Cronbach’s alpha equal to 0.751, with satisfactory discriminatory power. This dimension is characterized by the extremes – adolescents in the pre-spurt stage, with excess body fat (G2) and with inadequate values of WC, WHR, and WtHR were correspondent.
Discussion
The results showed an association between somatic matu-ration and body composition in eutrophic female adolescents. Variables such as height, BMI of fat and %BF were different between the stages of somatic maturation. We observed that measures of body fat were associated with the pre-PHV and during-PHV stages. Similarly, studies showed that the stages of sexual maturation inluence the anthropometric and body composition parameters, allowing the systematic construction and use of references considering pubertal development(4,20,21).
According to Siervogel et al(11), during puberty, there are
changes in lean body mass and in body fat distribution,
with accelerated growth rate (growth spurt) and the fusion of the bone epiphysis until adult height is achieved. The distribution of body fat that occurs during the process of maturation may explain the frequency of adolescents with adequate %BF, classiied in the stages during PHV and post-PHV of somatic maturation.
PHV was higher in eutrophic adolescents with appropria-te percentage of body fat compared to those with excess body fat (p=0.032). Adolescents with adequate %BF were more frequently classiied as during and post-PHV; while those with excess adiposity were more frequently classiied in the pre-PHV stage (Figure 1). Physiologically, this inding can be explained, as a certain amount of body fat is necessary for the growth spurt in both sexes, and in females body fat is accumulated especially in the central region(11).
Figure 1 - Multiple correspondence analysis between the groups
of classiication of somatic maturation, indexes of waist circumfe -rence and waist-to-height ratio with the groups of adolescents with adequate fat percentage (G1) and excess fat (G2)
Adeq WC Adeq WHtR
Adeq WHR Inadeq WHtR
Inadeq WHR
Inadeq WC Post-PHV
During-PHV
Adequate fat Excess Fat
Pré-PVC
D
ime
n
si
o
n
2
-
2
2
.3
%
/
α
=0
.1
2
9
Dimension 1 - 50.1% / α=0.751
Class. Cint Class. RCE Class. RCQ Grupo PVC. class 4
3
2
1
0
-1
-2
-4 -3 -2 -1 0 1
*Cronbach’s α with satisfactory discriminatory value
The results of this study showed that variables such as height, BMI of fat, and percentage of central fat varied in different classiication stages of somatic maturation. As ob-served, the rates of height were higher in stages during and after PHV. The BMI of fat and the percentage of central fat had higher rates of somatic maturation in pre-PHV stage. According to Barbosa et al(21), the increase in body mass
ob-served in females coincides with increases in fat accumulation and the period of greatest increase in height.
While observing the variation of anthropometric indexes in the stages of somatic maturation in G1 and G2, we found that G1 adolescents with adequate %BF showed no difference in anthropometric indexes of body composition between the groups of somatic maturation. On the other hand, the partici-pants of G2, with excess fat, varied among the three groups of somatic maturation regarding height and fat-free mass in the stages during and post-PHV. This result is consistent with the maturation process, since height and muscle mass are directly proportional to the PHV also in females(6,11).
It is noteworthy that all the girls evaluated had already passed menarche; nevertheless, it was found that almost 18% of the total sample was still in the stage of pre-spurt, and these adolescents presented a higher body fat accumulation. To Duarte(20), the weight tends to increase after menarche,
due to the overall growth and development of the body and especially the increase in fat deposits, due to the greater role of estrogen and progesterone. In the irst period, about 95% of adult height has already been reached and linear growth enters a deceleration process, ceasing around 2.5–3.0 years later(20).
According to the literature, the accumulation of fat in the central region in girls who have not reached the PHV is necessary to provide the physiological changes that occur during puberty(4,11). In the present study, there was
correspondence between the group of girls who presented excess fat and inadequate WC, WHR, and WHtR with the pre-PHV classiication of somatic maturation. The ado-lescents who were in the PHV stage and in the post-PHV stage had correspondence with the adequate values of these variables. These results show that the WHR, the WHtR, and the WC were related to the stages of somatic maturation, and it is important to emphasize that these variables are good indicators of metabolic syndrome and of the occurrence of cardiovascular disease in adolescence(22,23).
Ibanez et al(24) showed that, regardless of BMI, both the
measures that relect total adiposity (body fat in kg and %BF) and those that relect the body fat distribution (waist circumference, WHR, and abdominal fat) were higher, in
all pubertal stages, in girls with early sexual maturation. This association cannot be made in this study, as 8.5% of adolescents, although in the pre-PHV stage, were classiied as pubescent for having already passed the menarche.
Barbosa et al(21) also found that the assessment of
nutri-tional status, and the anthropometric and body compo-sition changes during adolescence are strongly related to the growth spurt. Siervogel et al(11) and the World Health
Organization(25) highlight the importance of considering
biological markers for the beginning and the end of the pubertal growth spurt. Corroborating the cited researches, the present study showed that, in addition to biological mar-kers, anthropometric body composition variables, especially those related to body fat, have varied in the pre-PHV stage.
The increase in body fat observed in virtually all countries of the world in recent decades, makes the use of anthropo-metric measures in population surveys to deine reference values even more critical(25). According to Gomes et al(26), it
is essential to include information on sexual maturation to assess the nutritional status of adolescents(26). This, in turn, is
marked by the human biological variability, which originates from the interaction between genetic and environmental factors that occur during the growth spurt. Changes in body composition of adolescents are markers of metabolic changes that occur during pubertal development(21,27).
Metabolic changes, in turn, predict the risk of occur-rence in adult life, of non-communicable chronic diseases, especially cardiovascular disease, diabetes, osteoporosis, and obesity(6,7,27,28). Thus, we emphasize that the knowledge of
the association between pubertal development and body composition enables the planning and practice of interven-tion measures to prevent this outcome(11). Several factors
may inluence the development of obesity in adolescence, namely, inadequate dietary intake, physical inactivity, sexual maturity, socioeconomic status and parental inluence(29).
According to Duarte(20), the interrelationships between
growth, physical development, and maturation are still poorly known in Brazilian children and adolescents.
Given the above, it is considered that the pubertal stage determines striking changes in anthropometric and body composition parameters in adolescents. There are numerous intrinsic and environmental factors that may inluence the onset of puberty, with no optimal hormonal marker(21,30).
References
1. World Health Organization. Nutrition in adolescence – issues and challenges for the health sector: issues in adolescent health and development. Geneva: WHO; 2005.
2. Rogol AD, Roemmich JN, Clark PA. Growth at puberty. J Adolesc Health 2002;31:192-200.
3. Saito MI. Padrões do desenvolvimento pubertário e suas variações. In: Setian N, editor. Endocrinologia pediátrica: aspectos físicos e metabólicos do recém-nascido ao adolescente. 2nd ed. São Paulo: Sarvier; 2002. p. 45-7.
4. Benedet J, Assis MA, Calvo MC, Andrade DF. Overweight in adolescents: exploring potential risk factors. Rev Paul Pediatr 2013;31:172-81.
5. Clemente AP, Santos CD, Martins VJ, Benedito-Silva AA, Albuquerque MP, Sawaya LD. Mild stunting is associated with higher body fat: study of a low-income population. J Pediatr (Rio J) 2011;87:138-44.
6. Vieira PR, Faria E, Faria F, Sperandio N, Araújo C, Stofeles R et al. Factors associated with adiposity in normal weight female adolescents with adequate and high percent body fat: elaborating a risk model. Arch Latinoam Nutr 2011;61:279-87. 7. Silva SP, Beunen G, Maia JA. Longitudinal studies on somatic growth and
motor performance: designs, challenges, and needs. Rev Bras Cineantropom Desempenho Hum 2013;15:130-43.
8. Chaves OC, Franceschini SC, Ribeiro SM, Sant’ Ana LF, Faria CG, Priore
SE. Comparison of the biochemical, anthropometric and body composition variables between adolescents from 10 to 13 years old and their parents. Nutr Hosp 2012;27:1127-33.
9. Baxter-jones AD, Eisenmann JC, Sherar LB. Controlling for maturation in Pediatric exercise science. PES 2005;17:18-30.
10. Mirwald RL, Baxter-Jones AD, Bailey DA, Beunen GP. An assessment of maturity from anthropometric measurements. Med Sci Sports Exerc 2002;34:689-94.
11. Siervogel RM, Demerath EW, Schubert C, Remsberg KE, Chumlea WC, Sun S et al. Puberty and body composition. Horm Res 2003;60 (Suppl 1):36-45. 12. Pinto IS, Arruda IK, Diniz AS, Cavalcanti AM. Prevalence of overweight and
abdominal obesity according to anthropometric parameters and the association with sexual maturation in adolescent schoolchildren. Cad Saude Publica 2010;26:1727-37.
13. De Onis M, Onyango AW, Borghi E, Siyam A, Nishida C, Siekmann J. Development of a WHO growth reference for school-aged children and adolescents. Bull World Health Organ 2007;85:660-7.
14. Lohman TG. Assessing fat distribution. In: Lohman TG, editor. Advances in body composition assessment: current issues in exercise science. Champaign: Human Kinetics Publishers; 1992. p. 57-63.
15. Cameron N. The measurement of human growth. Australia: Croom-Helm; 1984.
16. Brasil - Instituto Brasileiro de Geograia e Estatística [homepage on the Internet]. Censo 2010 [cited 2013 Jan 2]. Available from: http://www.sidra.
ibge.gov.br/bda/tabela/listabl.asp?c=1378&z=c &o=7
17. Vieira PC, Priore SE, Franceschini SC, Monteiro JB. Composição corporal de adolescentes após menarca. Rev Min Educ Fis 2002;10:237-486. 18. Jellife DB. Evaluacion del estado de nutricion de La comunidad. Ginebra:
OMS; 1968 (series monograias, 53).
19. Freedman DS, Serdula MK, Srinivasan SR, Berenson GS. Relation of circumferences and skinfold thicknesses to lipid and insulin concentrations in children and adolescents: the Bogalusa Heart Study. Am J Clin Nutr 1999;69:308-17.
20. Duarte MF. Physical maturation: a review with special reference to Brazilian children. Cad Saude Publica 1993;9 (Suppl 1):71-84.
21. Barbosa KB, Franceschini SC, Priore SE. Inluence of the stages of sexual
maturation in the nutritional status, anthropometrics and corporal composition of adolescents. Rev Bras Saude Mater Infant 2006;6:375-82.
22. Gontijo CA, Faria ER, Oliveira RM, Priore SE. Metabolic sydrome among adolescents assited by a healthcare program in Viçosa, Minas Gerais State, Brazil. Rev Bras Cardiol 2010;23:324-33.
23. Pereira PF, Serrano HM, Carvalho GQ, Lamounier JA, Peluzio MC, Francischini SC et al. Circunferência da cintura como indicador de gordura corporal e alterações metabólicas em adolescentes: comparação entre quatro referências. Rev Assoc Med Bras 2010;56:665-9.
24. Ibanez L, Ong K, de Zegher F, Marcos MV, Del Rio L, Dunger DB. Fat distribution in non-obese girls with and without precocious pubarche: central adiposity related to insulineamia and androgenaemia from prepuberty to postmenarche. Clin Endocrinol 2003;58:372-9.
25. World Health Organization. Physical status: the use and interpretation of
antropometry [Technical Report Series, 854]. Geneva: WHO; 1995.
26. Gomes FS, Anjos LA, Vasconcelos MT. Anthropometry as a tool for assessing the nutritional status of adolescents. Rev Nutr 2010;23:591-605.
27. Weiss R, Dziura J, Burgert T, Tamborlane WV, Taksali SE, Yeckel CW et al. Obesity and the metabolic syndrome in children and adolescents. N England J Med 2004;350:2362-74.
28. Pinho AP, Brunetti IL, Papato MT, Almeida CA. Metabolic syndrome in overweight/obese female adolescents. Rev Paul Pediatr 2012;30:51-6. 29. Mattos RS, Luz MT. Sobrevivendo ao estigma da gordura: um estudo
socioantropológico sobre obesidade.Physis 2009;19:489-507.
30. Machado DR, Bonim MR, Costa LT. Peak height velocity as an alternative for maturational classiication associated with motor performance. Rev Bras
Cineantropom Desempenho Hum 2009;11:14-21. Regarding limitations of this study, we may consider the fact
that teenagers aged from 10 years were not selected, which pro-bably increased the number of girls in the group classiied as pre--PHV. Another limitation is related to the use of a cross-sectional design, which does not allow the assessment of cause and effect. Even so, there was a relationship between somatic maturation and body composition variables in adolescents.
We may conclude that there is variation of anthropome-tric and body composition values among the three stages of PHV of somatic maturation, especially those related to body fat. The study indicates the importance of following these anthropometric and body composition variables from the beginning of pubertal growth spurt in females, in order to control the accumulation of adipose tissue, as well as its
future consequences on the health of adolescents. Therefore, we realize the importance of working with somatic matura-tion in assessing body composimatura-tion of adolescents.