Body composition, muscle strength and
quality of active elderly women according to
the distance covered in the 6-minute walk test
Karla H. C. Vilaça1, Natália M. C. Alves2, José A. O. Carneiro3,
Eduardo Ferriolli3, Nereida K. C. Lima3, Julio C. Moriguti3
ABSTRACT | Background: Changes arising from the aging process, particularly changes in body composition, contribute to the functional decline of the elderly. Objective: To compare the body composition and muscle strength, mobility and quality in active elderly women according to the distance walked during the 6-minute walk test (6MWT). Method: The study included 77 active elderly women aged 65 to 80 years, who were divided into tertiles (A, B and C) according to the distance covered in the 6MWT. We performed anthropometric and clinical evaluations. Body composition was determined by dual energy X-ray absorptiometry (DXA). Handgrip strength (HGS) was measured with a portable dynamometer (Saehan), and knee extension strength (KES) was measured with the one repetition maximum test (1-RM). Functional mobility was assessed by the Timed Up and Go (TUG) test, and body balance was assessed by the Berg Balance Scale (BBS). Muscle quality was deined by the ratio between muscle strength (kgf) and muscle mass (kg). Results: The group that walked the shortest distance in the 6MWT had a higher BMI (A=30.8±7.0, B=27.2±4.2 and C=25.9±3.5 kg/m2),
greater amount of fat mass (A=31.3±10.7, B=25.9±6.7 and C=23.81±6.46 kg) lower HGS (A=21.8±5.1, B=22.1±3.5 and C=25.5±5.1 kgf), lower knee extension strength (A=30.6±10.9, B=40.4±12.5 and C=47.2±10.1 kgf), lower arm muscle quality (A=10.1±3.7, B=11.6±2 and C=12.7±2.2 kg) and lower leg muscle quality (A=1.78±1, B=2.84±0.98 and C=3.31±0.77 kg). There was no signiicant difference between muscle mass (p=0.25) and lean mass (p=0.26). Conclusion: Body fat has a negative inluence on functional performance, even among active elderly women.
Keywords: body composition; muscle strength; six-minute walk test; muscle quality; elderly subjects; physical therapy.
HOW TO CITE THIS ARTICLE
VilaçaKHC, AlvesNMC, CarneiroJAO, FerriolliE, LimaNKC, Moriguti JC. Body composition, muscle strength and quality of active elderly women according to the distance covered in the 6-minute walk test. Braz J Phys Ther. 2013 May-June; 17(3):289-296. http://dx.doi.org/10.1590/S1413-35552012005000093
1 Programa de Pós-graduação em Gerontologia, Universidade Católica de Brasília (UCB), Brasília, DF, Brasil 2 Universidade Paulista (UNIP), Ribeirão Preto, SP, Brasil
3 Divisão de Clínica Médica Geral e Geriatria, Departamento de Clínica Médica, Faculdade de Medicina de Ribeirão Preto (FMRP),
Universidade de São Paulo (USP), Ribeirão Preto, SP, Brasil Received: 10/08/2012 Revised: 07/11/2012 Accepted: 23/11/2012
a r t i c l e
Introduction
The aging process is characterized by systemic changes that cause an individual to suffer a progressive inability to adapt to the environment in which he or she lives in. Consequently, this increases an individual’s vulnerability to the onset of diseases1.
With advancing age, muscle mass tends to decrease and adipose tissue tends to increase, following a typical pattern of greater visceral, subcutaneous and intramuscular distribution2-4.
This change in body composition, mainly the infiltration of intramuscular fat, reduces muscle quality and performance and contributes to a reduction in strength and functional mobility5.
According to Bouchard et al.6, this increase in body
fat may affect an individual’s functional capacity.
Obesity usually precedes functional decline and is associated with an increased risk of degenerative joint disease, especially in the knees, thus negatively affecting mobility. Obese individuals also present
a proinlammatory state that may contribute to the
reduction of muscle mass, thus affecting muscle strength and quality3.
Sarcopenia, deined as a slow, progressive and
apparently inevitable process of loss of muscle mass and strength, is one of the most important changes that occur with aging2. The condition has been
associated with the atrophy of fast twitch (type II)
of protein synthesis, thus leading to reduced muscle
strength, also known as dynapenia, and eficiency7.
Other changes, such as reduced mineral bone density, visual deterioration, and vestibular and somatosensory changes, lead to immobility, muscle weakness and morbidity8. The reduction of muscle
strength, especially in the lower limbs, is related to a decline in balance and to gait changes5. Carmeli et al.9
demonstrated that in the elderly, there is a relationship between the strength of the knee extensor muscles and physical ability.
Some studies have reported that the loss of muscle quantity and quality contributes to a decline in the performance of daily tasks by causing a reduction of gait velocity5,6,8. Within this context, studies have
suggested that a decline in gait velocity may be used to identify elderly subjects with reduced muscle strength and mass that have functional losses and risks of limitations of the lower limbs5,6.
Tests based on physical performance are routinely used to quantitate functionality. In this respect, the six-minute walk test (6MWT) has been extensively used
as a method for assessing physical itness because it is
easy to apply, is well tolerated by the volunteers, and
relects the activities of daily life10. Although this test
is more frequently used to assess functional capacity in individuals with cardiorespiratory dysfunctions, it is also used in other populations10,11.
Some studies have reported a positive correlation between physical activity, muscle strength and functional performance in the elderly, demonstrating the importance of regular physical activity for the maintenance of functional capacity8,12. However,
studies elucidating the relationship between muscle performance and muscle quality in elderly women and their performance in walk tests are still lacking.
In view of the above considerations, the objective of the present study was to compare the body composition, mobility and muscle strength and quality of active elderly women according to their distances covered in the 6MWT.
Method
Study design
The study was an observational investigation with a cross-sectional design.
The study was approved by the Ethics Committee of the University Hospital, Faculty of Medicine of Ribeirão Preto, Universidade de São Paulo (HCFMRP, USP), Ribeirão Preto, SP, Brazil, HCRP
protocol no. 12152/2007, and the volunteers gave written informed consent prior to participation.
Sample
The sample consisted of 77 female volunteers aged 65 to 80 years who were recruited by Programs of Community Integration of the city of Ribeirão Preto, SP, and by the Center of Physical Education, Sports and Recreation of USP, Ribeirão Preto Campus (CEFER- USP).
The exclusion criteria were women who were younger than 64 years, bedridden, dependent, amputated, and using ortheses or prostheses, with cognitive alterations in the Mini-Mental state Examination13 that would prevent the understanding
of the questionnaires and of the tests. Women with osteomyoarticular changes, localized loss of strength, decompensated acute or chronic disease requiring medical care, visual disorders with no appropriate clinical correction with corrective lenses at the time of
the tests, and with uncompensated vestibular deicits
were also excluded.
The sample was divided into three groups according to the tertiles of the 6MWT as follows: 1st
tertile (Group A) ≤ 33.3% (n=23), 2nd tertile (Group
B) >33.3% ≤ 66.3% (n=32) and 3rd tertile (Group
C) > 66.3% (n=22).
Clinical evaluation
Clinical evaluations were performed by means of anamnesis, including a self-report of the presence or absence of diseases, such as heart conditions, arterial hypertension, diabetes mellitus, cancer, rheumatic disease, chronic pulmonary disease, and depression. The participants were questioned about their personal and family history, associated diseases, medications, daily life activities, habits, and physical activity.
The level of physical activity of the subjects was evaluated by applying the International Physical Activity Questionnaire (IPAQ) version 8, in the format of an interview containing questions about the frequency and duration of moderate or vigorous physical activities and walks in the last week. On the
basis of this interview, the volunteers were classiied
into one of the four categories: very active, active, irregularly active, or sedentary14.
Anthropometry and evaluation of body composition
position herself on the center of the scale. Height was measured using a stadiometer with an inextensible vertical bar graduated from 0.5 to 0.5 cm.
Body composition was determined by dual energy X-ray absorptiometry (DXA) using total body analysis (Hologic, QDR 4500W®, Bedford, MA, USA). The data obtained were processed with the latest program of the system, version 11.2:5. In this scanning technique, an X-ray generator emits pulses of double energy alternate radiation of 70 and 140 kilovolts (kv) by means of an X-ray beam bundle that is attenuated when passing through the body. The attenuation is measured for each point of the body surface in a linear array of 128 detectors. A complex set of measurements follows, permitting the evaluation of bone mineral density and of soft tissue density. This set is then divided into lean mass and fat mass due to their different characteristics of attenuation. The equipment was calibrated daily using a phantom for bone mass and a phantom for soft tissues.
Six-Minute Walk Test
The 6MWT was carried out according to the directives established by the American Thoracic Society11 using the following equipment: a
chronometer (Kadio Professional Quartz Timer, Model KD1069, Taiwan), a measuring tape, a heart rate monitor (Polar FS1, China), a sphygmomanometer (Bic, Itupeva, São Paulo, Brasil), and a double stethoscope (BIC, Itupeva, São Paulo, Brasil).
The tests were carried out in a 40 meter corridor of the University Hospital, Faculty of Medicine of
Ribeirão Preto. The test area was marked on the loor
with colored adhesive tape, and the distance was measured every 5 meters with an inextensible tape.
The inal distance achieved was recorded in meters, with a inal precision of 1 m.
A volunteer’s arterial pressure, heart rate and respiratory rate were determined before and after the test. The volunteers were asked to walk from one end of the corridor to the other at the highest possible speed for six minutes and were instructed to stop the test if they developed pain in the lower limbs, tachycardia or any symptoms of discomfort.
Handgrip strength (HGS)
A portable hydraulic dynamometer (Saehan Corporation, Masan Free Trade Zone, Korea) with a graduation scale in kilograms/force was used for the HGS test. The test was applied according to the recommendations of the American Society of Hand Therapists(ASHT)15.
The volunteer was instructed to remain sitting comfortably with an arm adducted parallel to the
trunk, the elbow lexed at 90°, the forearm in a neutral position and the wrist in 0° to 30° extension, with the
mobile loop of the equipment remaining in position II. The volunteer was instructed and encouraged to pull the loop of the dynamometer, keep it pulled for six seconds and then relax. Three measurements were performed at one minute intervals, with the subject alternating between the dominant and non-dominant side. The highest value was recorded.
Knee Extension Strength (KES)
KES was measured using the 1 repetition maximum (1-RM) protocol adapted from Kraemer et al.16.
Some strategies, based on the guidelines of Simão et al.17, were adopted to reduce the margin
of error in the 1-RM test. Standardized instructions were offered before the test so that the volunteers were aware of the technique for the execution of the exercise and the subjects performed some repetitions without a load in order to familiarize themselves with the movement. Correct positioning was monitored in order to avoid compensatory movements.
An extensor chair was used for the tests (Moviment, São Paulo, Brasil). The loads applied followed the overload of the instrument itself in the form of plates, and when necessary, weights of 1, 2, and 3 kg were added. The instrument was regulated according to the size of the segment of the lower limbs of the volunteers18.
The exercise chosen was bilateral knee extension
on the chair. The sitting position was irst chosen, with
the volunteer’s arms along the body and holding the support of the instrument, with the trunk inclined at
70° and the knee lexed at 90°. The test started from the knee lexion position, followed by complete leg
extension and the return of the legs to the initial position17.
A series of warm-up movements, comprising 6 to
10 repetitions, was irst started with approximately 50% of the load used in the irst attempt of each test19.
The evaluation was started two minutes after the warm-up period, and the volunteers were instructed to try to complete two repetitions of each movement.
If two repetitions were completed in the irst attempt
or if no repetition was completed, a second attempt was performed after a recovery interval of three to
ive minutes with a greater or lower load than that
that for which the volunteer was able to complete only a single repetition of the movement20,21. All tests were
carried out at the same time of day in a temperature-controlled room, and the volunteers were instructed not to practice physical exercises on the eve of the test in order to guarantee the quality of the results20.
Muscle quality
The muscle quality of the upper limbs was calculated as the ratio between the HGS (kgf) and the lean mass of the dominant upper limb (kg).
The muscle quality of the lower limbs was calculated as the ratio between the bilateral KES (kgf) and the quantity of lean mass of the lower limbs (kg)22.
Berg balance scale
The Berg Balance Scale consists of 14 tasks related to daily tasks. The maximum score is 56 points, and each item has an ordinal scale with 5 alternatives from 0 to 4, according to the quality of performance and the time spent to complete each task23.
Before the test, the volunteers were instructed, and when necessary, the execution of the task was demonstrated. The equipment that was used included a chronometer (Kadio Professional Quartz Timer, Model KD1069, Taiwan), a ruler, two chairs with a
distance of 43 cm from the seat to the loor, and a
ladder with two steps.
Timed Up and Go Test (TUG)
A 43 cm high chair with an armrest and a chronometer (Kadio Professional Quartz Timer, Modelo: KD1069, Taiwan) were used to perform the TUG. After the command to start the test, the volunteer was observed as she rose from the chair, walked straight for three meters, and sat down again, while wearing her usual shoes. The time needed to complete the task was recorded in seconds.
Statistical analysis
The Kolmogorov-Smirnov test was used to determine the normality of the data. Descriptive statistics was then applied (mean, standard deviation, minimum and maximum value). A one-way analysis of variance (ANOVA) was used to determine the differences between groups, and the post hoc Tukey test was applied, when necessary. The level of
signiicance was set at 5%.
Results
Group A, corresponding to the 1st tertile, consisted
of 23 elderly women who walked on average 369.7±57.6 m (240-428 m). Group B, corresponding to the 2nd tertile, consisted of 32 elderly women who
walked on average 450.2±12.3 m (433-470 m). Group C, corresponding to the 3rd tertile, consisted of 22
elderly women who walked on average 524±44.5 m (478-643 m).
Table 1 shows the most prevalent diseases of the subjects and the number of medications they used daily according to medical indication. In all the groups, systemic arterial hypertension (SAH) was the most prevalent disease, followed by dyslipidemia, diabetes mellitus (DM) and osteoarthritis.
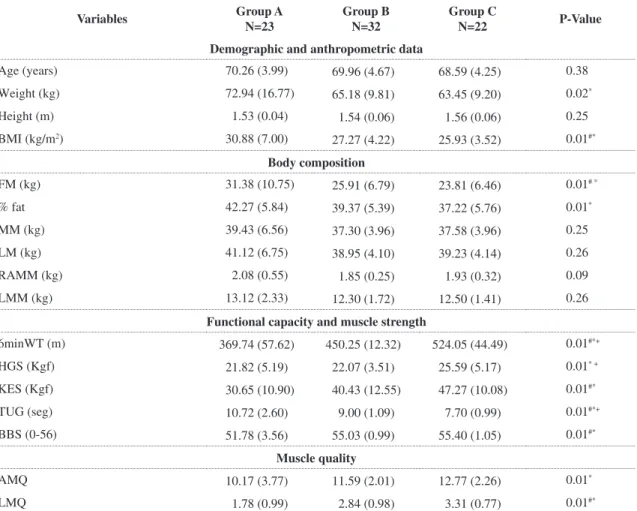
Table 2 presents the values (mean±SD) of the variables and the comparison of the groups. Age, height, lean mass, total fat mass and limb mass did not differ between the groups. The remaining variables
differed signiicantly, especially between groups A
and C (Table 2).
Discussion
In the present study, the elderly women who covered a shorter distance in the 6MWT also had a higher body mass index (BMI), a greater quantity of
fat mass and worse muscle performance, as deined
by muscle strength and quality. Although some studies have investigated the relationship between changes in body composition and functional capacity in the elderly2,6,9,12,24-26, thus far, no publications have
described the performance of elderly subjects in the 6MWT and the muscle quality of active elderly women, especially in the Brazilian population.
According to the data reported in this study, a greater quantity of fat mass and fat percentage were determinants of worse functional performance of the sample studied. These results in agreement with data reported by Pires et al.10, who observed
Table 1. Prevalence of comorbidities and number of medications.
Disease Group A N=23
Group B N= 32
Group C N= 22
SAH (%) 86 68 45
Dyslipidemia (%) 34 40 22
DM (%) 8 21 18
Osteoarthritis (%) 34 18 18
Medications/day 4.9 4.1 2.5
SAH: systemic arterial hypertension, DM: diabetes mellitus,
that individuals with a BMI of more than 35 kg/m2
walked a shorter distance compared to individuals with a BMI of less than 25 kg/m2, indicating that fat had a negative inluence on the performance of the
sample population. In another study, Sallinen et al.24
also reported a strong association between percentage of body fat and maximum walking velocity among elderly people aged 60 to 79 years. In particular, they found that obese elderly individuals had a higher prevalence of dependence and greater impairment of functionality.
The reduced muscle performance observed in the group that walked a shorter distance agrees with the results obtained by Visser et al.25, who reported a signiicant correlation between lower limb strength and gait velocity. This inding demonstrates that
the loss of muscle strength in the elderly is a factor that contributes to the functional decline of this population.
Regarding the Berg Balance Scale and the TUG test data, the results showed the same pattern, i.e., the elderly women who covered a greater distance in the 6MWT also had a better performance on the BBS and the TUG. In a similar study, Barbosa et al.1
assessed the association of the nutritional status of elderly individuals with tests of motor performance
and observed a signiicant association between BMI
with balance among women aged 60 to 79 years. Their results suggested that during the execution of functional balance tests, appropriate support of body mass is necessary, and therefore, the indirect effects of excess body fat may negatively interfere with body balance.
Additionally, the present results demonstrate that in terms of body composition, excess body fat can increase body overload and limit movement due to the stress between joints and muscles, thus increasing the risk of disabilities27. In a study of 156 elderly
Table 2. Anthropometric data, body composition, mobility and muscle quality of the subjects studied.
Variables Group A N=23
Group B N=32
Group C
N=22 P-Value
Demographic and anthropometric data
Age (years) 70.26 (3.99) 69.96 (4.67) 68.59 (4.25) 0.38
Weight (kg) 72.94 (16.77) 65.18 (9.81) 63.45 (9.20) 0.02*
Height (m) 1.53 (0.04) 1.54 (0.06) 1.56 (0.06) 0.25
BMI (kg/m2) 30.88 (7.00) 27.27 (4.22) 25.93 (3.52) 0.01#*
Body composition
FM (kg) 31.38 (10.75) 25.91 (6.79) 23.81 (6.46) 0.01# *
% fat 42.27 (5.84) 39.37 (5.39) 37.22 (5.76) 0.01*
MM (kg) 39.43 (6.56) 37.30 (3.96) 37.58 (3.96) 0.25
LM (kg) 41.12 (6.75) 38.95 (4.10) 39.23 (4.14) 0.26
RAMM (kg) 2.08 (0.55) 1.85 (0.25) 1.93 (0.32) 0.09
LMM (kg) 13.12 (2.33) 12.30 (1.72) 12.50 (1.41) 0.26
Functional capacity and muscle strength
6minWT (m) 369.74 (57.62) 450.25 (12.32) 524.05 (44.49) 0.01#*+
HGS (Kgf) 21.82 (5.19) 22.07 (3.51) 25.59 (5.17) 0.01* +
KES (Kgf) 30.65 (10.90) 40.43 (12.55) 47.27 (10.08) 0.01#*
TUG (seg) 10.72 (2.60) 9.00 (1.09) 7.70 (0.99) 0.01#*+
BBS (0-56) 51.78 (3.56) 55.03 (0.99) 55.40 (1.05) 0.01#*
Muscle quality
AMQ 10.17 (3.77) 11.59 (2.01) 12.77 (2.26) 0.01*
LMQ 1.78 (0.99) 2.84 (0.98) 3.31 (0.77) 0.01#*
subjects conducted by Villareal et al.26, obesity
was found to be an important cause of physical dysfunction among the elderly, with almost all the obese subjects who were studied showing evidence of physical frailty. These results are in agreement with the results presented herein and support the notion that obesity can worsen the age-related decline in physical function for these individuals.
With regard to muscle quality, Group C showed better results. Strength was the determinant factor for better muscle quality since muscle mass was constant among the groups. Muscle quality has been previously described to demonstrate muscle strength in a more functional manner in relation to the quantity of muscle mass28.
Although the aging process involves a decline of muscle quality, the present study suggests that the increase of fat mass may also be associated with this decline, as elderly women with a larger amount of fat performed more poorly on tests of muscle strength and functional capacity.
Changes in body composition such as sarcopenic obesity, reduced lean mass and increased fat percentage negatively affect the health of elderly individuals, leading to an increased risk of disease and mortality. Although research on changes in body composition in the elderly began only recently, its association with other health-related variables, such as strength, muscle function and indices of quality of life, is important in order to identify frailty among older people29.
The 6MWT is a simple, low-cost and safe technique that is representative of daily activities. This test has been validated in various populations and is now extensively used to assess functional capacity in the elderly30. The scarcity of reference values for the 6MWT
in healthy subjects limits the interpretation of its results. However, according to Pires et al.10, the
variability of the test results among healthy elderly subjects can be explained by age, gender, height and weight.
In the present study, the level of physical activity was evaluated with the IPAQ, which showed that the elderly volunteers performed regular physical activity, suggesting that subjects’ practice of physical activity may account for, at least in part, the results regarding body balance and functional mobility. HGS was normalized according to the BMI (HGS/BMI), but the normalized values were not added to the table because they did not differ between the groups.
The muscle strength of the upper limbs was measured by the HGS test, a common measurement used in geriatric evaluation that is also used as a predictor of invalidity in the elderly31. According
to Giampaoli et al.32, the HGS test is relective of
global muscle strength and is used as an indicator of strength in the elderly. The strength of the lower limbs was measured by assessing bilateral knee extension strength (KES) using the 1-RM test. This practical and low-cost method is commonly used in large studies to determine muscle strength17. In the
present study, the elderly subjects who performed better on the KES test also performed better on the 6MWT, which requires good muscle performance of the legs. This result demonstrates that the observed variations in walking velocity can be explained by changes in muscle strength.
The combination of increased fat mass and reduced muscle mass leads to an accelerated decline of physical performance in the elderly. In addition, many other factors are related to the decline of independence of the elderly, such as comorbidities, the use of medications, life habits and level of physical activity. These factors should all be considered in evaluating the functional capacity of these individuals6,24,25.
A limitation of the present study was the restriction of the sample to the female gender, which limited the generalization of the results. In addition, due to the cross-sectional design of the study an association between body composition and physical function can
be identiied, but a cause-effect relationship cannot be determined. Thus, the present indings suggest that
changes in body composition, especially an increase in fat mass, are an important cause of functional decline in the elderly. The increased prevalence of obesity among the elderly may not affect the mortality rate for elderly subjects but may lead to a substantial increase in the number of elderly subjects with compromised physical function.
Despite the strong evidence of a relationship between increased body fat and problems related to physical performance, whether this association varies with age remains unknown. As such, studies analyzing the association between body fat and physical performance in study populations of different age ranges are needed to identify elderly groups that are more susceptible to functional decline in order to apply better intervention measures.
Conclusion
The group of elderly women who covered the shortest distance in the 6MWT had a higher BMI, a greater amount of fat mass and worse physical performance, suggesting that a high percentage
of body fat has a negative inluence on functional
performance, even in active elderly women. The present results also suggest that muscle quality is the best parameter of functionality since the high muscle mass in the group of elderly women with high
body fat was not suficient to maintain good strength
and performance in the functional tests.
References
1. Barbosa AR, Souza JMP, Lebrão ML, Laurenti R, Marucci MFN. Anthropometry of elderly residents in the city of São Paulo, Brazil. Cad Saúde Pública. 2005;21(6):1929-38. http://dx.doi.org/10.1590/S0102-311X2005000600043 2. Dufour AB, Hannan MT, Murabito JM, Kiel DP, McLean
RR. Sarcopenia deinitions considering body size and
fat mass are associated with mobility limitations: The Framingham study. J Gerontol A Biol Sci Med Sci. 2013 Feb;68(2):168-74. PMid:22503991. http://dx.doi. org/10.1093/gerona/gls109
3. Koster A, Stenholm S, Alley DE, Kim LJ, Simonsick EM,
Kanaya AM, et al. Body fat distribuition and inlamation
among obese older adults with na without metabolic syndrome. Obesity. 2010;18(12):2354-61. PMid:20395951 PMCid:3095947. http://dx.doi.org/10.1038/oby.2010.86 4. Cervi A, Franceschini SCC, Priore SE. Análise critica
do uso do índice de massa corporal para idosos. Rev Nutr. 2005;18(6):765-75. http://dx.doi.org/10.1590/ S1415-52732005000600007
5. Visser M, Kritchevsky SB, Goodpaster BH, Newman AB, Nevitt M, Stamm E, et al. Leg muscle mass and composition in relation to lower extremity performance in men and women aged 70 to 79: the health, aging and body composition study. J Am Geriatric Soc. 2002;50(5):897-904. http://dx.doi. org/10.1046/j.1532-5415.2002.50217.x
6. Bouchard DR, Beliaeff S, Dionne IJ, Brochu M. Fat mass but not fat free mass is related to physical capacity in well-functioning older individuals: nutrition as a determinant of successful aging (NuAge) — the Quebec Longitudinal Study. J Gerontol A Biol Sci Med Sci. 2007;62(2):1382-8. http://dx.doi.org/10.1093/gerona/62.12.1382
7. Clark BC, Manini TM. Sarcopenia Dynapenia. J Gerontol A Biol Sci Med Sci. 2008;63(8):829-34. http://dx.doi. org/10.1093/gerona/63.8.829
8. Carvalho J, Soares JMC. Envelhecimento e força muscular – breve revisão. Rev Port de Cien Desp. 2004;4(3):79-93.
9. Carmeli E, Imam B, Mersick J. The relationship of pre-sarcopenia (low muscle mass) and sarcopenia (loss of muscle strenght) with functional decline in individuals with intellectual disability (ID). Arch Gerontol
Geriatr. 2012;55:181-5. PMid:21764145. http://dx.doi. org/10.1016/j.archger.2011.06.032
10. Pires SR, Oliveira AC, Parreira VF, Britto RR. Teste de Caminhada de Seis Minutos em diferentes faixas etárias e índices de massa corporal. Rev Bras Fisioter. 2007;11(2):147-51. http://dx.doi.org/10.1590/ S1413-35552007000200010
11. American Thoracic Society Statement. Guidelines for the six minute walk test. Am J Respir Crit Care Med. 2002;166(1):111-7. PMid:12091180. http://dx.doi. org/10.1164/ajrccm.166.1.at1102
12. Rolland Y, Lauwers-Cances V, Pahor M, Fillaux J, Grandjean H, Vellas B. Muscle strength in obese elderly women: effect of recreational physical activity in a cross-sectional study. Am J Clin Nutr. 2004;79(4):552-7. PMid:15051596.
13. Brucki SM, Nitrini R, Caramelli P, Bertolucci PH, Okamoto IH. Suggestions for utilization of the mini-mental state examination in Brazil. Arq Neuropsiquiatr. 2003;61(3B):777-81. PMid:14595482. http://dx.doi.org/10.1590/S0004-282X2003000500014 14. Matsudo SMM, Matsudo VKR, Araújo TL, Andrade
DR, Andrade EL, Oliveira LC, et al. Nível de atividade física da população do Estado de São Paulo: análise de acordo com o gênero, idade, nível socioeconômico,
distribuição geográica e de conhecimento. Rev Bras Cienc
Mov. 2002;10(4):41-50.
15. Fess EE. Grip Strength. In: Casanova JS. Clinical Assessment Recommendations. Chicago: American Society of Hand Therapists; 1992. p. 41-5.
16. Kraemer WJ, Fry AC. Strength testing: development and evaluation of methodology. In: Maud P, Foster C.
Physiological assessment of human itness. Champaign:
Human Kinetics; 1995. p. 115-38.
17. Simão R, Lemos A, Viveiros LE, Chaves CPG, Polito MD. Força muscular máxima na extensão de perna uni e bilateral. Rev Bras Fisiologia do Exerc. 2003;2(1):47-57. 18. Monteiro WD, Simão R. Existe déficit bilateral na
realização de 10-Rm em exercícios de braços e pernas? Rev Bras Med Esporte. 2006;12(3):115-18. http://dx.doi. org/10.1590/S1517-86922006000300001
19. Pereira RI, Gomes SC. Testes de força e resistência
muscular: coniabilidade e predição de uma repetição
máxima – Revisão e novas evidências. Rev Bras Med Esporte. 2003;9(5):325-35. http://dx.doi.org/10.1590/ S1517-86922003000500007
20. Dias RMR, Cyrino ES, Salvador EP, Caldeira LFS,
Nakamura FY, Papst RR, et al. Inluência do processo de
familiarização para avaliação da força muscular em testes de 1-RM. Rev Bras Med Esporte. 2005;11(1):34-8. http:// dx.doi.org/10.1590/S1517-86922005000100004
21. Shimano T, Kraemer WJ, Spiering BA, Volek J, Hatield
DL, Silvestre R, et al. Relationship between the number of repetitions and selected percentages of one repetition maximum in free weight exercises in trained and untrained men. J Strength Cond Res. 2006;20(4):819-23. PMid:17194239.
quality in a well-functioning cohort of older adults: the health, aging and body composition study. J Am Geriatr Soc. 2003;51(3):323-30. http://dx.doi. org/10.1046/j.1532-5415.2003.51105.x
23. Miyamoto ST, Lombardi I Jr, Berg KO, Ramos LR, Natour J. Brazilian version of the Berg balance scale. Braz J Med Biol Res. 2004;37(9):1411-21. http://dx.doi.org/10.1590/ S0100-879X2004000900017
24. Sallinen J, Stenholm S, Rantanen T, Helioaara M, Sainio P, Koskinen S. Effect of age on the association between body fat percentage and maximal walking speed. J Nutr Health Aging. 2011;15(6):427-32. http://dx.doi.org/10.1007/ s12603-010-0140-8
25. Visser M, Goodpaster BH, Kritchevsky SB, Newman AB, Nevitt M, Rubin SM, et al. Muscle mass, Muscle
strength and Muscle fat iniltration as predictors of incident
mobility limitations in well-functioning older persons. J Gerontol A Biol Sci Med Sci. 2005;60(3):324-33. http:// dx.doi.org/10.1093/gerona/60.3.324
26. Villareal DT, Banks M, Siener C, Sinacore DR, Klein S. Physical frailty and body composition in obese elderly men and women. Obes Res. 2004;12(6):913-20. PMid:15229329. http://dx.doi.org/10.1038/oby.2004.111 27. Vasconcelos KSS, Dias JMD, Dias RC. Impacto do grau
de obesidade nos sintomas e na capacidade funcional de mulheres com osteoartrite de joelhos. Fisioter Pesqui. 2008;15(2):125-30. http://dx.doi.org/10.1590/ S1809-29502008000200003
28. Barbat-Artigas S, Rolland Y, Zamboni M, Aubertin-Leheudre M. How to assess functional status: a new muscle quality index. J Nutr Health Aging. 2011;15(6):1-11. 29. Silva LS Nº, Karnikowiski MGO, Tavares AB, Lima RM.
Association between Sarcopenia, Sarcopenia obesity, muscle strength and quality of variables in elderly women. Rev Bras Fisioter. 2012;16(5):360-67.
30. Enright PL, McBurnie MA, Bittner V, Tracy RP, McNamara R, Arnold A, et al. The 6-min walk test: a quick measure of functional status in elderly adults. Chest. 2003;123(2):387-98. http://dx.doi.org/10.1378/ chest.123.2.387
31. Cruz-Jentoft AJ, Baeyens JP, Bauer JM, Boirie Y, Cederholm T, Landi F, et al. Sarcopenia: European consensus on
deinition and diagnosis. Age Ageing. 2010;
39(4):412-23. PMid:20392703 PMCid:2886201. http://dx.doi. org/10.1093/ageing/afq034
32. Giampaoli S, Ferruci L, Cecchi F, Noce CL, Poce A, Dima F, et al. Hand-grip strength predicts incident disability in non-disabled older men. Age Ageing. 1999; 28(3): 283-8. http://dx.doi.org/10.1093/ageing/28.3.283
Correspondence
Karla Helena Coelho Vilaça
SGAN 916 Módulo B, Av. W5 Norte, Sala A-134, Asa Norte CEP 70790-160, Brasília, DF, Brasil