Artificial neural networks classify cotton
genotypes for fiber length
Luiz Paulo de Carvalho
1, Paulo Eduardo Teodoro
2*, Lais Mayara
Azevedo Barroso
3, Francisco José Correia Farias
1, Camilo de
Lellis Morello
1and Moysés Nascimento
3Abstract: Fiber length is the main trait that needs to be improved in cotton.
However, the presence of genotypes x environments interaction for this trait can hinder the recommendation of genotypes with greater length fibers. The aim of this study was to evaluate the adaptability and stability of the fibers length of cotton genotypes for recommendation to the Midwest and Northeast, using arti -ficial neural networks (ANNs) and Eberhart and Russell method. Seven trials were carried out in the states of Ceará, Rio Grande do Norte, Goiás and Mato Grosso do Sul. Experimental design was a randomized block with four replications. Data were submitted to analysis of adaptability and stability through the Eberhart & Russell and ANNs methodologies. Based on these methods, the genotypes BRS Aroeira, CNPA CNPA 2009 42 and CNPA 2009 27 has better performance in unfavorable, general and favorable environment, respectively, for having fiber length above the overall mean of environments and high phenotypic stability.
Key words: Genotype x environment interaction, artificial intelligence, Gossypium
hirsutum.
Crop Breeding and Applied Biotechnology 18: 200-204, 2018 Brazilian Society of Plant Breeding. Printed in Brazil http://dx.doi.org/10.1590/1984-70332018v18n2n28
NOTE
*Corresponding author:
E-mail: [email protected]
Received: 08 November 2015 Accepted: 22 August 2016
1 Centro Nacional de Pesquisa de Algodão
(CNPA), Embrapa Algodão, 58.428-095, Campina Grande, PB, Brazil
2 Universidade Federal de Mato Grosso do Sul
(UFMS), Campus de Chapadão do Sul, 79.560-000, Chapadão do Sul, MS, Brazil
3 Universidade Federal de Viçosa (UFV),
Departamento de Estatística, 36.570-900, Viçosa, MG, Brazil INTRODUCTION
Due to wide diversity of cultivation of upland cotton (Gossypium hirsutum L.r. latifolium Hutch.), which currently covers two regions (Midwest and Northeast) in Brazil, it is of great importance to investigate the magnitude of genotype x environment interaction for choosing the best strategy of selection and recommendation of cultivars (Farias et al. 2016). In this sense, some studies have been conducted aiming at selecting cotton genotypes as the technological fibers properties, particularly the fiber length, main trait to be improved (Carvalho et al. 2016). Several methods are used, among them GGE biplot and Eberhart and Russel (1966) based on liner regression (Ng et al. 2013, Carvalho et al. 2015a).
Among the aforementioned methods, due to easy application, Eberhart and Russel (1966) is still widely used. However, in studies where the number of evaluated environments is small (n<6), applying the method is not interesting, since the number of information used for decision-making regarding the genotype adaptability is relatively small.
acquiring knowledge through experience. In practice, this knowledge may be derived from actual variables or even observations from magnification (simulation) of the original data set.
Aiming to use jointly the advantages of ANNs and the methodology proposed by Eberhart and Russel (1966), Nascimento et al. (2013) used artificial neural networks (ANNs) for alfalfa genotypes classification in accordance with Eberhart and Russell (1966). In the proposal, genotypes belonging to classes of adaptability and phenotypic stability defined by Eberhart and Russell (1966) are simulated. Subsequently, simulated genotypes are used in training and validation of the neural networks. Thus, by trained ANNs, the evaluation of genotypes for stability and phenotypic adaptability is not only performed based on genotypes studied, but by a large collection of simulated genotypes according to predefined classes (Nascimento et al. 2013).
One of the main traits that still need to be improved in the cotton is the fiber length. Practically 100% of the upland cotton production in Brazil is classified as medium-sized fibers (Carvalho et al. 2015b). Average cotton length produced in Brazil in 2013 was 28 mm, with few reports about fibers production superior to 32 mm (Carvalho et al. 2015a). For this reason, it is important for breeding programs to select genotypes with greater fiber length in order to meet future demands. Carvalho et al. (2015b), when assessing cotton genotypes in seven environments, they found the presence of complex genotype × environments for the trait fiber length. This hampers genotypes recommendation because there is variation in the ordering of genotypes over the evaluated environments.
In this regard, the use of recent methodologies such ANNs may increase the accuracy in the selection of cotton genotypes with greater fiber length. Given the above, this study aimed to evaluate the adaptability and stability of the fiber length in cotton genotypes for recommendation for the Midwest and Northeast regions using artificial neural networks (ANNs) and Eberhart and Russel method.
MATERIAL AND METHODS
Seven trials were conducted at the states of Ceará - CE, Rio Grande de Norte - RN, Goiás - GO and Mato Grosso do Sul - MS. Two trials were conducted at Barbalha - CE, during 2010 and 2011, cultivated in the dry season and irrigated by furrow over the entire cycle; two at Apodi - RN, in the same years, cultivated during the rainy season, but with three additional irrigation of 15 mm each, due to the drought that occurred in the region; one at Ipanguassú - RN, irrigated by sprinkling over the entire cycle; one at Itaquiraí - MS and other at Santa Helena - GO, both in unirrigated conditions.
Nine brown color fiber lines and two witnesses were used (‘BRS Rubi’, dark brown fiber cultivar and ‘BRS Aroeira’, white fiber). The trials were conducted in a randomized block design with four replications. Each plot consisted of two rows of 5.0 m spaced at 1.0 m. At harvest, we collected 20 bolls from each plot for measuring the fiber length (mm) using HVI (High Volume Instrument).
Data of length fibers were subjected to individual analysis of variance, having been considered the effect of treatments as fixed and blocks as random. Homogeneity of variances was detected by the likelihood ratio test. Subsequently, the data were submitted to the adaptability and stability analysis through Eberhart and Russell (1966) and ANNs methodologies.
Methodology proposed by Eberhart and Russell (1966) is based on linear regression analysis, which measures the response of each genotype opposite to environmental variations. Thus, for an trial with g genotypes, e environments and r repetitions, we define the following statistical model 1: Yij = ϐ0i + ϐ1iIj + Ψij wherein Yij is the mean of the i genotype
at j environment; ϐ0i is the linear coefficient of the i-th genotype; ϐ1i is the regression coefficient that measures the of the i-th genotype response to changes in the j environment; Ij is defined as environmental index Ij = ΣjYj
g ‒
ΣiΣjYij ge
; Ψij are random errors, in which each component can be decomposed as: Ψij = δij + ε̅ij, with δij being the regression deviation and ε̅ij the mean experimental error.
Estimators of adaptability and stability parameters are respectively given by: ϐ�1i = ΣjYij Σj I
2
j
and σ�2
di = MSD
i‒MSR
r , wherein MSDi is the mean square of deviations of the i genotype; MSR is the mean square of residue; and r is the
number of repetitions. The hypotheses of interest are H0: ϐ1
i = 1 versus H0: ϐ1i ≠ 1 and H0: σ�
2
di = 0 versusH0: σ�
2
of genotypes by ANNs, two data set are required, which are the training and the testing set. To obtain these data set according to the classes defined in Table 1, length fiber data from 1,500 genotypes were simulated with the function train.net on R software (R Development Core Team 2015), according to statistical model 1, evaluated at 7 environments (Table 1). Parameter values used to obtain the genotypes classes 1, 2, and 3 (Table 2), each consisting of 500 genotypes, were: Class 1: ϐ0i = X̅G'ϐ1i~ U[0.90; 1.10] and σ�
2
Ψ = 250, i.e., ϐ1i will be considered equal to 1 if ϐ1i ϵ [0.90; 1.10]; Class 2:
ϐ0i = X̅G'ϐ1
i~ U[1.11; 2.00] and σ�
2
Ψ = 250, i.e., ϐ1i will be considered equal to 1 if ϐ1i ϵ [1.11; 2.00]; Class 3: ϐ0i = X̅G'ϐ1
i~ U[0.00; 0.89] and σ�
2
Ψ = 250, i.e., ϐ1i will be considered equal to 1 if ϐ1i ϵ [0.00; 0.89]. In addition, U [a; b] is the continuous uniform probability distribution with parameters a and b. In order to obtain the remaining three classes (4, 5 and 6), aiming to linearize the set of values, the simulated values were transformed into a logarithmic scale, i.e., for classes 4, 5 and 6, we have σ�2
Ψ = 250. Thus, in the same manner as in Finlay and Wilkinson (1963), the concept of stability was linked to the genotypes capacity for presenting a predictable response according to the environment stimulus.
According to Nascimento et al. (2013), after obtaining 3000 genotypes, which represented the six classes, data set was partitioned into two, namely the training set and testing set. ANN training set was composed of 2,400 genotypes and was obtained by randomly selection of 400 genotypes within each class. Testing set was composed of the remaining 600 genotypes, which consisted of 100 from each class, and was used to test the network.
ANN used in this study, which were denoted by back-propagation hidden layer, it is described in Nascimento et al. (2013). After the step of ANN training and testing, where a maximum error of 2% for the test set was considered, cotton data set was presented to the ANN for classification. Classification as to the adaptability and phenotypic stability was performed according to Table 2. For comparison purposes, evaluation of the adaptability and stability of genotypes was also carried out by the methodology proposed by Eberhart and Russell (1966). Agreement between the methodologies used to adaptability and stability was verified by the coincidence coefficient (equal classification of genotypes by both methodologies in relation to the total number of genotypes). ANN used was implemented on the software R (R Development Core Team 2015) using the codes available at http://www.det.ufv.br/~moyses/links.php. For obtaining the results found by the Eberhart and Russell (1966), we used Genes software (Cruz 2013).
RESULTS AND DISCUSSION
In the joint analysis (Table 2), all effects were significant (P≤0.05), which indicates contrasts between the environments and the occurrence of differential genotypes response forward to environmental effects. The existence of significant genotype x environment interactions for fibers length indicates that occurs differential expression of genes governing this trait according to environmental variations and the need to employ the stability analysis to select cotton genotypes to be recommended for Midwest and Northeast Brazil. Studies which the presence or absence of genotype × environment interaction was evaluated for length fibers are scarce in the literature. However, similar
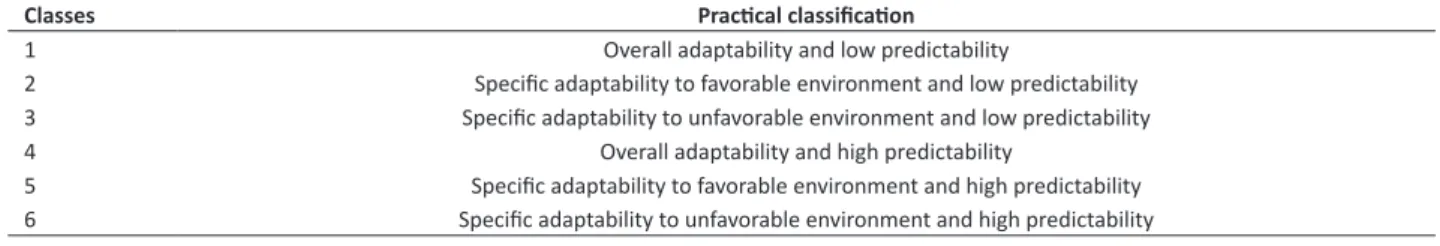
Table 1. Classes of genotypes by Eberhart and Russell (1966) methodology. Practical classification
Classes Practical classification
1 Overall adaptability and low predictability
2 Specific adaptability to favorable environment and low predictability 3 Specific adaptability to unfavorable environment and low predictability
4 Overall adaptability and high predictability
5 Specific adaptability to favorable environment and high predictability 6 Specific adaptability to unfavorable environment and high predictability
Table 2.Summary of joint analysis of variance for fiber length, in mm, of 11 cotton genotypes, evaluated in seven environments in Brazil
Sources of variation Degrees of freedom Means square
Blocks/Environments 21 75.55
Genotypes 10 41.39*
Environments 6 69.05*
Genotypes × Environments 60 2.22*
Error 210 0.80
Mean - 27.06
Coefficient of variation (%) - 3.26
results were obtained by Campbell and Jones (2005), Joy et al. (2012), Ng et al. (2013), Carvalho et al. (2015b) and Carvalho et al. (2015c), who also found significant diferences for effects of genotypes, environments and genotype × environment interaction for this trait.
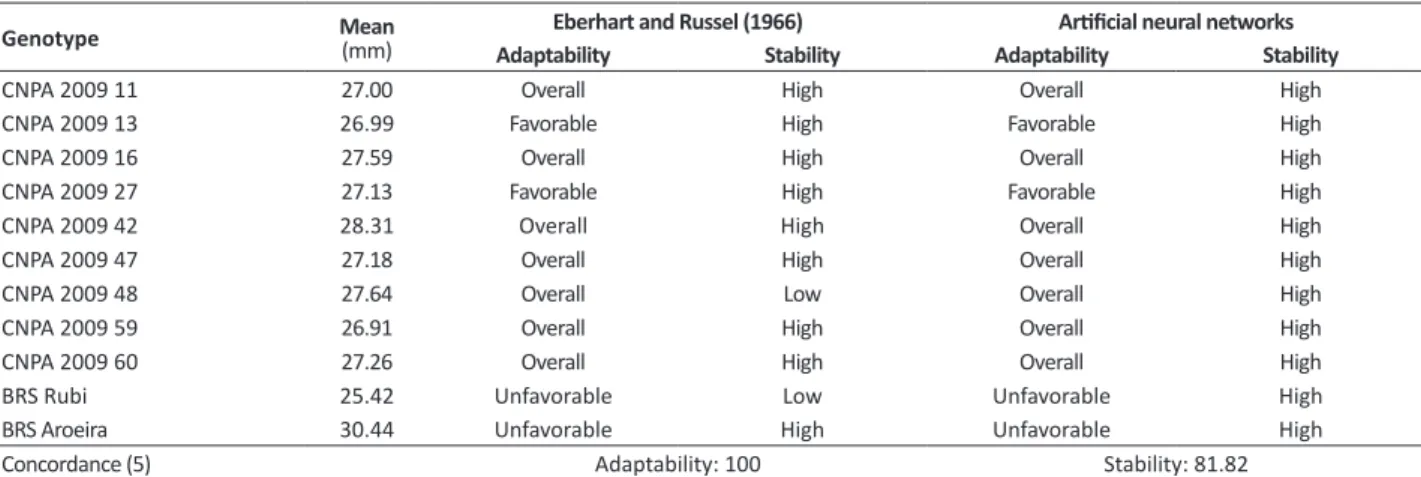
The genotype BRS Aroeira had the highest overall mean for the fiber length (30.44 mm) and high phenotypic stability and adaptability to favorable environment for both approaches. This information is relevant for the cotton industry, because despite its high overall mean, this genotype does not respond to improvement of the environment and should be considered as an option for unfavorable locations in the Midwest and Northeast. According to Carvalho et al. (2015b), BRS Aroeira also stands out for having high uniformity, strength and maturity of the fiber, in addition to low rate of short fibers.
The genotype CNPA 2009 27 showed fiber length (27.13 mm) above the overall mean, high stability and adaptability to favorable environment for both approaches. This genotype is the most suitable for cotton farmers that employ a high technological level because it has high responsiveness to improved environments. According to both methods, CNPA 2009 42 can be considered as the ideal genotype for cultivation in the Midwest and Northeast, since it obtained fiber length (28.42 mm) above the overall mean, high stability and high adaptability. Thus, its use in unfavorable environments will not significantly reduce the fiber length, but when grown in favorable environments, an increase in the fiber length is expected.
It is important to mention that there was 100% agreement between Eberhart and Russel (1966) and ANNs regarding discrimination of phenotypic adaptability of cotton genotypes (Table 3). As for the phenotypic stability, there was similarity of 81.82% in the classification of genotypes, probably because in the ANN the stability is based on the concept of Finlay and Wilkinson (1963), which differs from the Eberhart and Russel (1966) methodology, which considers stability as invariance and no predictability. Similar results were obtained by Nascimento et al. (2013), Teodoro et al. (2015) and Correa et al. (2016), who verified agreement over 80% between Eberhart and Russell (1966) and ANNs for the adaptability and phenotypic stability of alfalfa, cowpea and common bean genotypes, respectively.
Due to the high concordance rates between the evaluated methodologies, ANNs can be considered an effective alternative to measure the adaptability and phenotypic stability of genotypes in breeding programs. Furthermore, because of its nonlinear structure, ANNs can capture the more complex features from the data set and do not require detailed information about the process to be modeled due to its self-learning (Haykin 2009).
Table 3. Mean fiber length (mm) and classification of 11 cotton genotypes as the adaptability and phenotypic stability, evaluated in seven environments in Brazil, by Eberhart and Russel (1966) and artificial neural networks methodologies
Genotype Mean(mm) Eberhart and Russel (1966) Artificial neural networks Adaptability Stability Adaptability Stability
CNPA 2009 11 27.00 Overall High Overall High
CNPA 2009 13 26.99 Favorable High Favorable High
CNPA 2009 16 27.59 Overall High Overall High
CNPA 2009 27 27.13 Favorable High Favorable High
CNPA 2009 42 28.31 Overall High Overall High
CNPA 2009 47 27.18 Overall High Overall High
CNPA 2009 48 27.64 Overall Low Overall High
CNPA 2009 59 26.91 Overall High Overall High
CNPA 2009 60 27.26 Overall High Overall High
BRS Rubi 25.42 Unfavorable Low Unfavorable High
BRS Aroeira 30.44 Unfavorable High Unfavorable High
Concordance (5) Adaptability: 100 Stability: 81.82
REFERENCES
Campbell BT and Jones MA (2005) Assessment of genotype x environment interactions for yield and fiber quality in cotton performance trials.
Euphytica144: 69-78.
Carvalho LP, Farias FJC and Rodrigues JIS (2015a) Selection for increased fiber length in cotton progenies from Acala and Non-Acala types.
Crop Science55: 1-7.
This is an Open Access article distributed under the terms of the Creative Commons Attribution License, which permits unrestricted use, distribution, and reproduction in any medium, provided the original work is properly cited.
African Journal of Agricultural Research 10: 4882-4887.
Carvalho LP, Salgado CC, Farias FJC and Carneiro VQ (2015c) Estabilidade e adaptabilidade de genótipos de algodão de fibra colorida quanto
aos caracteres de fibra. Ciência Rural 45: 598-605.
Carvalho LP, Farias FJC, Morello CL and Teodoro PE (2016) Selection of
cotton genotypes for greater length of fibers. Crop Breeding and
Applied Biotechnology 16: 340-347.
Correa AM, Teodoro PE, Gonçalves MC, Barroso LMA, Nascimento M, Santos A and Torres FE (2016) Artificial intelligence in the selection
of common bean genotypes with high phenotypic stability. Genetics
and Molecular Research 15: 1-7.
Cruz CD (2013) GENES - a software package for analysis in experimental
statistics and quantitative genetics. Acta Scientiarum. Agronomy
35: 271-276
Eberhart SA and Russell WA (1966) Stability parameters for comparing
varieties. Crop Science 6: 36-40.
Farias FJC, Carvalho LP, Silva Filho JL and Teodoro PE (2016) Biplot analysis of phenotypic stability in upland cotton genotypes in Mato Grosso.
Genetics and Molecular Research 15: 1-9.
Finlay KW and Wilkinson GN (1963) The analysis of adaptation in a
plant-breeding programme. Australian Journal of Agricultural Research
14: 742-754.
Haykin S (2009) Neural networks and learning machines. 3rd edn, Prentice
Hall, New Jersey, 936p.
Joy K, Smith CW, Hequet E, Hughs E and Hague S (2012) Extra long staple
upland cotton for the production of superior yarns. Crop Science
52: 2089-2096.
Nascimento M, Peternelli LA, Cruz CD, Nascimento ACC, Ferreira RP, Bhering LL and Salgado CC (2013) Artificial neural networks for
adaptability and stability evaluation in alfalfa genotypes. Crop
Breeding and Applied Biotechnology 13: 152-156.
Ng EH, Jernigan K, Smith W, Hequet E, Dever J, Hague S and Ibrahim AMH
(2013) Stability Analysis of upland cotton in Texas. Crop Science
53: 1-9.
R Development Core Team (2015) R: a language and environment for
statistical computing. R Foundation for Statistical Computing, Vienna. Available at <http://www.R- project.org>. Accessed on April 15, 2015. Teodoro PE, Barroso LMA, Nascimento M, Torres FE, Sagrilo E, Santos A and Ribeiro LP (2015) Redes neurais artificiais para identificar genótipos de feijão-caupi semiprostrado com alta adaptabilidade
e estabilidade fenotípicas. Pesquisa Agropecuária Brasileira 50: