Selection of cotton genotypes for greater length
of fibers
Luiz Paulo de Carvalho
1, Francisco José Correia Farias
1, Camilo
de Lellis Morello
1and Paulo Eduardo Teodoro
2*Abstract: In cotton breeding programs, it is necessary to identify genotypes
with predictable behavior on the length of fibers, and which are responsive to environmental variations, in specific or broad conditions. The aim of this study was to employ the methodology of mixed models for simultaneous selection of cotton genotypes with greater length of fibers, adaptability and stability. It was evaluated 36 lines in three trials located in Apodi (2013 and 2014) and Santa Helena (2013,) in a randomized block design with two replications. Genetic parameters were estimated by the restricted maximum likelihood/best linear unbiased predictor method (REML/BLUP) and the selection was based on the method of harmonic mean of the relative performance of genetic values. The genotypes CNPA 2012-55, CNPA 2012-58, CNPA 2012-62 and CNPA 2012-64 can be grown in all tested environments, since they gather greater length of fibers, stability and adaptability.
Key words: BLUP/REML, genetic parameters, Gossypium hirsutum L.r. latifolium
Hutch.
Crop Breeding and Applied Biotechnology 16: 340-347, 2016 Brazilian Society of Plant Breeding. Printed in Brazil
http://dx.doi.org/10.1590/1984-70332016v16n4n50 NOTE
*Corresponding author: E-mail: eduteodoro@hotmail.com
Received: 02 June 2015 Accepted: 04 June 2016
1 Embrapa Algodão, Centro Nacional de
Pesquisa de Algodão, 58.428-095, Campina Grande, PB, Brazil
2 Universidade Federal de Viçosa,
Departa-mento de Biologia Geral, 36.571-000, Viçosa, MG, Brazil
INTRODUCTION
Upland cotton (Gossypium hirsutum L.r. latifolium Hutch.) produces one of the most important textile fiber of the world, and offers various utility products with great relevance in the Brazilian and the world’s economy (Carvalho et al. 2015a, Menezes et al. 2015, Morello et al. 2015). However, changes in spinning technology, competition with synthetic fibers, and the globalization of cotton production and textile products increase the demand for higher quality fiber, making the length of fiber one of the main traits to be improved (Smith et al. 2008, Carvalho et al. 2016).
Genotype x environment interaction (G x E) is one of the greatest challenges in plant breeding, both in the selection procedures and in the recommendation of cultivars, and plant breeders usually look for stable genotypes with improved performance in relation to a particular trait (Ramalho et al. 2012, Cruz et al. 2014). Studies on G x E interaction in cotton are scarce in Brazil, and in total, these studies evaluate fiber yield, not the length (Suinaga et al. 2006, Souza et al. 2006, Silva Filho et al. 2008, Farias et al. 2016 a, b).
in specific or broad conditions (Farias et al. 2016b). Therefore, selection methods that incorporate stability and adaptability in a single statistics can be considered superior, when compared with those which use only yield as selection criteria (Resende 2007).
The analysis carried out by the method of mixed models was proposed to perennial crops, such as pine (Resende et al. 1996), and its application has been spread in the analysis of information on several crops, both perennial and annual. REML (Restricted Maximum Likelihood) estimates variance components required by the model, and BLUP (Best Linear Unbiased Prediction) estimates the genotypic value (Resende 2007).
The use of mixed models allows ranking the genotypes taking into consideration, simultaneously, their genetic values (estimated trait) and stability (Rosado et al. 2012). The lower the standard deviation of genotypic behavior across sites, the greater is the harmonic mean of their genotypic values (HMGV) across sites. Thus, selection by the greatest HMGV values implies simultaneously in the selection for the evaluated trait and stability. In terms of adaptability, a statistics used in the context of mixed models refers to the relative performance of genotypic values (RPGV) across the environments. In this case, the predicted genotypic values (or the original data) are expressed as a proportion of overall mean of each location, and then, the mean value of this proportion across sites is obtained (Carbonell et al. 2007, Resende 2007).
The simultaneous selection of cotton genotypes with greater length of fibers, stability and adaptability, under the approach of mixed models, can be accomplished by the method of the harmonic mean of the relative performance of genetic values (HMRPGV) predicted. Carbonell et al. (2007) report the main advantages of this method: to provide estimates of adaptability and genotypic stability, whose breeding values are penalized by instability; to generate results in their own magnitude or scale of the evaluated trait, facilitating the recommendation of genotypes; to analyze unbalanced and not orthogonal designs; to analyze heterogeneous variances; to allow errors correlated within sites.
Thus, HMGV, RPGV and HMRPGV have been used as measures for the interpretation of genotypic stability and adaptability of crops, such as common bean (Carbonell et al. 2007), sugarcane (Bastos et al. 2007), cashew (Maia et al. 2009), eucalyptus (Rosado et al. 2012), rice (Regitano Neto et al. 2013), and cowpea (Torres et al. 2015, Torres et al. 2016). However, they have not been used for breeding purposes in cotton. The aim of this study was to employ the mixed models methodology for simultaneous selection of cotton genotypes with greater length of fibers, adaptability and stability.
MATERIAL AND METHODS
It was evaluated lines derivative from cross between Guazuncho2 with Acala SJ4 of long fiber. Seeds were advanced from F2 to F4. The genealogical selection procedure was used from the F4 generation. In the latest generation, it was obtained 271 F4 plants, and of these, 51 F4:5 plants were selected with length ≥ 31 mm. Subsequently, in a greenhouse, it was selected 34 F5:F6 lines with length ≥ 32 mm, which were evaluated and analyzed by Carvalho et al. (2015b). In
the remaining lines, it was selected only those with length ≥ 32 mm. These lines were evaluated in three trials located in Apodi-RN (under irrigation), in 2013 and 2014, and in Santa Helena-GO (without irrigation), in 2013, in a randomized block design with two replications.
The plot consisted of two 5m rows, spaced 0.80 m, totaling 60 plants per row. Cultural practices were normal for cotton crop, with the use of herbicide for weed control. Pest control was carried out according to the integrated management of pests recommended for the crop in the region. Length of fibers was evaluated in samples with 20 bolls per plot, using the High volume instrument device (HVI) of the Fibers Laboratory of Embrapa Algodão.
The adjusted model was obtained from the mixed model equations: , in
which , in which: corresponds to broad-sense individual
heritability in the block; is the coefficient of determination of the effects of genotype x environment
interaction; σˆ 2g is the genotypic variance; σˆ 2c is the variance of genotype x environment interaction; σˆ 2e is the residual
variance between plots; is the genotypic correlation of genotypes across the environments.
Estimators of the variance components obtained by REML procedure via Expectation-Maximization algorithm (EM)
are: ; ; , in which: C22 and C33 come from
, in which C is the coefficient matrix of the mixed model equations; tr is
the operator matrix trace; r(x) is the rank of the matrix X; N, q, s are the total number of data, the number of genotypes, and the number of genotype x environment combinations, respectively.
By using this model, it was obtained empirical BLUP predictors (eBLUP or REML/BLUP) of the genotypic values free of interaction, given by μˆ + gˆi , in which μˆ is the mean of all environments, and gˆi is the genotypic effect free of genotype
x environment interaction. For each environment j, genotypic values (Vg) are predicted by μˆ + gˆi + (gˆe)ij , in which μˆj is
the mean of the environment j; gˆi is the genotypic effect of genotype i on the environment j; and (gˆe)ij is the effect of
genotype x environment interaction in relation to the genotype i.
Prediction of genotypic values that capitalize the mean interaction in different environments is given by μˆj + gˆi + gˆem,
and is calculated by: , in which μˆ is the overall mean of all environments; n is the number of environments;
and gˆi is the genotypic effect of the genotype i.
Harmonic mean values of the genotypic values (HMGV) for stability evaluation were obtained by the equation: , in which: n is the number of environments (n = 3) in which the genotype i was evaluated; Vgij is
the expression: , in which Mj is the mean of the fiber length in the environment j. Joint selection
simultaneously considering seed length of fibers, stability and adaptability is given by the statistical harmonic mean of the relative performance of genotypic values predicted (HMRPGV): (Resende 2007). Thus,
the genotypes with greater HMRPGV are those that simultaneously present greater length of fibers, adaptability and genotypic stability in the environments evaluated in this study.
RESULTS AND DISCUSSION
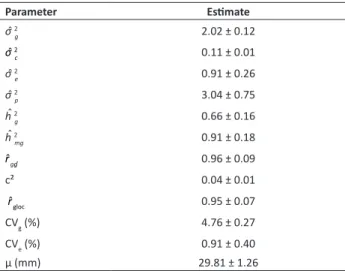
Coefficient of experimental variation (CVe) was 3.20% (Table 1), which is lower than those of other studies carried out
with the cotton crop (Carvalho et al. 2015b, Carvalho et al. 2015c, Hoogerheide et al. 2007), which indicates excellent experimental precision. In another interpretation, the value obtained for CVg (4.76%) indicates that a considerable fraction of MSgenotypes was extracted from MStotal. Joint evaluation of CVg and CVe is reflected in the statistics rˆggˆ (Resende and Duarte 2007). The accuracy obtained (96%) shows excellent experimental quality, and thus safety and credibility in the selection of superior genotypes for the trait length of fibers.
Heritability of the genotypes means (hˆ 2
mg) is estimated when using means of the blocks as evaluation and/or selection
criteria (Resende 2007). Thus, in the face of the values obtained (0.91), there is reliability in the selection of elite cotton genotypes, based on the predicted genotypic values. In the estimate of the broad-sense individual heritability (hˆ 2
g), the
total genetic dispersion is considered, which is relevant since in this research it was sought to explore all the genetic variance between cotton progenies. The variance of the genotypic effects (σˆ 2g) presented magnitude highly greater than
the variance of the effects of G x E interaction (σˆ 2c), constituting 66% of the total phenotypic variability, represented by
the heritability of individual plots (hˆ 2
g). Results with similar magnitude were observed by Maia et al. (2009), Rosado et
al. (2012) and Laviola et al. (2012), when estimating genetic parameters via REML/BLUP in cashew clones, eucalyptus and jatropha, respectively.
Due to the greater or lesser degree of adaptability/ genetic stability of individuals, the variance of the G x E interaction (σˆ 2c) can inflate the phenotypic expression of
a trait (Bastos et al. 2007). This measure quantifies the fraction of the total variation due to the G x E interaction. Small magnitude estimates of σˆ 2c indicates that the G x E
interaction little influences on phenotypic value (Maia et al. 2009). In this context, a genotype with greater length of fibers in an environment tends to maintain the same level in different environments, since this genotype responds favorably to environmental influences (high correlation between genotypic values across the sites), in addition to have high predictability in the face of environmental changes. Estimates of σˆ 2c can be considered low, corresponding to
3.61% of the total phenotypic variability, which favors the achievement of extremely high phenotypic correlation (rˆ
gloc=0.95) among the environments.
Phenotypic value corresponds to the values obtained in the field evaluations, which are influenced by genotypic effect and effect of G x E interaction. In the latter, the sum of the genotypic variance, of the residual variance between plots, and of the variance of the G x E interaction results in
Table 1. Estimates of variance components (individual REML) for length of fiber in 36 cotton genotypes evaluated in three environments
Parameter Estimate
σˆ 2g 2.02 ± 0.12
σˆ 2c 0.11 ± 0.01
σˆ 2e 0.91 ± 0.26
σˆ 2p 3.04 ± 0.75
hˆ 2
g 0.66 ± 0.16
hˆ 2
mg 0.91 ± 0.18
r
ˆggˆ 0.96 ± 0.09
c² 0.04 ± 0.01
rˆgloc 0.95 ± 0.07
CVg (%) 4.76 ± 0.27
CVe (%) 0.91 ± 0.40
μ (mm) 29.81 ± 1.26
σˆ 2g: genotypic variance; σˆ 2c: variance of genotype x environment interaction; σˆ
2 e: residual variance between plots; σˆ 2p: individual phenotypic variance; hˆ 2g:
broad-sense individual heritability; hˆ 2
mg: mean of genotype heritability; rˆggˆ: accuracy in
the selection of genotypes; c²: coefficient of determination of effects of the genotype x environment interaction; rˆgloc: genotypic correlation across the environments; CVg:
individual phenotypic variance (σˆ 2f) . Although the residual dispersion between plots (σˆ 2e) represents 30.13% of this value,
significant genetic progress was achieved. Results in similar magnitude were observed by Maia et al. (2009), Rosado et al. (2012), in which it was evaluated the effects of G x E interaction on cashew and eucalyptus clones, respectively, via mixed models, it was found that the residual variance between plots represented 66.58% of the individual phenotypic variance (the two works had the same ratio between the variances).
The mean genotypic correlation of the genetic material performance across the environment (rˆ
gloc) indicates the ranking reliability of the best genotypes in the tested environments. In general, small changes were observed in the ranking of genotypes, due to the high magnitude of rˆ
gloc (0.95), and due to the high rˆggˆ (0.96). This indicates the occurrence of simple fraction of G x E interaction, favoring the selection of genotypes with broader adaptation.
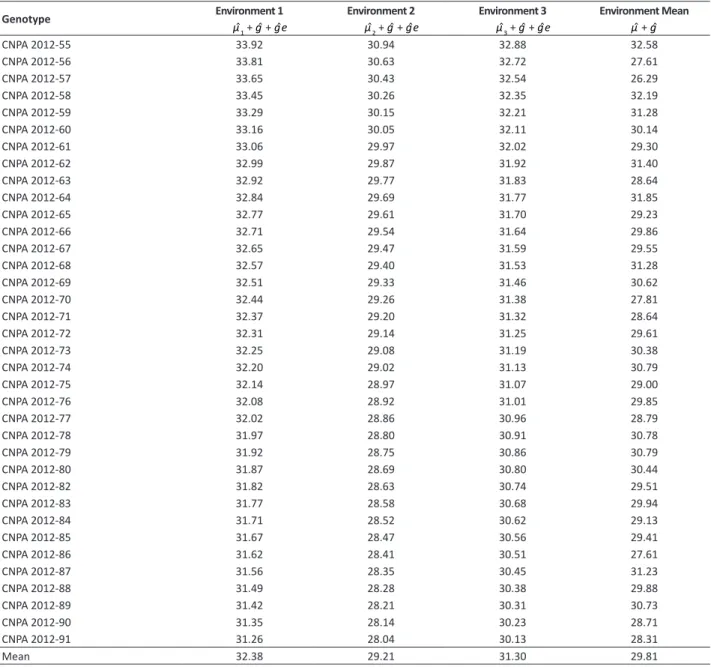
The genotypes CNPA 2012-55, CNPA 2012-58, CNPA 2012-62 and CNPA 2012-64 showed the best gain estimates with
Table 2. Estimates of genotypic values for length of fiber in 36 cotton genotypes evaluated in three environments and for average environment
Genotype Environment 1 Environment 2 Environment 3 Environment Mean
μˆ1 + gˆ + gˆe μˆ2 + gˆ + gˆe μˆ3 + gˆ + gˆe μˆ + gˆ
CNPA 2012-55 33.92 30.94 32.88 32.58
CNPA 2012-56 33.81 30.63 32.72 27.61
CNPA 2012-57 33.65 30.43 32.54 26.29
CNPA 2012-58 33.45 30.26 32.35 32.19
CNPA 2012-59 33.29 30.15 32.21 31.28
CNPA 2012-60 33.16 30.05 32.11 30.14
CNPA 2012-61 33.06 29.97 32.02 29.30
CNPA 2012-62 32.99 29.87 31.92 31.40
CNPA 2012-63 32.92 29.77 31.83 28.64
CNPA 2012-64 32.84 29.69 31.77 31.85
CNPA 2012-65 32.77 29.61 31.70 29.23
CNPA 2012-66 32.71 29.54 31.64 29.86
CNPA 2012-67 32.65 29.47 31.59 29.55
CNPA 2012-68 32.57 29.40 31.53 31.28
CNPA 2012-69 32.51 29.33 31.46 30.62
CNPA 2012-70 32.44 29.26 31.38 27.81
CNPA 2012-71 32.37 29.20 31.32 28.64
CNPA 2012-72 32.31 29.14 31.25 29.61
CNPA 2012-73 32.25 29.08 31.19 30.38
CNPA 2012-74 32.20 29.02 31.13 30.79
CNPA 2012-75 32.14 28.97 31.07 29.00
CNPA 2012-76 32.08 28.92 31.01 29.85
CNPA 2012-77 32.02 28.86 30.96 28.79
CNPA 2012-78 31.97 28.80 30.91 30.78
CNPA 2012-79 31.92 28.75 30.86 30.79
CNPA 2012-80 31.87 28.69 30.80 30.44
CNPA 2012-82 31.82 28.63 30.74 29.51
CNPA 2012-83 31.77 28.58 30.68 29.94
CNPA 2012-84 31.71 28.52 30.62 29.13
CNPA 2012-85 31.67 28.47 30.56 29.41
CNPA 2012-86 31.62 28.41 30.51 27.61
CNPA 2012-87 31.56 28.35 30.45 31.23
CNPA 2012-88 31.49 28.28 30.38 29.88
CNPA 2012-89 31.42 28.21 30.31 30.73
CNPA 2012-90 31.35 28.14 30.23 28.71
CNPA 2012-91 31.26 28.04 30.13 28.31
selection in all environments (Table 2). The genetic gains obtained with the selection of the genotypes were respectively: 19.29, 17.96, 15.78 and 14.98%. These genotypic values can also be considered for recommendation of these genotypes, which were selected in other environments with standard G x E interaction similar to those observed in this study. According to Maia et al. (2009), this is because the method of mixed models penalizes predicted genotypic values. Thus, the same behavior of the genetic means (μˆ + gˆ) of the length of fiber is expected, when the aforementioned genotypes
are subjected to environments with characteristics similar to those of this study.
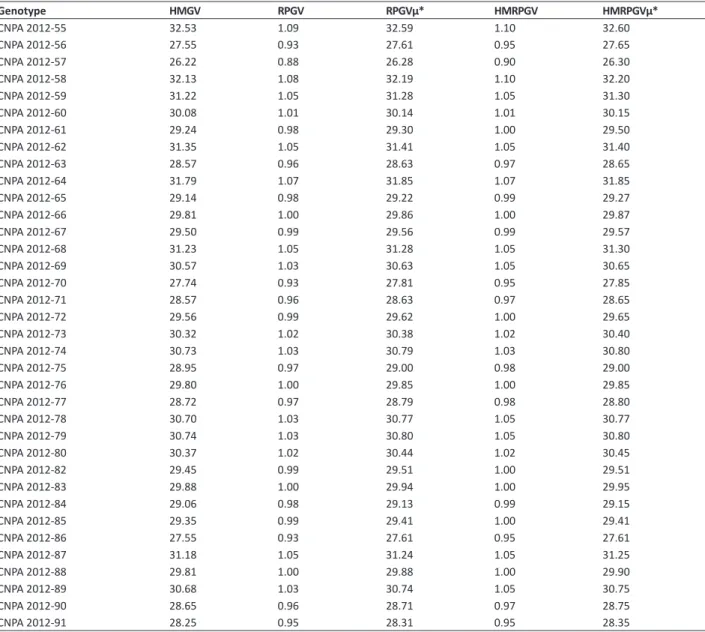
Table 2 shows that the genotypic value for the mean of environments (μˆ + gˆ) generated results similar to the methods
in which adaptability (RPGV), adaptability and stability (HMRPGV) are simultaneously capitalized (Table 3). According to Maia et al. (2009), the capitalization of the G x E interaction depends on the selection of genotypes for greater adaptability and stability to the evaluated environments. This criterion is repeated in the genotypes CNPA 2012-55, CNPA 2012-58, CNPA 2012-62 and CNPA 2012-64, selected by the genetic means free of interaction (μˆ + gˆ).This fact indicates that these Table 3. Stability of genetic values (HMGV), adaptability of genetic values (RPGV and RPGVμ), stability and adaptability of genetic values (HM-RPGV and HM(HM-RPGVμ) for length of fibers (mm) of 36 cotton genotypes predicted by BLUP analysis
Genotype HMGV RPGV RPGVμ* HMRPGV HMRPGVμ*
CNPA 2012-55 32.53 1.09 32.59 1.10 32.60
CNPA 2012-56 27.55 0.93 27.61 0.95 27.65
CNPA 2012-57 26.22 0.88 26.28 0.90 26.30
CNPA 2012-58 32.13 1.08 32.19 1.10 32.20
CNPA 2012-59 31.22 1.05 31.28 1.05 31.30
CNPA 2012-60 30.08 1.01 30.14 1.01 30.15
CNPA 2012-61 29.24 0.98 29.30 1.00 29.50
CNPA 2012-62 31.35 1.05 31.41 1.05 31.40
CNPA 2012-63 28.57 0.96 28.63 0.97 28.65
CNPA 2012-64 31.79 1.07 31.85 1.07 31.85
CNPA 2012-65 29.14 0.98 29.22 0.99 29.27
CNPA 2012-66 29.81 1.00 29.86 1.00 29.87
CNPA 2012-67 29.50 0.99 29.56 0.99 29.57
CNPA 2012-68 31.23 1.05 31.28 1.05 31.30
CNPA 2012-69 30.57 1.03 30.63 1.05 30.65
CNPA 2012-70 27.74 0.93 27.81 0.95 27.85
CNPA 2012-71 28.57 0.96 28.63 0.97 28.65
CNPA 2012-72 29.56 0.99 29.62 1.00 29.65
CNPA 2012-73 30.32 1.02 30.38 1.02 30.40
CNPA 2012-74 30.73 1.03 30.79 1.03 30.80
CNPA 2012-75 28.95 0.97 29.00 0.98 29.00
CNPA 2012-76 29.80 1.00 29.85 1.00 29.85
CNPA 2012-77 28.72 0.97 28.79 0.98 28.80
CNPA 2012-78 30.70 1.03 30.77 1.05 30.77
CNPA 2012-79 30.74 1.03 30.80 1.05 30.80
CNPA 2012-80 30.37 1.02 30.44 1.02 30.45
CNPA 2012-82 29.45 0.99 29.51 1.00 29.51
CNPA 2012-83 29.88 1.00 29.94 1.00 29.95
CNPA 2012-84 29.06 0.98 29.13 0.99 29.15
CNPA 2012-85 29.35 0.99 29.41 1.00 29.41
CNPA 2012-86 27.55 0.93 27.61 0.95 27.61
CNPA 2012-87 31.18 1.05 31.24 1.05 31.25
CNPA 2012-88 29.81 1.00 29.88 1.00 29.90
CNPA 2012-89 30.68 1.03 30.74 1.05 30.75
CNPA 2012-90 28.65 0.96 28.71 0.97 28.75
CNPA 2012-91 28.25 0.95 28.31 0.95 28.35
genotypes presented adaptability and genotypic stability between the three environments analyzed, in addition to having high length of fibers, i.e., the maintenance of this trait across the different environments. These results corroborate those obtained by Maia et al. (2009), Regitano Neto et al. (2013) and Torres et al. (2016), who verified the maintenance of the ranking of cashew clones, rice genotypes and cowpea, respectively, by genotypic value of methods for the mean of years (μˆ + gˆ), HMGV, RPGV and HMRPGV, attributing these results to genotypic correlation across sites (rˆgloc), which
was positive and of similar magnitude to those of study.
REFERENCES
Bastos IT, Barbosa MHP, Resende MDV, Peternelii LA, Silveira LCI, Donda LR, Fortunato AA, Costa PMA and Figueiredo ICR (2007) Avaliação da interação genótipo x ambiente em cana-de-açúcar via modelos mistos. Pesquisa Agropecuária Tropical37: 195-203.
Carbonell SAM, Chioratto AF, Resende MDV, Dias LAS, Beraldo ALA and Perina EF (2007) Estabilidade de cultivares e linhagens de feijoeiro em diferentes ambientes no Estado de São Paulo. Bragantia66: 193-201.
Carvalho LP, Farias FJC and Rodrigues JIS (2015a) Selection for increased fiber length in cotton progenies from Acala and Non-Acala types.
Crop Science55: 1-7.
Carvalho LP, Salgado CC, Farias FJC and Carneiro VQ (2015b) Estabilidade e adaptabilidade de genótipos de algodão de fibra colorida quanto aos caracteres de fibra. Ciência Rural45: 598-605.
Carvalho LP, Farias FJC, Morelo CL, Rodrigues JIS and Teodoro PE (2015c) Agronomic and technical fibers traits in elite genotypes of cotton herbaceous. African Journal of Agricultural Research 10: 4882-4887.
Carvalho LP, Farias FJC, Morelo CL and Teodoro PE (2016) Uso da metodologia REML/BLUP para seleção de genótipos de algodoeiro com maior adaptabilidade e estabilidade produtiva. Bragantia 75: 314-321.
Cruz CD, Carneiro PCS and Regazzi AJ (2014) Modelos biométricos
aplicados ao melhoramento genético. 3rd edn, Editora UFV, Viçosa,
668p.
Farias FJC, Carvalho LP, Silva Filho JL and Teodoro PE (2016a) Biplot analysis of phenotypic stability in upland cotton genotypes in Mato Grosso.
Genetics and Molecular Research 15: 1-8.
Farias FJC, Carvalho LP, Silva Filho JL and Teodoro PE (2016b) Usefulness of the HMRPGV method for simultaneous selection of upland cotton genotypes with greater fiber length and high yield stability. Genetics
and Molecular Research 15: 1-8.
Hoogerheide ESS, Vencovsky R, Farias FJC, Freire EC and Arantes EM (2007) Correlações e análise de trilha de caracteres tecnológicos e produtividade de fibra de algodão. Pesquisa Agropecuaria Brasileira 42: 1401-1405.
Laviola BG, Alves AA, Gurgel FD, Rosado TB, Rocha RB and Albrecht JC (2012) Estimates of genetic parameters for physic nut traits based in the germplasm two years evaluation. Ciência Rural42: 429-435.
Maia MCC, Resende MDV, Paiva JR, Cavalcanti JJV and Barros LM (2009) Seleção simultânea para produção, adaptabilidade e estabilidade genotípicas em clones de cajueiro, via modelos misto. Pesquisa
Agropecuária Tropical39: 43-50.
Menezes IPP, Hoffmann LV and Barroso PAV (2015) Genetic characterization of cotton landraces found in the Paraíba and Rio Grande do Norte states. Crop Breeding and Applied Biotechnology 15: 26-32.
Morello CL, Suassuna ND, Barroso PAV, Silva Filho JL, Ferreira ACB, Lamas FL, Pedrosa MB, Chitarra LG, Ribeiro JL, Godinho VPC and Lanza MA (2015) BRS 369RF and BRS 370RF: Glyphosate tolerant, high-yielding upland cotton cultivars for central Brazilian savanna. Crop Breeding
and Applied Biotechnology 15: 290-294.
Ramalho MAP, Abreu AFB, Santos JB and Nunes JAR (2012) Aplicações
da genética quantitativa no melhoramento de plantas autógamas.
UFLA, Lavras, 328p.
Regitano Neto A, Ramos Júnior EA, Gallo PB, Freitas JG and Azzini LE (2013) Comportamento de genótipos de arroz de terras altas no estado de São Paulo. Revista Ciência Agronômica44: 512-519.
Resende MDV (2007) SELEGEN‑REML/BLUP: sistema estatístico e seleção
genética computadorizada via modelos lineares mistos. Embrapa Florestas, Colombo, 359p.
Resende MDV, Prates DF, Yamada CK and Jesus A (1996) Estimação de componentes de variância e predição de valores genéticos pelo método da máxima verossimilhança restrita (REML) e melhor predição linear não viciada (BLUP) em pinus. Boletim de Pesquisa Florestal32-33: 23-42.
Resende MDV and Duarte JB (2007) Precisão e controle de qualidade em experimentos de avaliação de cultivares. Pesquisa Agropecuária
Tropical37: 182-194.
Rosado AM, Rosado TB, Alves AA, Laviola BG and Bhering LL (2012) Seleção simultânea de clones de eucalipto de acordo com produtividade, estabilidade e adaptabilidade. Pesquisa Agropecuária Brasileira 47: 964-971.
Silva Filho J.L, Morello CL, Farias FJC, Lamas FM, Pedrosa MB and Ribeiro JL (2008) Comparação de métodos para avaliar a adaptabilidade e estabilidade produtiva em algodoeiro. PesquisaAgropecuária Brasileira43: 349-355.
Smith CW, Hague S, Hequet E, Thaxton S and Brown N (2008) Development of extra-long staple upland cotton. Crop Science48: 1823-1832.
Souza AA, Freire EC, Bruno RLA, Carvalho LP, Silva Filho LP and Pereira WE (2006) Estabilidade e adaptabilidade do algodoeiro herbáceo no cerrado do Mato Grosso e Mato Grosso do Sul. Pesquisa
Agropecuária Brasileira41: 1125-1131.
stability of cotton cultivars in Mato Grosso State, Brazil. Pesquisa
Agropecuária Tropical36: 145-150.
Torres FE, Teodoro PE, Rodrigues EV, Santos A, Corrêa AM and Ceccon G (2016) Simultaneous selection for cowpea (Vigna unguiculata L.) genotypes with adaptability and yield stability using mixed models.
Genetics and Molecular Research 15:1-11.