Food Science and Technology
DO:
D https://doi.org/10.1590/1678-457X.08217
OSSN 1678-457X (Dnline)
1 Introduction
Sweet potatoes have high levels of digestible carbohydrates, contributing to calories, vitamins and minerals intake. Additionally, it is a source of carotenoids, vitamins A, C and B complex, besides minerals such as potassium, iron and calcium. Ot also presents a large quantity of methionine, i.e. an essential amino acid that is directly related to the well-being (Miranda et al., 1989; Luengo et al., 2000).
With regards to the alternative commercialization methods of sweet potatoes, Rogério et al. (2005) highlighted its potential among other tubers that are sold fresh in Brazilian market. The authors also mention increasing the product´s perceived value by producing fried snacks such as chips, since they demand for simple technology, easy transfer and low cost of implantation; in addition to represent a fast-growing sector that could be implemented in feeding programmes. Currently, there are other tubers products being commercialized such as cassava and parsnip, but there are low-quality products and their diffusion is restricted.
Some studies have already reported how promising is the chips production from tuber plants (Grizotto & Menezes, 2003; Rogério et al., 2005). Moreover, the commercialization of these products has been fast-growing in the national market. Currently, most of the chips are processed with potato (Solanum tuberosum L.); however, there are plenty raw-starch in banana, cassava and parsnip that could be used instead (Grizotto, 2000). Regarding
to the food quality attributes, it is crucial to consider the amount of oil used during chips production, since there is a world trend on healthy food consumption; therefore, low-calories and low-fat food (Duchon & Pyle, 2004).
Given all the above, we can consider other cooking methods such as oven-baking and air frying. These methods could be an interesting alternative when processing tubers, as they decrease in fat contents; consequently, winning healthy consumers who seek for their health and well-being.
The current study aimed to evaluate the feasibility and acceptability of sweet potato chips from three cultivars undergoing different cooking methods.
2 Materials and methods
Sweet potatoes varieties were purchased from the General Warehouses Company of São Paulo (CEAGESP), and transported to the Laboratory of Dietetics and Nutrition of the Onstitute of Biosciences of Botucatu (OBB UNESP). The current study used the sweet potatoes description from the standard classification as determined by CEAGESP (Companhia de Entrepostos e Armazéns Gerais de São Paulo, 2014); therefore, cream peel with yellow-flesh (TA) produced in the city of Piedade (state of São Paulo); pink peel with yellow-flesh (TB) from Braúna (state of São Paulo) and white peel with white-flesh (TC) from Texeira (state of Bahia).
Physicochemical and sensory characteristics of sweet potato chips
undergoing different cooking methods
Priscilla Kárim CAETAND1*, Flávia Aparecida de Carvalho MAROAND-NASSER1, Veridiana Zocoler de MENDDNÇA1,
Karina Aparecida FURLANETD1, Erica Regina DAOUTD1, Rogério Lopes VOEOTES1
Received 05 Mar., 2017 Accepted 04 Nov., 2017
1 Departamento de Horticultura, Faculdade de Ciências Agronômicas de Botucatu, Universidade Estadual Paulista – UNESP, Botucatu, SP, Brazil *Corresponding author: [email protected]
Abstract
The current study aimed to evaluate the feasibility and acceptability of sweet potato chips from three cultivars undergoing different cooking methods. The sweet potatoes used were cream peel with yellow-flesh, pink peel with yellow-flesh and white peel with white-flesh. Fresh tubers were characterized in terms of centesimal composition and the following contents: soluble solids, pH, titratable acidity, reducing sugar, total sugar, starch and colour. Chips were deep-fried with canola oil, commercial oven-baked and air fried. Therefore, the three sweet potato cultivars did not differ statistically in terms of reducing sugars; however, TB presented the lowest starch content. The centesimal composition was accordingly the literature whose differences referred to the type of cultivar. Dven-baked and air fried chips presented the lowest fat and moisture content, which increased their shelf life. Furthermore, all deep-fried sweet potato chips showed the best sensory acceptance and purchase intent by tasters.
Keywords:Ipomoea batatas L.; processing; acceptability; oil free fryer, frying.
Sweet potatoes were selected, washed and brushed thoroughly in running water to remove dirt. Subsequently, soaked in sodium hypochlorite (50 mg L-1) for 15 minutes and rinsed under running tap water. Then, they were all peeled with stainless steel knife and manual peeler. A potato chip slicer was used to obtain circular slices and thickness of 1.5 mm. Pre-cooking test was performed at 45, 60 and 90 seconds to choose the ideal time, being 60 seconds the best result. Afterwards, sweet potato chips were deep-fried with canola oil at 180 °C for ± 2 minutes, placed on oil-absorbing sheets to soak up oil and packed in Low-density polyethylene (LDPE). For oven-baking, sweet potato chips were laid out on a baking pan, without overlapping them, lined with aluminun foil for 25 minutes at 150 °C; when cooled, they were packed in LDPE. The air frying method combines infrared heat techniques without using oil; therefore, chips were placed in a non-stick bowl, without being overlapped, at 160 °C for 12 minutes, and they were turned every 3 minutes till cooked and packed in LDPE. For all cooking methods, salt (1.5%) was added onto the chips at the end of cooking.
Fresh sweet potatoes were analysed at Fruit and Vegetable Post-Harvest Laboratory, School of Agronomy of Botucatu, UNESP. The evaluations consisted of soluble solids (°Brix), pH, titratable acidity (mg citric acid 100g-1 pulp); moisture (%), ash (%), crude protein (%), fat (%) (Association of Dficial Analytical Chemists, 2007), reducing sugar (%), total sugar (%), starch (%) (Nelson, 1944; Somogy, 1945) and colour by using a CR-400 Chroma Meter (Konica Minolta Sensing). Three replications were carried out for each cultivar and all analyses were performed in triplicate in a completely randomized design.
Chips were analysed per moisture content (%), fat (%) (Association of Dficial Analytical Chemists, 2007), reducing sugars (%), total sugars (%), starch (%) (Nelson, 1944; Somogy, 1945) and colour by using a CR-400 Chroma Meter (Konica Minolta Sensing). Three replicates per treatment were carried out in a completely randomized design in a factorial scheme (3 x 3, i.e. variety x cooking).
Chips energy quantification was calculated from protein, lipid and glycine contents by using specific coefficients that consider heat of combustion and digestibility. Each component has its energy value determined: 4 kcal g-1 protein, 4 kcal g-1 carbohydrate and 9 kcal g-1 fat (Universidade Estadual de Campinas, 2004).
Ressearch Ethics Committee of the Botucatu Medical School approved the sensory analysis (#1011-811). Consumer acceptance test was performed with 60 untrained consumers, whose recruitment was based on their habits and interest in consuming chips. A 9-point hedonic scale, i.e.1=dislike extremely, 5=neither liked/or disliked, 9=like extremely, regarding appearance, flavour, aroma, texture, taste and overall acceptance (1 = would not buy, 2 = maybe buy, 3 = would buy). Salt intensity and crispness of the chips were also measured by the five-point scale (5 and 4 = much more intense/ salty/ crunchy than O like, 3 = the way O like it; 2 and 1 = much less intense/ salty/ crunchy than O like) (Associação Brasileira de Normas Técnicas, 1998).
Samples were standardized and tests were carried out in an air-conditioned and controlled lighting environment. Samples were labelled with 3-digit numbers and served in a randomized
order. Each consumer was monadically served about 10g of each chip samples in white polyethylene cup; besides water was offered to dissipate any residual flavour.
Data were processed based on the analysis of variance (ANDVA) and means were compared by Tukey test at 5% of significance. The Sisvar software was used for statistical analyses.
3 Results and discussions
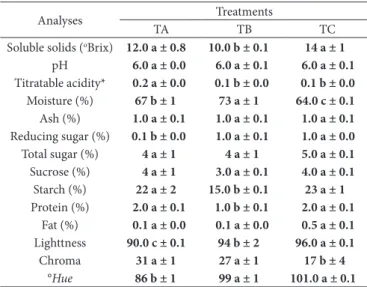
Table 1 shows physicochemical characterization, centesimal composition and colour of the fresh sweet potatoes.
Regarding to soluble solids, there was a significant effect on the varieties, but the pink peel and yellow-flesh (TB) presented the lowest value (10.0). Although these levels were higher than those obtained by Corrêa et al. (2014), who obtained values in a range of 7.00 to 8.60 for Canadian’s sweet potatoes variety; these authors explained such differences in variety, maturity stage and edaphoclimatic conditions.
The pH values were not influenced by the variety presenting pH 6.0 for all the sweet potatoes studied. The results corroborate the one reported by Leonel & Cereda (2002) that evaluated amylaceous tubers and reported a pH value of 6.29 in sweet potatoes, whose variety was not mentioned.
Titratable acidity values ranged from 0.1 to 0.2 mg of citric acid in 100 g-1 pulp. On TA, the value was higher than the other two; therefore, it indicated a significant effect among the varieties. Similar values were reported by Corrêa et al. (2014), who obtained 0.10 mg of citric acid in 100 g-1 pulp at the 14th day of storage.
Moisture content varied from 64.0% (TC) to 73% (TB), besides that the three studied varieties differed from each other. Leonel & Cereda (2002) obtained 66.73%; Kohyama & Nishinari (1992) presented values in a range of 59.1 to 77.7%. The presence of moisture is directly related to the crispness of the chips (Grizotto, 2005), in other words, higher moisture
Table 1. Characterization of fresh sweet potatoes. Botucatu, 2015.
Analyses Treatments
TA TB TC
Soluble solids (oBrix) 12.0 a ± 0.8 10.0 b ± 0.1 14 a ± 1
pH 6.0 a ± 0.0 6.0 a ± 0.1 6.0 a ± 0.1 Titratable acidity* 0.2 a ± 0.0 0.1 b ± 0.0 0.1 b ± 0.0 Moisture (%) 67 b ± 1 73 a ± 1 64.0 c ± 0.1 Ash (%) 1.0 a ± 0.1 1.0 a ± 0.1 1.0 a ± 0.1 Reducing sugar (%) 0.1 b ± 0.0 1.0 a ± 0.1 1.0 a ± 0.0 Total sugar (%) 4 a ± 1 4 a ± 1 5.0 a ± 0.1 Sucrose (%) 4 a ± 1 3.0 a ± 0.1 4.0 a ± 0.1 Starch (%) 22 a ± 2 15.0 b ± 0.1 23 a ± 1 Protein (%) 2.0 a ± 0.1 1.0 b ± 0.1 2.0 a ± 0.1
Fat (%) 0.1 a ± 0.0 0.1 a ± 0.0 0.5 a ± 0.1 Lighttness 90.0 c ± 0.1 94 b ± 2 96.0 a ± 0.1
Chroma 31 a ± 1 27 a ± 1 17 b ± 4
°Hue 86 b ± 1 99 a ± 1 101.0 a ± 0.1 *(Mg citric acid 100g-1 pulp). Means followed by the same horizontal letter do not differ
content is associated with the amount of fat absorbed during frying process, resulting in wilted chips.
For the ash content, no significant effect was observed between the varieties, presenting an average of 1.0%. Kohyama & Nishinari (1992) reported values from 0.6 to 1.7% in sweet potatoes, but did not mention the variety; Silveira et al. (2011), characterized orange-fleshed sweet potato clones and reported values in a range of 0.88 to 1.34%, which is similar to those found in the current study.
The reducing sugar obtained for sweet potato TB and TC were 1.0%, presenting statistical difference for the contents of AT (0.1%). Grizotto (2005) stated that chips must present a light gold coloration, since a brownish colour and absence of dots or dark traces is mainly related to reducing sugars content.
Reducing sugars (glucose and fructose) and non-reducing sugars (sucrose) are used to predict the material behaviour used during the preparation of chips. Generally, monosaccharides (reducing sugars) are considered the limiting factor in colour depreciation. Deep-fried tubers should present a content from 0.2 to 0.3% in wet basis, to develop acceptable colour, because lower values cause white coloration in chips (Vendruscolo, 1998). However, the excessive presence of sugars results in non-enzymatic darkening, this reaction occurs at high temperature and low humidity (Kumar et al., 2004). Although TB and TC presented higher levels within optimal range, the chips did not present an excessive darkening in the final product when compared to TA chips that were within the standards (Table 2). Therefore, it is observed that the values for sweet potatoes are much higher,
resulting in a product in which other attributes must be evaluated to identify the quality for the product type to be elaborated.
Total sugars showed no statistical difference among the varieties; therefore, the averages obtained were of 4% (TA), 4% (TB) and 5.0% (TC). These values were different from the ones reported by Leonel & Cereda (2002), as they obtained 5.74% (reducing sugars) and 6.99% (total sugars).
Carbohydrate content determines tubers quality, especially those destined for processing, which is influenced by the variety, climatic conditions and storage (Kumar et al., 2004).
For starch quantification, there was a significant difference among the varieties, in which TB presented the lowest content (15.0%), differed from TA (22%) and TC (23%), these both did not present significant differences between them. Leonel & Cereda (2002) obtained 14.72%; and Silveira et al. (2011) found values in a range of 14.66 and 30.66% in orange-fleshed sweet potato clones, which are in accordance with the results found in the current study.
The crude protein content was 2.0% (TA) and 2.0% (TC), both differed from TB, which presented 1.0% (Table 2). Kohyama & Nishinari (1992) reported values in a range of 2.0 to 2.9% in sweet potato without mentioning the variety. Rogério et al. (2005) presented higher values, i.e. 6.68g 100g-1 of crude protein in unspecified variety of sweet potatoes. However, Andrade et al. (2012) studied different clones and commercial varieties of sweet potatoes produced in Diamantina (State of Minas Gerais) and obtained protein contents from 3.9 to 4.6%
There was no statistical difference in fat content. The averages obtained were of 0.1% (TA), 0.1% (TB) and 0.5% (TC). Kohyama & Nishinari (1992) obtained values from 0.8 to 3%; and Andrade et al. (2012) from 0.6 to 0.8% in sweet potato clones and commercial cultivars.
Regarding to the sweet potato colours, it was observed that white varieties presented higher values of lightness; therefore, there was a significant effect among the samples, being TC brighter than the others.
With regards to Chroma, there was variation in a range of 17 to 31. Saturation or Chroma (C*) is how intense a hue is in terms of pigments (Mendonça et al., 2003). A hue with 0% saturation appears as medium gray and closer to 60% is more vivid.
Flesh colour was expressed as °Hue, which defines the colour itself, the value for hue axis vary from 0 to 360°, e.g. yellow from 91° to 126°. The current study observed a variation between 86 and 101.0 °Hue, thus, all cultivars presented a sort of yellow colour to a greater or lesser degree.
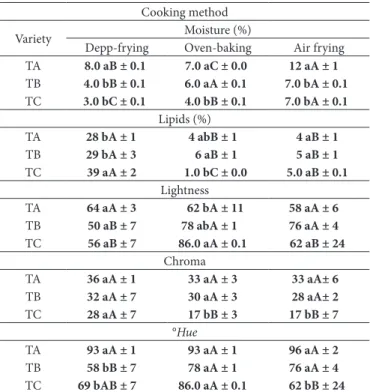
Table 2 presents the quality analysis of sweet potato chips. Moisture can be influenced by both cooking method and sweet potato variety. Regardless of the cooking method, TA presented the highest moisture content when deep-fried (8.0%), air fried (12%) and oven-baked (7.0%), but there was not statistically significant from TB oven-baked chips (6.0%). TB and TC presented the lowest moisture contents when deep-fried, i.e. 4.0 and 3.0%, respectively. Rogério et al. (2005), evaluated the quality characteristics of the different tubers, including sweet potato, and obtained moisture values close to the current study´s deep-frying method, which was 3.09%.
Table 2. Quality evaluation (moisture, fat and colour) of the three varieties of sweet potatoes under different cooking methods. Botucatu, 2015.
Cooking method
Variety Moisture (%)
Depp-frying Dven-baking Air frying TA 8.0 aB ± 0.1 7.0 aC ± 0.0 12 aA ± 1 TB 4.0 bB ± 0.1 6.0 aA ± 0.1 7.0 bA ± 0.1 TC 3.0 bC ± 0.1 4.0 bB ± 0.1 7.0 bA ± 0.1
Lipids (%)
TA 28 bA ± 1 4 abB ± 1 4 aB ± 1 TB 29 bA ± 3 6 aB ± 1 5 aB ± 1 TC 39 aA ± 2 1.0 bC ± 0.0 5.0 aB ± 0.1
Lightness
TA 64 aA ± 3 62 bA ± 11 58 aA ± 6 TB 50 aB ± 7 78 abA ± 1 76 aA ± 4 TC 56 aB ± 7 86.0 aA ± 0.1 62 aB ± 24
Chroma
TA 36 aA ± 1 33 aA ± 3 33 aA± 6 TB 32 aA ± 7 30 aA ± 3 28 aA± 2 TC 28 aA ± 7 17 bB ± 3 17 bB ± 7
°Hue
Dven-baking and air frying methods presented lower moisture content than those found by Garcia & Almeida (2015), who produced sweet potato chips from biofortified variety (i.e.1205-Embrapa), obtained an average of 14.35% (sun dried) and 31.31% (microwaved). However, it is important to note that oven-baking and air frying methods reached final moisture content below 25%; therefore, following the Brazilian legislation for dehydrated foods (Agência Nacional de Vigilância Sanitária, 1978).
Moisture content is among the most important attributes analysed in food (Garcia-Amoedo & Almeida-Muradian, 2002), since it is an indicator of product quality. Ot is related to the perishability; therefore, inadequate levels may lead to large losses in chemical stability and microbiological contamination (Drdóñez, 2005). Capézio et al. (1993) stated that moisture content is a determinant of root quality. Potatoes with high dry matter result in a high-quality product for processing. On this way, TB and TC chips presented this favourable characteristic, since they had less moisture content.
Fat content varied from 1.0 to 39% in sweet potato chips under different cooking methods. Such differences directly influence the final energy value of the products (Dliveira, 2009), since lipids represent higher caloric value. As expected, the highest values were found in deep-fried chips, i.e. from 28 to 39%; however, the lowest levels were found in TA and TB chips. Regarding to the oven-baked chips, there was a statistically significant difference in the lipid contents, where TB presented higher concentration of fat (6%), but it was not statistically significant from TA chips (4%); while TC presented the lowest value (1.0%).
The air fryer method did not differ statistically and presented levels in a range of 4.0 to 5.0%. Rogério et al. (2005), reported levels of 3.09% moisture and 38.4% lipids in sweet potato chips. Moreover, these authors indicated a positive correlation between moisture content and lipid absorption, which did not occur in the current study.
Ahamed et al. (1997) stated that some aspects are important in the concentration of lipids, such as water content; physicochemical characteristics of fresh tubers; contact surface; frying time; cooking method; porosity and pre-treatments. Regarding to the lightness, there was a significant difference in oven-baked chips, TC presented the highest values (86.0), but not statistically different from TB (78); however, the lowest values was obtained in TA chips (62). By deep-frying, TB and TC chips presented the lowest values of lightness, i.e. 50 and 56, respectively. Thus, such results indicated the predominance of low lightness, in addition to the colours between fresh and processed chips, it was observed that there was darkening of the chips. Dverall, heat treatments modify the colours of processed samples in relation to fresh tubers.
Chroma values were influenced in oven-baked and air fried chips in a range of 17 to 33 among them. The lowest values were observed in roasted TC variety and air fryer chips, both with 17. Additionally, there was an increase in colour saturation, probably due to the thermal process, when compared colour values between fresh and processed tubers.
For °Hue, there was influence on the TB and TC. However, all cooking methods presented orange coloured chips. Ondependently of the cooking method, TA chips presented °Hue in a range of 93 to 96, i.e. yellow colour. Dverall, the colour
angle of the chips ranged from 55° to 90° Hue (i.e. orange) and 91° to 126° (i.e. yellow).
When evaluating °Hue of the fresh tubers and chips, a decrease was observed in TB and TC deep-fried chips. On TA, it was observed an increase in the tonality from orange to yellow in all cooking methods.
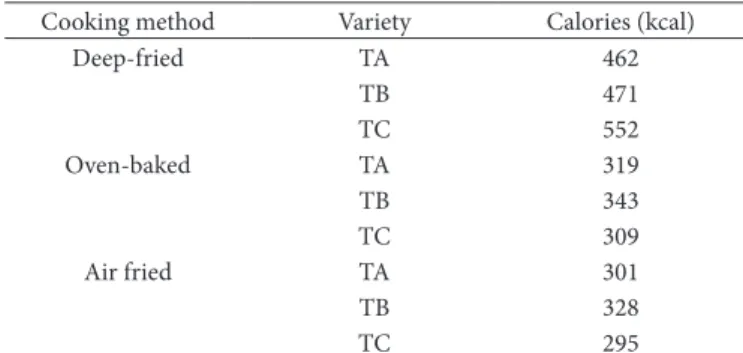
Table 3 shows the caloric value of the chips under different cooking methods.
On all varieties, deep-fried presented higher caloric value than oven-baked and air fried methods. On the current study, caloric values were close to those by Rogério et al. (2005), who produced deep-fried chips from tropical tubers, including sweet potatoes, and presented a value of 581.76 kcal per 100 grams of fried chips.
Ot was expected the highest caloric value in deep-fried, because the oil acts as a strong heat transmitter, incorporating itself as a new ingredient; in other words, taking the space left by the water and diffusing through the interior. On food, the quantity of calories after frying shows that there is a substantial gain in the energy value (Cella et al., 2002; Sanibal & Mancini, 2009).
Most of the untrained consumers who participated in the sweet potato chips ‘acceptability test was female in the age range of 17 to 20. By conducting the survey, it was observed that 90% of the tasters consume potato chips at least once every 15 days, but 55% have never heard of sweet potato chips and 78% have never tasted it. Ot is observed that 90% of the tasters were non-smokers and 66.67% belonged to middle class, which was based on family income (Faculdade Getúlio Vargas, 2015).
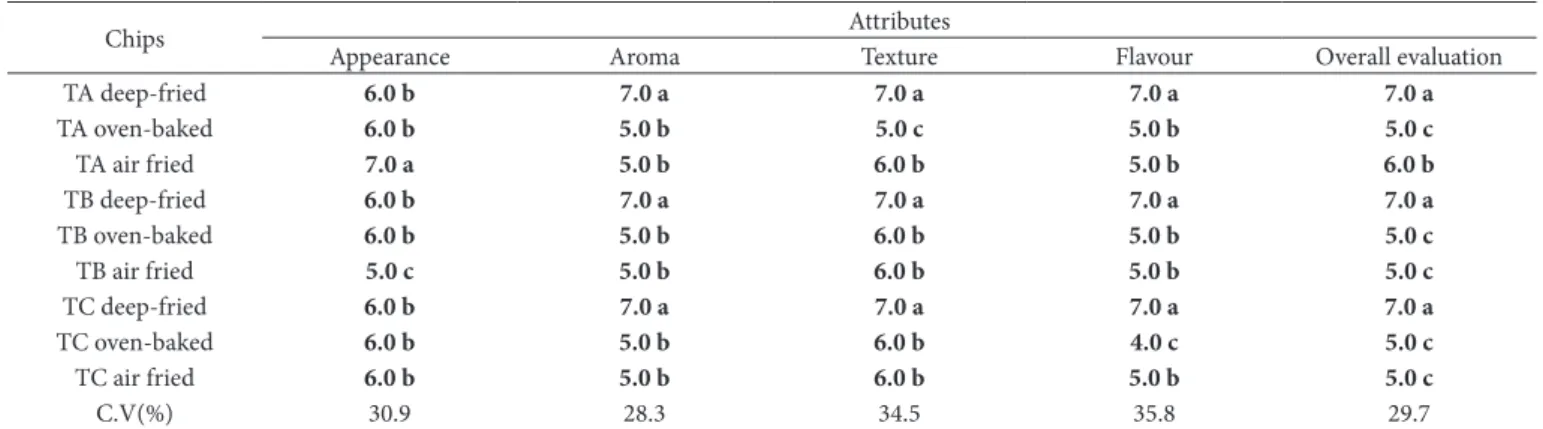
Table 4 shows the scores attributed by the untrained tasters through the affective and hedonic scale tests for appearance, aroma, texture, flavour and overall evaluation of sweet potato chips under different cooking methods.
Table 4 shows the score for appearance, aroma, texture, taste and overall evaluation. For product appearance, the highest grades were given for TA air fried chips (7,0), differing statistically from the fried and roasted TA variety, fried and roasted TB variety and the three TC preparations, with a value of 6. The TB variety air fryer potatoes received the lowest grades (5.0).
For appearance, it must be emphasized that consumers are used to potato chips. Tfouni et al. (2003) states that there is a preference for potato chips with a light golden colour, with no
Table 3. Caloric value of sweet potato chips under different cooking methods. Botucatu, 2015.
Cooking method Variety Calories (kcal)
Deep-fried TA 462
TB 471
TC 552
Dven-baked TA 319
TB 343
TC 309
Air fried TA 301
TB 328
TC 295
dark spots or traces. According to these authors the final colour mainly depends on the chemical composition of fresh tubers, which is influenced by the variety, cultivation conditions and storage, being reducing sugars content of fresh tubers the main component that affects colour; whether it is higher than 1%, it may compromise coloration. On this way, reducing sugars in sweet potatoes is higher than 1%; consequently, one product that is different from the one present in current market.
For the aroma, flavour and overall evaluation, the best scores were attributed to deep-fried chips, regardless of the variety, receiving grade 7.0. Among all varieties, oven-baked and air fried chips were given the lowest score for flavour, aroma and overall evaluation in a range of 4.0 to 5.0. Such results may be probably related to the dietary pattern of this age group. Viana et al. (2008) explained that adults would rather consume
foods rich in fat; sweet; savoury; spicy and bitter; due to cultural and family background.
As for the texture, all oil-fried varieties received the highest grades (7.0), while the texture of lesser acceptance by the tasters was pointed out in the conventional baked TA product (5.0). Ontermediate note (6.0) was assigned to TA in air fryer, TB and TC in conventional oven and air fryer. The texture (crispness) in potato chips is one of the most important quality indicators in the final product, along with colour, aroma and flavour (Salvador et al., 2009).
Regarding to the chips’ purchase intention, deep-fried was preferred among the cooking methods, independently from the variety, being the highest percentage (an average of 47.8%), thus, confirming the commercial potential of such product (Figure 1).
Table 4. Acceptability scores of sweet potato chips from three varieties under different cooking methods. Botucatu, 2015.
Chips Attributes
Appearance Aroma Texture Flavour Dverall evaluation
TA deep-fried 6.0 b 7.0 a 7.0 a 7.0 a 7.0 a
TA oven-baked 6.0 b 5.0 b 5.0 c 5.0 b 5.0 c
TA air fried 7.0 a 5.0 b 6.0 b 5.0 b 6.0 b
TB deep-fried 6.0 b 7.0 a 7.0 a 7.0 a 7.0 a
TB oven-baked 6.0 b 5.0 b 6.0 b 5.0 b 5.0 c
TB air fried 5.0 c 5.0 b 6.0 b 5.0 b 5.0 c
TC deep-fried 6.0 b 7.0 a 7.0 a 7.0 a 7.0 a
TC oven-baked 6.0 b 5.0 b 6.0 b 4.0 c 5.0 c
TC air fried 6.0 b 5.0 b 6.0 b 5.0 b 5.0 c
C.V(%) 30.9 28.3 34.5 35.8 29.7
Means followed by the same letter in the column do not differ from each other, by the Tukey test at the 5% level of significance. TA: cream peel and yellow-flesh; TB: pink peel and yellow-flesh and TC: white peel and white-flesh. MSD: minimum significant difference. CV: coefficient of variation.
Among the deep-fried chips, the main intention (about 57%) was to buy pink peel and yellow-flesh, probably because it is the most popular variety. The lowest buying intentions were observed in TA oven-baked (50%), TB air fried (55%) and TC oven-baked and air fried chips (62%). Among cooking methods, air fried received the highest rejection, i.e. an average of 53%.
Through the consumers’ behaviour, it was verified that the preference was for deep-fried sweet potato chips, since it presented good acceptability for all evaluated attributes, including purchase intention.
4 Conclusion
Dven-baked and air fried chips have low fat and moisture content; therefore, high shelf life, storable at room temperature and innovative in the market to meet new trends in the preparation of healthy products.
Among varieties, deep-fried chips were more widely accepted than other cooking methods, presenting higher grades for aroma, flavour, texture and overall acceptance as well as the greater purchase intention by the tasters.
Reducing sugar contents are not within the ideal range for chip processing, but it did not cause damages in the final colour of the product.
References
Agência Nacional de Vigilância Sanitária – ANVOSA. (1978, July 24). Resolução CNNPA nº 12, de 1978. Normas Técnicas Especiais, fixa padrões de identidade e qualidade para os alimentos (e bebidas).
Diário Oficial [da] República Federativa do Brasil.
Ahamed, N. T., Singhal, R. S., Kulkarni, P. R., & Pal, M. (1997). Deep fat-fried snacks from blends of soya flour and corn, amaranth and chenopodium starches. Food Chemistry, 58(4), 313-317. http:// dx.doi.org/10.1016/S0308-8146(96)00160-4.
Andrade, V. C., Jr., Viana, D. J. S., Pinto, N. A. V. D., Ribeiro, K. G., Pereira, R. C., Neiva, O. P., Azevedo, A. M., & Andrade, P. C. R. (2012). Características produtivas e qualitativas de ramas e raízes de batata-doce. Horticultura Brasileira, 30(4), 584-589. http://dx.doi. org/10.1590/S0102-05362012000400004.
Associação Brasileira de Normas Técnicas – ABNT. (1998). NBR 14141: escalas utilizadas em análise sensorial de alimentos e bebidas. Rio de Janeiro: ABNT.
Association of Dficial Analytical Chemists – ADAC. (2007). Official methods of analysis (18th ed.). Gaithersburg: ADAC Onternational. Current Through Revision 2.
Capézio, S., Huarte, M., & Carrozzi, L. (1993). Selección por peso especifico em generaciones tempranas en el mejoramiento de la papa. Revista Latinoamericana de la Papa, 6, 54-63.
Cella, R. C. F., Regitano-D’Arce, M. A. B., & Spoto, M. H. (2002). Comportamento do óleo de soja refinado utilizado em fritura por imersão com alimentos de origem vegetal. Ciência e Tecnologia de Alimentos, 22(2), 56-58. http://dx.doi.org/10.1590/S0101-20612002000200002.
Companhia de Entrepostos e Armazéns Gerais de São Paulo – CEAGESP. (2014). Normas de classificação batata-doce. Programa Brasileiro para a modernização da Horticultura, 12(2), 8.
Corrêa, C. V., Gouveia, A. M. S., Tavares, A. E. B., Evangelista, R. M., & Cardoso, A. O. O. (2014). Conservação de raízes de batata-doce em função do parcelamento da adubação potássica. Revista Raízes e Amidos Tropicais, 10(1), 65-73.
Faculdade Getúlio Vargas – FGV. Centro de Políticas Sociais – CPS. (2015). Renda e bem estar: qual a faixa de renda familiar das classes?
Faculdade Getúlio Vargas. Retrieved from http://cps.fgv.br/node/3999 Garcia, L. G. C., & Almeida, P. P. (2015). Avaliação da cor de chips
de batata-doce (ipomoea batatas l.) biofortificada desidratados obtidos via secagem natural e por micro-ondas. Journal of Fruits and Vegetables, 1(1), 93-97.
Garcia-Amoedo, L. H., & Almeida-Muradian, L. B. (2002). Comparação de metodologias para a determinação de umidade em geleia real.
Quimica Nova, 25(4), 676-679. http://dx.doi.org/10.1590/S0100-40422002000400024.
Grizotto, R. K. (2000). Mandioca chips uma tecnologia para aproveitamento a mandioca (Manihot esculenta Crantz) (Tese de doutorado). Universidade Estadual de Campinas, Campinas.
Grizotto, R. K. (2005). Processamento e rendimento industrial da batata chips e palha. Otapetininga: ABBA. Retrieved from http://www. abbabatatabrasileira.com.br/minas2005/19%20-%20Processamento%20 da%20batata%20chips%20e%20palha%2001.pdf
Grizotto, R., & Menezes, H. C. (2003). Aceitação de chips de mandioca.
Ciência e Tecnologia de Alimentos, 23, 79-86. http://dx.doi.org/10.1590/ S0101-20612003000400015.
Kohyama, K., & Nishinari, K. (1992). Cellulose derivatives effects on gelatinization and retrogadation of sweet potato starch. Journal of Food Science, 57(1), 128-131. http://dx.doi.org/10.1111/j.1365-2621.1992. tb05439.x.
Kumar, D., Singh, B. P., & Kumar, P. (2004). An overview of the factors affecting sugar content of potatoes. Annals of Applied Biology, 145(3), 247-256. http://dx.doi.org/10.1111/j.1744-7348.2004.tb00380.x. Leonel, M., & Cereda, M. P. (2002). Caracterização físico-química de
algumas tuberosas amiláceas. Ciência e Tecnologia de Alimentos, 22(1), 65-69. http://dx.doi.org/10.1590/S0101-20612002000100012. Luengo, R. F. A., Parmagnani, R. M., Parente, M. R., & Lima, M. F. B. F. (2000). Tabela de composição nutricional de hortaliças. Brasília: Embrapa Hortaliças.
Mendonça, K., Jacomino, A. P., Melhem, T. X., & Kluge, R. A. (2003). Concentração de etileno e tempo de exposição para desverdecimento de limão “Siciliano”. Brazilian Journal of Food Technology, 6(2), 179-183. Miranda, J. E. C., França, F. H., Carrijo, D. A., Souza, A. F., Pereira, W., Lopes, C. A., & Dilva, J. B. C. (1989). Batata-doce (Ipomoea batatas (L.) Lam.) (2nd ed., 19 p.). Brasília: EMBRAPA/CNPH.
Nelson, N. A. (1944). Fotometric adaptaion of Somogyi method for the determination of glucose. The Journal of Biological Chemistry, 153, 375-380.
Dliveira, M. C. (2009). Composição nutricional e perfil de ácidos graxos de batatas chips e snacks extrusados (Dissertação de mestrado). Universidade Estadual Paulista, São José do Rio Preto.
Drdóñez, J. A. (2005). Tecnologia de alimentos: alimentos de origem animal (Vol. 2, 279 p.). Porto Alegre: The Art of Medication. Duchon, P. B., & Pyle, D. L. (2004). Studying oil absorption in restructured
potato chips. Journal of Food Science, 63(3), 115-122.
Rogério, W. F., Leonel, M., & Dliveira, M. A. (2005). Produção e caracterização de salgadinhos fritos de tuberosas tropicais. Revista Raízes e Amidos Tropicais, 1, 76-85.
measurements and sensory analysis. Lebensmittel-Wissenschaft + Technologie, 42(3), 763-767. http://dx.doi.org/10.1016/j.lwt.2008.09.016.
Sanibal, E. A. A. & Mancini, J., Fo. (2009). Alterações física, químicas e nutricionais de óleos submetidos ao processo de fritura. Caderno de Tecnologia de Alimentos e Bebidas, 1, 48-54.
Silveira, L. R., Chiesa, V. B., Tavares, O. B., Souza, R. C., Silveira, M. A., Alves, D. G., & Dliveira, W. P. Jr (2011). Caracterização físico-química e clones de batata-doce de polpa alaranjada nas condições de Palmas- TD. Estudos, 38(2), 365-380.
Somogy, M. A. (1945). New reagent for determination of dugars. The Journal of Biological Chemistry, 160, 61-68.
Tfouni, S. A. V., Machado, R. M. D., Garcia, L. C., Aguirre, J. M., & Gasparino, F. D. J. (2003). Batata chips e palha. Campinas: Onstituto de Tecnologia de Alimentos.
Universidade Estadual de Campinas – UNOCAMP. (2004). Tabela Brasileira de Composição de Alimentos: TACO. Campinas: Núcleo de Estudos e Pesquisas em Alimentação, UNOCAMP.
Vendruscolo, J. L. (1998). Avaliação e melhoria das qualidades tecnológicas e sensoriais de genótipos de batata (Solanum tuberosum L.) para a industrialização e consumo de mesa. Pelotas: CPACT/EMBRAPA. Viana, V., Santos, P. L., & Guimarães, M. J. (2008). Comportamento e
hábitos alimentares em crianças e jovens: Uma revisão da literatura.