http://dx.doi.org/10.1590/2317-1545v40n4198333
Multivariate index of soybean seed vigor: a new biometric approach
applied to the effects of genotypes and environments
1Vinícius Jardel Szareski
2*, Ivan Ricardo Carvalho
2, Gustavo Henrique Demari
2,
Tiago Corazza da Rosa
2, Velci Queiróz de Souza
3, Francisco Amaral Villela
2,
Tiago Pedó
2, Tiago Zanatta Aumonde
2ABSTRACT - The objective of this work was to apply a multivariate index of vigor in soybean seeds to identify the differential effects of the genotypes x environments interaction on the quality of the seeds produced in the 2016/2017 harvest season. The experiment was conducted in a randomized block design, organized in the factorial scheme, with five seed production environments x 20 soybean genotypes, arranged in four replications. The seed production environments of Tenente Portela - RS and Santa Rosa - RS soybeans are characterized as the environments that express the highest magnitude for seed vigor index, however biometrically Sarandi - RS has been defined as the optimal environment for the production of high vigor seeds according to the tested genotypes. High seed vigor index were expressed for the genotypes TMG 7161 RR, AMS Tibagi RR, BMX Magna RR, Fepagro 37 RR and NA 5909 RG. The differential effects of the genotypes x production environments interaction of soybean seeds influenced by more than 68% the vigor index of the seeds produced.
Index terms: Glycine max L., multitrait, differential effects, strategic positioning, seed production.
Í
ndice multivariado de vigor de sementes da soja: uma nova abordagem
biométrica aplicada aos efeitos de genótipos e ambientes
RESUMO - O objetivo deste trabalho foi aplicar um índice multivariado de vigor em sementes da soja para identificar os efeitos diferenciais da interação genótipos x ambientes na qualidade das sementes produzidas na safra 2016/2017. O experimento foi conduzido na safra agrícola de 2016/2017 em delineamento de blocos ao acaso, organizado no esquema fatorial, sendo: cinco ambientes de produção de sementes (Santa Rosa - RS, Tenente Portela - RS, Campos Borges - RS, Sarandi - RS e Pelotas - RS) x 20 genótipos de soja, dispostos em quatro repetições. Os ambientes de produção de sementes da soja de Tenente Portela – RS e Santa Rosa – RS caracterizam-se como os ambientes que expressam maior magnitude para o índice de vigor das sementes, entretanto biometricamente Sarandi – RS definiu-se como o ambiente ótimo para a produção de sementes de alto vigor diante dos genótipos testados. Elevado índice de vigor das sementes foram expressos para os genótipos TMG 7161 RR, AMS Tibagi RR, BMX Magna RR, Fepagro 37 RR e NA 5909 RG. Os efeitos diferenciais da interação genótipos x ambientes de produção das sementes de soja influencia em mais de 68% o índice de vigor das sementes produzidas.
Termos para indexação: Glycine max L., multicaráter, efeitos diferenciais, posicionamento estratégico, produção de sementes.
1Submitted on 05/09/2018. Accepted for publication on 09/10/2018. 2Departamento de Fitotecnia, Faculdade de Agronomia Eliseu Maciel, Universidade
Federal de Pelotas, Caixa postal 354, 96010-900 - Pelotas, RS, Brasil.
Introduction
Soybean (Glycine max L.) is characterized as the most
important crop for agribusiness. Brazil is the second largest producer in the world with approximately 113 million tons of grains harvested in an area of 35 million hectares. Soybean
yield is determined by biotic and abiotic factors intrinsic to the growing environment, considering that seeds of high
performance are defined as the main agricultural input (Szareski et al., 2018a; Carvalho et al., 2017a). They provide support to stresses after sowing and determine high yields. In this sense,
the production of high vigor seeds is determined by intrinsic
3Universidade Federal do Pampa, 97300-000 - São Gabriel, RS, Brasil.
genetic characteristics of the genotype used, edaphoclimatic conditions, sowing times, growing environments, genotypes x environments interaction, incidence of diseases and pests, nutritional management, time and practices of harvest and
post-harvest (Marcos-Filho, 2015; Strobel et al., 2016; Carvalho et al., 2016).
The seed production environment and the interaction
between environments and genotypes can directly influence the
quality of the seeds, because after the physiological maturity point (maximum dry matter accumulation, germination
and vigor), the seeds are stored in the field of production until harvest point. If inappropriate conditions such as high
temperature and precipitation occur the deterioration of the
seeds will be accentuated (Vasconcelos et al., 2012; Kehl et al., 2016; Pelegrin et al., 2016; Szareski et al., 2017). The methods of Genotype Main Effects and Genotype Environment
Interaction (GGE) allows to identify and estimate the
adaptability and stability of genotypes in relation to different
growing environments, grouping the correlated environments
to define macro environment, and also revealing genotypes of high performance for the trait of interest (Yan et al., 2016; Woyann et al., 2017; Szareski et al., 2018c).
Seed vigor is characterized as the main physiological attribute desired by seed producers, and the knowledge of its
importance has become widely spread (Koch et al., 2018).
Currently, there are questions about which test or methodology would be the most suitable for internal and external control of
seed quality, since different or contradictory results are often evidenced according to the vigor test used.
In order to increase the efficiency of positioning genotypes
among growing regions, and to identify the most favorable environments for achieving high performance seeds, it is essential that physiological tests present a unique tendency
for vigor (Szareski et al., 2018b; Zanatta et al., 2018; Gabriel et al., 2018). Therefore, a multitrait approach is attributed to
a vigor multivariate index capable of generating estimates of adaptability, stability and positioning of soybean genotypes
regarding environments for seed production. In this context,
the objective of this work was to apply a multivariate index
of vigor in soybean seeds to identify the differential effects of
the genotypes x environments interaction on the quality of the
seeds produced in the 2016/2017 harvest season.
Material and Methods
The experiment was conducted in the 2016/2017
agricultural year, in randomized blocks design, arranged in
a factorial scheme, being: five seed production environments
(Santa Rosa - RS, Tenente Portela - RS, Campos Borges - RS,
Sarandi - RS and Pelotas - RS) x 20 soybean genotypes (BRS Tordilha RR, FPS Paranapanema RR, Fepagro 37 RR, FPS Solimões RR, Fepagro 36 RR, FPS Netuno RR, FPS Iguaçu RR, FPS Urano RR, FPS Júpiter RR, AMS Tibagi RR, BMX Magna RR, A 6411 RG, BMX Apolo RR, BMX Potência RR, BMX Alvo RR, Roos Camino RR, BMX Ativa RR, NA 5909 RG, BMX Turbo RR and TMG 7161 RR), disposed in four replications (Table 1; Figure 1).
The seed production field was established in a standard way for all environments. Seeds were sown in the second half of october 2016. The experimental units were composed by five sowing rows spaced 0.50 m, with five meters length. The population density was 24 seeds per square meter and the nutritional management was composed of 300 kg. ha-1 of N-P
2O5
-K2O in the formula 02-20-30, which was applied at sowing base.
Weed, insect-pest and disease management were carried out
preventively for all tested environments and genotypes.
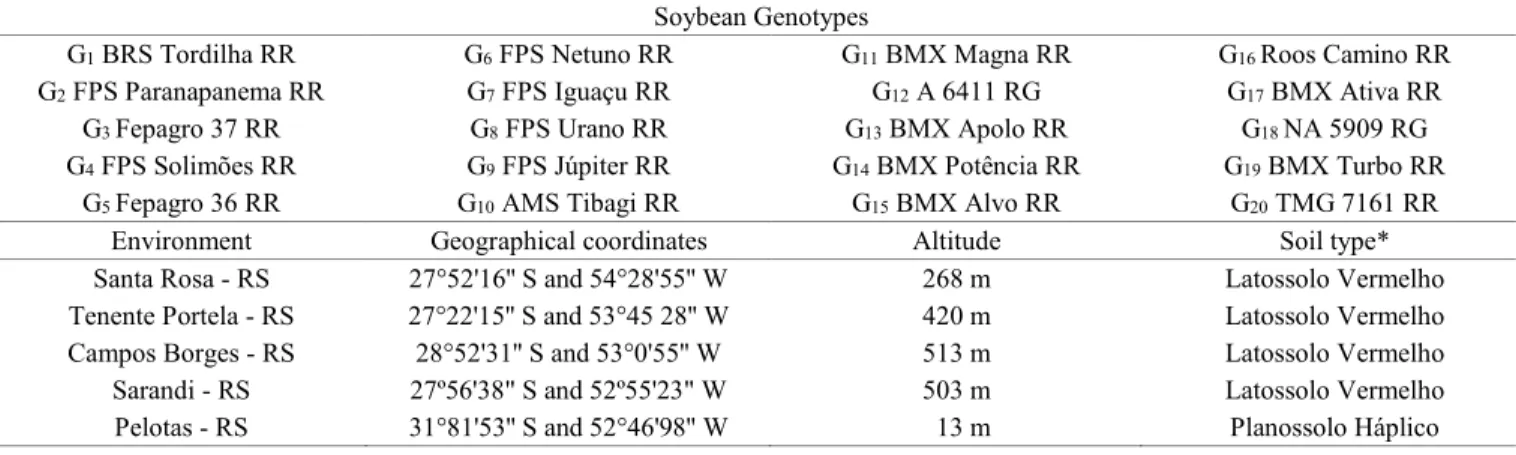
Table 1. Description of the 20 soybean genotypes and the five seed production environments, in the state of Rio Grande do Sul, Brazil.
Soybean Genotypes
G1 BRS Tordilha RR G6 FPS Netuno RR G11 BMX Magna RR G16 Roos Camino RR G2 FPS Paranapanema RR G7 FPS Iguaçu RR G12 A 6411 RG G17 BMX Ativa RR
G3 Fepagro 37 RR G8 FPS Urano RR G13 BMX Apolo RR G18 NA 5909 RG
G4FPS Solimões RR G9 FPS Júpiter RR G14BMX Potência RR G19BMX Turbo RR
G5 Fepagro 36 RR G10 AMS Tibagi RR G15 BMX Alvo RR G20 TMG 7161 RR
Environment Geographical coordinates Altitude Soil type*
Santa Rosa - RS 27°52'16'' S and 54°28'55'' W 268 m Latossolo Vermelho
Tenente Portela - RS 27°22'15'' S and 53°45 28'' W 420 m Latossolo Vermelho
Campos Borges - RS 28°52'31'' S and 53°0'55'' W 513 m Latossolo Vermelho
Sarandi - RS 27º56'38" S and 52º55'23" W 503 m Latossolo Vermelho
Pelotas - RS 31°81'53'' S and 52°46'98'' W 13 m Planossolo Háplico
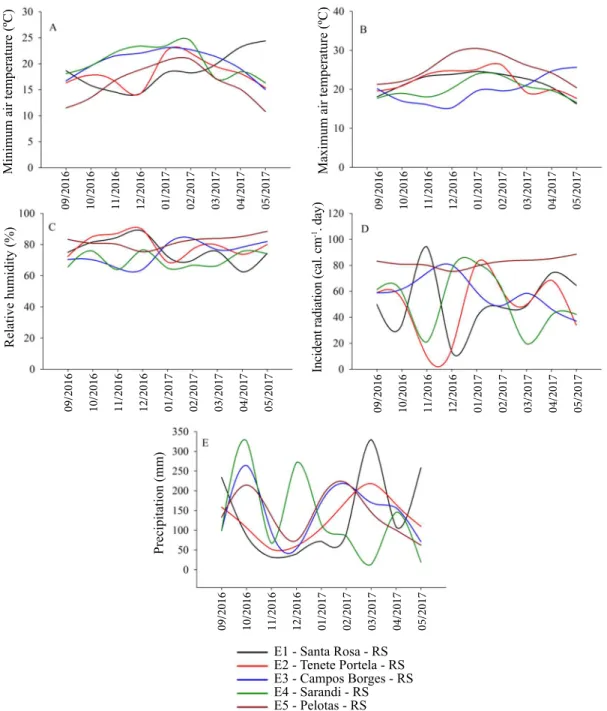
Figure 1. Meteorological data about the maximum and minimum temperature (T 0C), relative humidity (%), solar radiation
incidence (cal. cm-1), and monthly precipitation (mm) during the soybean production cycle.
For measuring the traits of interest, the plants contained in three meters of the three central lines corresponding to the
useful area of the experimental unit were used. The seeds were harvested manually when they had 16% water content and were subsequently dried to 12%, in a standard way for all genotypes and environments.
The seeds were submitted to threshing, cleaning and directed to the Didactic Laboratory of Seed Analysis of the Universidade Federal de Pelotas for evaluation of
physiological attributes.
Percentage of germinated seeds (PG) was determined from
eight subsamples of 50 seeds from each field experimental
unit, being them arranged to germinate on germitest paper
moisturized 2.5 times the mass of the dry substrate. The rolls were conditioned in Biochemical Oxigen Demand (BOD) chamber at constant temperature of 25 °C, and the measurement
was performed eight days after the start of the test, with results
expressed as percentage of normal seedlings (Brasil, 2009).
First germination counting (FC) was performed along the germination test (PG) by counting the normal seedlings
Minimum air temperature (ºC) Maximum air temperature (ºC)
Relative humidity (%)
Incident radiation (cal. cm
-1. day)
Precipitation (mm)
09/2016 10/2016 11/2016 12/2016 01/2017 02/2017 03/2017 04/2017 05/2017 09/2016 10/2016 11/2016 12/2016 01/2017 02/2017 03/2017 04/2017 05/2017
09/2016 10/2016 11/2016 12/2016 01/2017 02/2017 03/2017 04/2017 05/2017 09/2016 10/2016 11/2016 12/2016 01/2017 02/2017 03/2017 04/2017 05/2017
09/2016 10/2016 11/2016 12/2016 01/2017 02/2017 03/2017 04/2017 05/2017
present on the fifth day after sowing (Brasil, 2009).
Length of aerial part (LA) and radicle (LR) were measured
according to procedure described by Nakagawa (1999), obtained from the sowing of 20 seeds arranged in a straight line, in the upper third of the germitest paper already moisturized 2.5
times the mass of the dry substrate, with four replicates of each
field experimental unit placed in Biochemical Oxigen Demand (BOD) chamber at 25 °C. On the eighth day, measurement of
shoot and root were performed using a graduated ruler, with
results expressed in centimeters (cm).
The dry mass of seedlings (DM) was determined by
sampling ten normal seedlings per experimental unit, being
used those from the seedling length test. Measurements were
performed eight days after sowing, and seedling were subjected
to forced ventilation at 80 °C during 24 h (Nakagawa, 1999), with results expressed in grams (g).
The emergence at field (EF) was obtained by means of 400 seeds arranged in four experimental units of 100 seeds, which were sown in rows spaced 0.50 m at depth of four centimeters. After 10 days of sowing, percentage of emerged seedlings (%) was proceeded.
The data were submitted to analysis of variance at 5%
of probability, verifying the homogeneity (Shapiro and Wilk,
1965), homoscedasticity of residual variances Bartllet and additivity model (Ramalho et al., 2012). Afterwards, it was
performed the univariate analysis for the measured traits with
purpose of identifying significant interaction between growing environments x soybean genotypes at 5% of probability. By identifying that all characters presented significant interaction, it was possible to employ a multivariate approach to define a unique tendency of estimates. Therefore, a multivariate
index of vigor was developed based on the ratio between the values observed in each experimental unit weighted by their
respective standard deviations.
The variance components and genetic parameters were
estimated together to identify the specific contributions of each source of variation and treatment levels for the effects of the seed production environment (Carvalho et al., 2017b),
which are: genotypic variance (GV), variance referring to
genotypes x environments interaction (VINT), phenotypic
variance (FV), heritability with broad sense (H²) and genotypic
correlation between the environments (rG) (Cruz et al., 2014).
This index was composed by percentage of germinated
seeds (PG), first germination counting (FC), length of aerial part (LA), length of radicle (LR), dry mass of seedlings (DM) and emergence at field (EF), based on the following equation:
Where: Iv: corresponds to the multivariate index of vigor
for soybean seeds; PGijk: defined as the observed value for the
ith genotype in the jth production environment arranged in the
kth block for the trait first germination counting; FC
ijk: defined as the value observed for the ith genotype in the jth production
environment arranged in the kth block for percentage of
germinated seeds; LAijk: defined as the observed value for the
ith genotype in the jth production environment arranged in the
kth block for dry mass of seedlings; LR
ijk: defined as the value
observed for the ith genotype in the jth production environment
arranged in the kth block for the trait length of aerial part;
DMijk: length of radicle and EFijk: defined as the observed
value for the ith genotype in the jth production environment
arranged in the kth block for the trait emergence at field. S
PG:
corresponds to the standard deviation of the PG trait; SFC:
corresponds to the standard deviation of FC; SLA: corresponds
to the standard deviation of the LA trait; SLR: corresponds to
the standard deviation of the LR trait; SDM: corresponds to the
standard deviation of the trait DM; SCF: corresponds to the
standard deviation of the trait CF.
After the index´s elaboration, it was submitted to
analysis of variance at 5% of probability in order to identify
the interaction between growing environments x soybean
genotypes. When identifying the significance of the interaction, it was proceeded the multivariate method Genotype Main Effects and Genotype Environment Interaction (GGE) biplot
in order to estimate and identify the adaptability and stability of the multivariate index of vigor, according to the model:
IV≜ [((PGijk⁄ )SPG × (FCijk⁄ )SFC × (LAijk⁄ )SLA × (LRijk⁄ )SLR × (DMijk⁄SDM) × (EFijk⁄ ))]SEF
Yij− μ − βj= λ1ξ1jn1j+ λ2ξ2jn2j+ εij
Where: Yij: represents the expected magnitude of the
multivariate index of vigor referring to the ith genotype grown
in the jth seed production environment; μ: corresponds to the
general mean of the multivariate observations of the vigor
index (Yij); βj: evidenced as the main effect attributed to the
jth seed production environment; λ1 and λ2: correspond to principal (PC I) and secondary (PC II) scores determinants
for graphic expression through the main biplot components; ξ1j and ξ2j: are shown as the eigenvectors representing the
ith genotype corresponding to the abscissa axes of PC I and
PC II; εij: expresses the unadjusted residual fraction of the
stochastic statistical model.
Result and Discussion
The analysis of variance revealed significance at 5% of
probability for interaction between seed crop environments
length of aerial part (LA), length of radicle (LR), emergence
at field (FE), and multivariate index of soybean vigor (IV),
demonstrating the possibility of using adaptability and
stability estimates of soybean genotypes for environments.
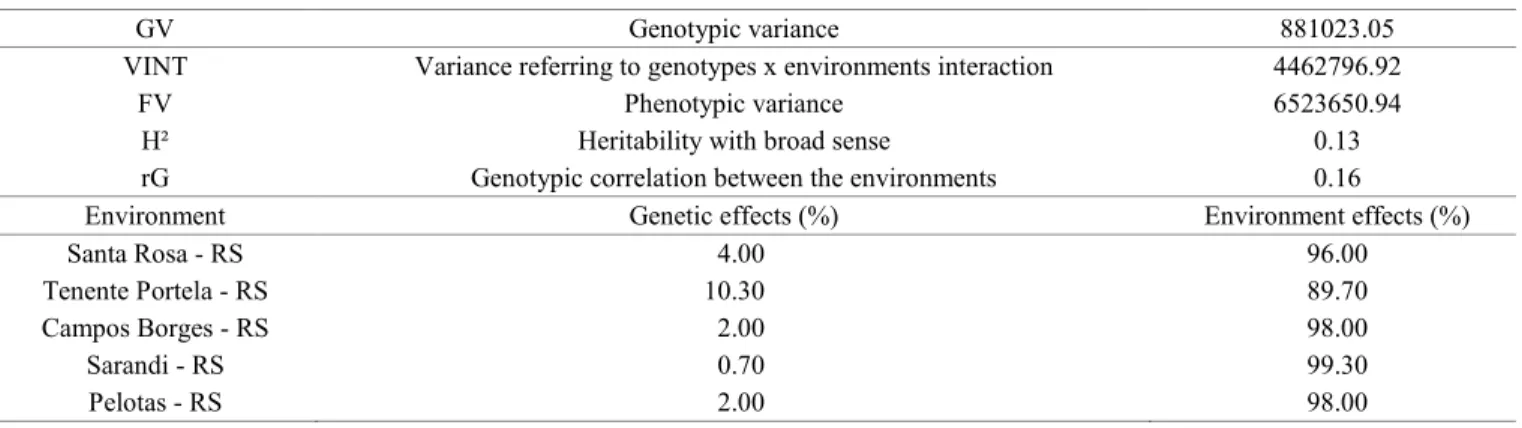
The components of variance obtained (Table 2), indicated
that the genotypic variance (GV) was responsible for 13.5% of the expression of the vigor index. The variance referring to genotype x environment interaction (VINT) was responsible for 68.4% of the index expression, of which 19.7% were attributed to genetic effects. The environmental effect on the vigor index of soybean seeds (H2) was 86.5%, evidencing the great effect of the environment on the physiological quality of soybean seeds. Szareski et al. (2017), evaluating the physiological quality of seeds in different environments, similarly verified that the environment was responsible for more than 60% of the expression of seed vigor index.
Stratifying environments through the relative contribution
of sums of squares (Carvalho et al., 2017b), verified that the environments Tenente Portela - RS (10.3%), Santa Rosa - RS (4.0%), Pelotas - RS (2.0%), Campos Borges - RS (2.0%)
and Sarandi - RS were, respectively, the ones that showed
the most genetic influence. The genetic correlation (Rg) of
genotype performance among seed production environments
(0.16), allows us to identify that the nature of the interaction was complex, culminating in difficulties in the selection and
positioning of genotypes in relation to the environments
tested for this traits (Table 2).
The production of soybean seeds of high performance is an expensive task, since it requires high technology by
the seed producers, and specific environmental conditions,
especially regarding temperature and air relative humidity
after the physiological maturity. At this point, seeds are
disconnected from the mother plant and await the harvest, being exposed to environmental conditions that can often be
unfavorable to their physiological quality, and present great
variation between seed production fields (Peske et al., 2012; Szareski et al., 2018b; Rigo et al., 2018).
The use of Genotype Main Effects and Genotype
Environment Interaction (GGE) applied to the multitrait index of vigor allowed a general explanation of the equivalent statistical
model standard fraction (PCI: 56.92% and PCII: 18.51%) of 75.43% (Figure 2). It is possible to accurately represent the differential effects of soybean genotypes (G) x seed production environments (E) interaction. The Santa Rosa - RS environment (E1) is closely associated to the genotypes A 6411 RG (G12) and BMX Magna RR (G11). For the intrinsic conditions of Pelotas - RS (E5), it was verified the peculiarity of the genotypes AMS Tibagi RR (G10) and TMG 7161 RR (G20). In this context, it
is proved that the inferences obtained reveal genotypes with
potential to be indicated for their specific adaptability.
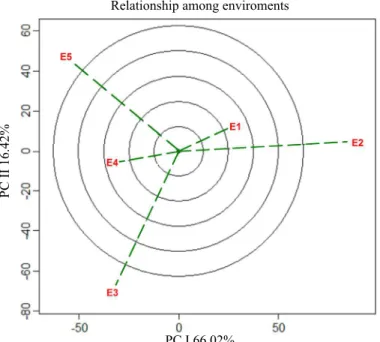
When referring to the stratification of seed production
environments (Figure 3), the standard fraction of the statistical
model was represented by an explicability (PCI: 66.02% and PC II: 16.42) of 82%. In these conditions, it is determined that the environments Santa Rosa - RS (E1) and Sarandi - RS (E4) are associated. It evidences similar edaphoclimatic characteristics, directly reflecting the simultaneous increase of physiological potential of seeds produced in both conditions.
These inferences are proven through the trends of soybean
seed vigor multivariate index.
The environments of Pelotas - RS (E5), Tenente Portela- RS (E2) and Campos Borges – RS (E3) are dissimilar for the multivariate tendencies of seed vigor. It defines the possibility of
these environments be the cause of distortions and abrupt variations
of interaction effects. Thus, it is necessary that inferences taken
for these conditions the cautious in order to minimize errors in the strategic positioning of soybean genotypes among seed production
quality environments fields for high vigor.
Table 2. Estimates of variance components and genetic parameters of the seed vigor index, obtained from 20 soybean genotypes grown in five seed production environments of the State of Rio Grande do Sul.
GV Genotypic variance 881023.05
VINT Variance referring to genotypes x environments interaction 4462796.92
FV Phenotypic variance 6523650.94
H² Heritability with broad sense 0.13
rG Genotypic correlation between the environments 0.16
Environment Genetic effects (%) Environment effects (%)
Santa Rosa - RS 4.00 96.00
Tenente Portela - RS 10.30 89.70
Campos Borges - RS 2.00 98.00
Sarandi - RS 0.70 99.30
Figure 2. GGE biplot referent to the general explicability of soybean genotypes and growing environments for the multivariate index of seed vigor. Environments E1 (Santa Rosa - RS), E2 (Tenente Portela - RS), E3 (Campos Borges - RS), E4 (Sarandi - RS) and E5 (Pelotas - RS). Genotypes G1 (BRS Tordilha RR), G2 (FPS Paranapanema RR), G3 (Fepagro 37 RR), G4 (FPS Solimões RR), G5 (Fepagro 36 RR), G6 (FPS Netuno RR), G7 (FPS Iguaçu RR), G8 (FPS Urano RR), G9 (FPS Júpiter RR), G10 (AMS Tibagi RR), G11 (BMX Magna RR), G12 (A 6411 RG), G13 (BMX Apolo RR), G14 (BMX Potência RR), G15 (BMX Alvo RR), G16 (Roos Camino RR), G17 (BMX Ativa RR), G18 (NA 5909 RG), G19 (BMX Turbo RR) and G20 (TMG 7161 RR).
Figure 3. GGE biplot for the relationships between the tested soybean growing environments. Environments E1 (Santa Rosa - RS), E2 (Tenente Portela - RS), E3 (Campos Borges - RS), E4 (Sarandi - RS) and E5 (Pelotas - RS). Genotypes G1 (BRS Tordilha RR), G2 (FPS Paranapanema RR), G3 (Fepagro 37 RR), G4 (FPS Solimões RR), G5 (Fepagro 36 RR), G6 (FPS Netuno RR), G7 (FPS Iguaçu RR), G8 (FPS Urano RR), G9 (FPS Júpiter RR), G10 (AMS Tibagi RR), G11 (BMX Magna RR), G12 (A 6411 RG), G13 (BMX Apolo RR), G14 (BMX Potência RR), G15 (BMX Alvo RR), G16 (Roos Camino RR), G17 (BMX Ativa RR), G18 (NA 5909 RG), G19 (BMX Turbo RR) and G20 (TMG 7161 RR).
GGE
PC II 18.51%
PC I 56.92%
PC I 66.02%
PC II 16.42%
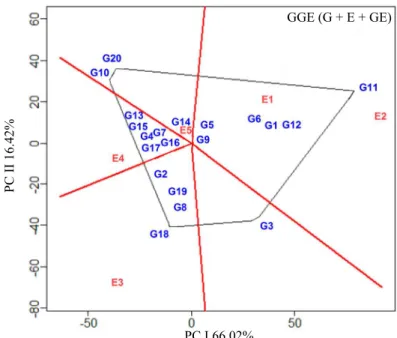
Regarding the joint interpretation of differential additive effects attributed to genotypes and environments, as well as the multiplicative effects of genotype x environment interactions (G + E + (G x E), it was possible to visualize the best specific
performance of genotypes and environments, interconnecting the scores attributed to variation factors from the model and
representing them through a biplot graph (Figure 4), with
the formation of a relative polygon which expresses the maximum performance attributed to the tested genotype (Yan
and Kang, 2003; Yan and Tinker, 2006). Also, the polygon
vertices determine the best genotype for each seed production
environment (Alwala et al., 2010).
Under these conditions, the multivariate index of
soybean seed vigor showed explanation of (PCI: 66.02% e PCII: 16.42%) 82% of the model, being possible to identify
the formation of only one macro environment, which was
composed by Santa Rosa - RS environments (E1) and Tenente Portela - RS (E2). However, the environments of Campos Borges - RS (E3), Sarandi - RS (E4) and Pelotas - RS (E5) did not form macro environments.
Therefore, when a genotype is located inside the macro
environment, it is considered as of specific adaptability for those growing conditions (Yan and Kang, 2003). The definition
of macro environment is attributed through the relation between edaphoclimatic characteristics, managements and similar response of the genotype to variations imposed by the
environment (Woyann et al., 2018). The macro environment corresponding to environments of Santa Rosa – RS (E1) and Tenente Portela – RS (E2) defined that the genotypes BRS Tordilha RR (G1), Fepagro 36 RR (G5), FPS Netuno RR (G6), FPS Júpiter RR (G9), BMX Magna RR (G11) and A 6411 RG (G12) are of specific adaptability to this macro environment. Therefore, under these conditions, it is possible
to increase the physiological potential of seeds through the
use of the genotype BMX Magna RR (G11) due to its high performance for the multivariate seed vigor index.
Regarding the environment of Pelotas - RS (E5), the
production of high performance seeds can be obtained
through the genotypes AMS Tibagi RR (G10), BMX Potência RR (G14) and TMG 7161 RR (G20), being these genotypes considered of specific adaptability to this situation. Under these conditions, the genotypes AMS Tibagi RR (G10) and TMG 7161 RR (G20) are classified as of high vigor. The environment of Sarandi - RS (E4) expresses high performance for seed vigor index, where it was possible to define that the genotype FPS Solimões RR (G4), FPS Iguaçu RR (G7), BMX
Figure 4. GGE biplot representing the “which-won-where” graph, referring to the best performance of a given genotype in each tested seed production environment. Environments E1 (Santa Rosa - RS), E2 (Tenente Portela - RS), E3 (Campos Borges - RS), E4 (Sarandi - RS) and E5 (Pelotas - RS). Genotypes G1 (BRS Tordilha RR), G2 (FPS Paranapanema RR), G3 (Fepagro 37 RR), G4 (FPS Solimões RR), G5 (Fepagro 36 RR), G6 (FPS Netuno RR), G7 (FPS Iguaçu RR), G8 (FPS Urano RR), G9 (FPS Júpiter RR), G10 (AMS Tibagi RR), G11 (BMX Magna RR), G12 (A 6411 RG), G13 (BMX Apolo RR), G14 (BMX Potência RR), G15 (BMX Alvo RR), G16 (Roos Camino RR), G17 (BMX Ativa RR), G18 (NA 5909 RG), G19 (BMX Turbo RR) and G20 (TMG 7161 RR).
GGE (G + E + GE)
PC I 66.02%
Apolo RR (G13), BMX Alvo RR (G15), Roos Camino RR (G16) and BMX Ativa RR (G17) were considered specific for
those growing conditions, however, in this environment no
genotype was considered of high physiological performance.
For Campos Borges - RS (E3), the genotypes FPS
Paranapanema RR (G2), FPS Urano RR (G8), NA 5909 RG (G18) and BMX Turbo RR (G19) were indicated for
the intrinsic conditions of this environment, as well as high physiological performance was attributed by the multitrait
approach for genotype NA 5909 RG (G18). Contradictory results were expressed through the genotype Fepagro 37
RR (G3), as it was not associated with any of the tested
environments. Therefore, five genotypes were necessary to define the polygon referring to high vigor potential, attributing high performance for the genotypes Fepagro 37 RR (G3), AMS Tibagi (G10), BMX Magna RR (G11), NA 5909 RG (G18) and TMG 7161 RR (G20).
In order to identify and discriminate genotypes for mean
effects of seed production environments (Figure 5), the
differential effects of multivariate vigor index interaction were represented (PC I: 67.11% and PC II: 10.88 %) by 77.99%.
Therefore, the behavior of soybean multivariate index for
seed vigor through genotypes FPS Urano RR (G8), BMX Apolo RR (G13), BMX Potência RR (G14) and NA 5909 RG (G18) are closer to the data origin, evidencing that these
treatment levels (these genotypes) contribute minimally to the
differential effects of soybean genotypes x seed production environments interaction. Similarity was observed among the genotypes FPS Solimões RR (G4), Fepagro 36 RR (G5), FPS Jupiter RR (G9), AMS Tibagi RR (G10), BMX Alvo RR (G15) and BMX Ativa RR (G17), being them closely related to the performance of the environment Pelotas - RS (E5).
The multivariate definitions indicate that the genotype A 6411 RG (G12) is defined as the one closest to the ideotype in the tested environments, and along with the genotype TMG 7161 RR (G20) are related to the environment of Sarandi - RS (E4). For Campos Borges - RS (E3) the genotypes BRS Tordilha RR (G1) and Fepagro 36 RR (G5) are defined as
Figure 5. GGE biplot for the discrimination and representativeness of soybean genotypes and production environments for the multivariate index of seed vigor. Environments E1 (Santa Rosa - RS), E2 (Tenente Portela - RS), E3 (Campos Borges - RS), E4 (Sarandi - RS) and E5 (Pelotas - RS). Genotypes G1 (BRS Tordilha RR), G2 (FPS Paranapanema RR), G3 (Fepagro 37 RR), G4 (FPS Solimões RR), G5 (Fepagro 36 RR), G6 (FPS Netuno RR), G7 (FPS Iguaçu RR), G8 (FPS Urano RR), G9 (FPS Júpiter RR), G10 (AMS Tibagi RR), G11 (BMX Magna RR), G12 (A 6411 RG), G13 (BMX Apolo RR), G14 (BMX Potência RR), G15 (BMX Alvo RR), G16 (Roos Camino RR), G17 (BMX Ativa RR), G18 (NA 5909 RG), G19 (BMX Turbo RR) and G20 (TMG 7161 RR).
Discrimitiness x Representativeness
PC I 67.11%
similar, being them of determined growth habit. Discrepant
physiological performances were expressed through the
genotypes BMX Magna RR (G11) and Tenente Portela -
RS (E2), which showed abrupt changes in the multivariate index of vigor, dissociating from the other levels of treatment attributed to the variation factors of soybean genotypes and
growing environments.
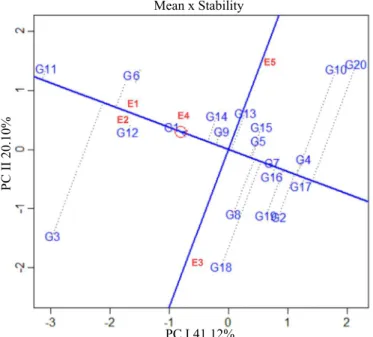
The estimates of phenotypic stability reflect the ability
to predict results in the next season that is, it indicates the response predictability of a given genotype in those previously
defined favorable or unfavorable growing conditions. These estimates showed that (Figure 6) the method allowed to represent 61.22% (PC I: 41.12% and PC II: 20.10%) of the interaction effects through the standard fraction of the data.
Thus, the ideal genotype was weighted by the general average of all environments perpendicularly to the largest magnitudes of each environment deviation, where the genotype BRS
Tordilha RR (G1) was listed as presenting excellent stability and predictability for the multivariate index of vigor. The genotypes BMX Magna RR (G11), FPS Jupiter RR (G9), BMX Potência RR (G14) and FPS Netuno RR (G6) were
stable with high predictability in relation to the general scope
of tested environments.
The genotype Fepagro 37 RR (G3) revealed instability for
the tested environments, as well as the environments Campos
Borges – RS (E3) and Pelotas – RS (E5) were considered unstable for the multitrait approach of soybean seed vigor. The genotypes FPS Iguaçu RR (G7), FPS Solimões RR (G4), Fepagro 36 RR (G5), Roos Camino RR (G16), BMX Ativa RR (G17) and BMX Alvo RR (G15) were stable, however with low expressivity for the multivariate index.
The Genotype Main Effects and Genotype Environment
Interaction (GGE) method applied in function of the seed
vigor multivariate index allows to explain more than 75% of adaptability and stability estimates. The results and
multivariate tendencies obtained in this study are essential
for defining the effects of genotype x environment interaction
on the strategic positioning of soybean genotypes for high
performance of seed quality.
Conclusions
The seed production environments of Tenente Portela - RS and Santa Rosa - RS soybeans are characterized as the environments that express the highest magnitude for seed vigor index, however biometrically Sarandi - RS has been
Figure 6. GGE biplot means x stabilities indicating the rank of all 20 soybean genotypes, with their respective stabilities related to the multivariate index of seed vigor. Environments E1 (Santa Rosa - RS), E2 (Tenente Portela - RS), E3 (Campos Borges - RS), E4 (Sarandi - RS) and E5 (Pelotas - RS). Genotypes G1 (BRS Tordilha RR), G2 (FPS Paranapanema RR), G3 (Fepagro 37 RR), G4 (FPS Solimões RR), G5 (Fepagro 36 RR), G6 (FPS Netuno RR), G7 (FPS Iguaçu RR), G8 (FPS Urano RR), G9 (FPS Júpiter RR), G10 (AMS Tibagi RR), G11 (BMX Magna RR), G12 (A 6411 RG), G13 (BMX Apolo RR), G14 (BMX Potência RR), G15 (BMX Alvo RR), G16 (Roos Camino RR), G17 (BMX Ativa RR), G18 (NA 5909 RG), G19 (BMX Turbo RR) and G20 (TMG 7161 RR).
Mean x Stability
PC I 41.12%
defined as the optimal environment for the production of high vigor seeds according to the tested genotypes.
High seed vigor index were expressed for the genotypes
TMG 7161 RR, AMS Tibagi RR, BMX Magna RR, Fepagro 37 RR and NA 5909 RG.
The differential effects of the genotypes x production environments interaction of soybean seeds influenced by more than 68% the vigor index of the seeds produced.
Acknowledgments
To Coordenação de Aperfeiçoamento de Pessoal de Nível Superior (CAPES) and the Conselho Nacional de
Desenvolvimento Científico e Tecnológico (CNPq) for the
scholarship granted.
References
ALWALA, S.; KWOLEK, T.; PHERSON, M.; PELLOW, J.; MEYER, D. A comprehensive comparison between Eberhart and Russel joint regression and GGE biplot analyses to identify stable and high yielding maize hybrids. Field Crops Research, v.119, n.2-3, p.225-230, 2010. https://www.sciencedirect.com/science/article/pii/ S0378429010001887?via%3Dihub
BRASIL. Ministério da Agricultura, Pecuária e Abastecimento.
Regras para análise de sementes. Ministério da Agricultura,
Pecuária e Abastecimento. Secretaria de Defesa Agropecuária. Brasília: Mapa/ACS, 2009. 399p.
CARVALHO, I.R.; NARDINO, M.; DEMARI, G.H.; BAHRY, C.A.; SZARESKI, V.J.; PELISSARI, G.; FERRARI, M.; PELEGRIN, A.J.; OLIVEIRA, A.C.; MAIA, L.C.; SOUZA, V.Q. Bisegmented regression, factor analysis and AMMI applied to the analysis of adaptability and stability of soybean. Australian Journal of Crop Science, v.10, p.1410-1416, 2016. https://doi.org/ 10.21475/ajcs.2016.10.10.pne63
CARVALHO, I.R.; NARDINO, M.; DEMARI, G.H.; SZARESKI, V.J.; FOLLMANN, D.N.; PELEGRIN, A.J.; FERRARI, M.; OLIVOTO, T.; BARBOSA, M.H.; OLIVEIRA, A.C.; MAIA, L.C.; SOUZA, V.Q. Relations among phenotypic traits of soybean pods and growth habit. African Journal of Agricultural Research, v.12, p.450-458, 2017a. https://doi.org/ 10.5897/AJAR2016.11660 CARVALHO, I.R.; NARDINO, M.; SOUZA, V.Q. Melhoramento e cultivo da soja. Porto Alegre: Cidadela, 2017b. 248p.
CRUZ, C.D.; CARNEIRO, P.C.S.; REGAZZI, A.J. Modelos biométricos aplicados ao melhoramento genético. Viçosa: Editora UFV, 2014. 668p.
GABRIEL, M.; MURARO, D.S.; ROSA, G.M.; WASTOWSKI, A.D.; KULCZYNSKI, S.M.; SILVA, J.C.; CARVALHO, I.R.; SZARESKI, V.J.; STUMM, J.O. Chemical control of Asian soybean rust and its effect in the yield and quality of soybean seeds.
Journal of Agricultural Science, v. 10, p. 518-526, 2018. https://doi.
org/10.5539/jas.v10n10p518
KEHL, K.; SZARESKI, V.J.; CARVALHO, I.R.; NARDINO, M.; DEMARI, G.H.; ROSA, T.C.; GUTKOSKI, L.C.; PEDO, T.; AUMONDE, T.Z.; SOUZA, V.Q.; ZIMMER, P.D.; MENEGHELLO, G.E. Genotype environment interaction under industrial and physiological quality of wheat seeds. International Journal of Current Research, v.8, p.38461-38468, 2016. http://www.journalcra.com/sites/default/files/17369.pdf KOCH, F.; AISENBERG, G.R.; SZARESKI, V.J.; DEMARI, G.H.; CARVALHO, I.R.; NARDINO, M.; LAUTENCHLEGER, F.; WEBBER, T.A.; SOUZA, V.Q.; CARON, B.O.; VILLELA, F.A.; AUMONDE, T.Z.; PEDO, T. Yield and physiological quality of seeds of different bean genotypes produced in the off-season period in subtropical climate. Australian Journal of Crop Science, v.12, p.669-675, 2018. https://doi.org/10.21475/ajcs.18.12.05.PNE610 MARCOS-FILHO, J. Fisiologia de sementes de plantas cultivadas. Londrina: ABRATES, 2015. 660p.
NAKAGAWA, J. Testes de vigor baseados no desempenho das plântulas. In: KRZYZANOSKI, F.C.; VIEIRA, R.D.; FRANÇA-NETO, J.B. (Ed.). Vigor de sementes: conceitos e testes. Londrina: ABRATES, 1999. p.2.1-2.24.
PELEGRIN, A.J.; CARVALHO, I.R.; NARDINO, M.; FERRARI, M.; SZARESKI, V.J.; BELLE, R.; MEIRA, D.; SOUZA, V.Q. Performance of resistant soybean to asian rust in different environments in RS. International Journal of Current Research, v.8, p.38398-38401, 2016. https://www.journalcra.com/sites/default/ files/17225.pdf
PESKE, S.T.; VILLELA, F.A.; MENEGHELLO, G.E. Sementes:
Fundamentos Científicos e Tecnológicos. 3 ed. Pelotas: UFPel, 2012.
573p.
RAMALHO, M.A.P.; FERREIRA, D.F.; OLIVEIRA, A.C.
Experimentação em genética e melhoramento de plantas. UFLA:
Lavras, 2012. 305 p.
RIGO, G.A.; SCHUCH, L.O.B.; BARROS, W.S.; VARGAS, R.L.; SZARESKI, V.J.; CARVALHO, I.R.; PIMENTEL, J.R.; TROYJACK, C.; JAQUES, L.A.; ROSA, T.C.; SOUZA, V.Q.; AUMONDE, T.Z.; PEDO, T. Effects of macronutrients in the physiological quality of soybean seeds. Journal of Agricultural
Science, v.10, p.312, 2018. https://doi.org10.5539/jas.v10n5p312
SHAPIRO, S.S.; WILK M.B. An Analysis of Variance Test for Normality (Complete Samples). Biometrika, v.52, p.591-611, 1965. https://doi.org10.2307/2333709
STROBEL, T.; KOCH, F.; AISENBERG, G.R.; SZARESKI, V.J.; CARVALHO, I.R.; NARDINO, M.; SOUZA, V.Q.; VILLELA, F.A.; PEDO, T.; AUMONDE, T.Z. Physical and physiological quality of soybean seeds harvested under different trial systems after storage period. Australian Journal of Basic and Applied Sciences, v.10, p.124-130, 2016. http://www.ajbasweb.com/old/ajbas/2016/ August/124-130.pdf
STRECK, E.V.; KÄMPF, N.; DALMOLIN, R.S.; KLAMT, E.; NASCIMENTO, P.C.; SCHNEIDER, P.; GIASSON, É.; PINTO, L.F.S.
This is an Open Access article distributed under the terms of the Creative Commons Attribution License, which permits unrestricted use, distribution, and reproduction in any medium, provided the original work is properly cited.
SZARESKI, V.J.; CARVALHO, I.R.; KEHL, K.; LEVIEN, A.M.; NARDINO, M.; DEMARI, G.H.; LAUTENCHLEGER, F.; SOUZA, V.Q.; PEDO, T.; AUMONDE, T.Z. Univariate, multivariate techniques and mixed models applied to the adaptability and stability of wheat in the Rio Grande do Sul State. Genetics and Molecular Research, v.16, p.1-13, 2017. http://www.funpecrp.com.br/gmr/ year2017/vol16-3/pdf/gmr-16-03 gmr.16039735.pdf
SZARESKI, V.J.; CARVALHO, I.R.; DEMARI, G.H.; PELISSARI, G.; PELEGRIN, A.J.; BARBOSA, M.H.; ROSA, T.C.; SANTOS, N.L.; MARTINS, T.; NARDINO, M.; PEDO, T.; SOUZA, V.Q.; AUMONDE, T.Z. Path analysis applied to agronomic traits of contrasting growth habit soybeans. Australian Journal of Crop Science, v.12, p.531-538, 2018a. http://www.cropj.com/ carvalho_12_4_2018_531_538.pdf
SZARESKI, V.J.; CARVALHO, I.R.; KEHL, K.; LEVIEN, A.M.; ROSA, T.C.; BARBOSA, M.H.; DEMARI, G.H.; PIMENTEL, J.R.; TROYJACK, C.; MARTINAZZO, E.G.; SOUZA, V.Q.; VILLELA, F.A.; PEDO, T.; AUMONDE, T.Z. Wheat seeds yield in Brazil: Phenotypic and predicted genetic approaches for genotype ranking. Genetics and Molecular Research, v.17, p.1-13, 2018b. https://doi. org/10.4238 / gmr18026
SZARESKI, V.J.; CARVALHO, I.R.; KEHL, K.; LEVIEN, A.M.; NARDINO, M.; DELLAGOSTIN, S.M.; DEMARI, GH.; LAUTENCHLEGER, F.; VILLELA, F.A.; PEDO, T.; SOUZA, V.Q.; AUMONDE, T.Z. Evaluation of the adaptability and stability of wheat genotypes using a phenotypic index of seed vigor. Pesquisa
Agropecuária Brasileira, v.53, p.727-735, 2018c. https://doi.
org/10.1590/S0100-204X2018000600009
VASCONCELOS, E.S.; REIS, M.S.; SEDIYAMA, T.; CRUZ, C.D. Genetics parameters estimates of seeds physiologic quality of soybean genotypes grown in different areas of Minas Gerais.
Semina: Ciências Agrárias, v.33, n.1, p.65-76, 2012. http://www.uel.
br/revistas/uel/index.php/semagrarias/article/view/5448
WOYANN, L.G.; BENIN, G.; STORCK, L.; TREVIZAN, D.M.; MENEGUZZI, C.; MARCHIORO, V.S.; TONATTO, M.; MADUREIRA, A. Estimation of missing values affects important aspects of GGE biplot analysis. Crop Science, v.57 p.40-52, 2017. https://doi.org/10.2135/cropsci2016.02.0100
WOYANN, L.G.; MILIOLI, A.S.; BOZI, A.H.; DALLO, S.C.; MATEI, G.; STORCK, L.; BENIN, G. Repeatability of associations between analytical methods of adaptability, stability, and productivity in soybean. Pesquisa Agropecuária Brasileira, v.53, p.63-73, 2018. http://www.scielo.br/scielo.php?script=sci_ arttext&pid=S0100204X2018000100063&lng=en&tlng=en YAN, W.; KANG, M.S. GGE Biplot analysis: a graphical tool for
breeders, geneticists, and agronomists. Flórida: Boca Raton, 2003.
286p.
YAN, W.; TINKER, A. Biplot analysis of multi environment trial data: principles and applications. Canadian Journal of Plant Science, v.86, n.3, p.623-645, 2006. http://www.nrcresearchpress. com/doi/10.4141/P05-169#.W1327dVKjIU