https://doi.org/10.1590/0004-282X20170183 ARTICLE
A new motor screening assessment for children
at risk for motor disorders: construct validity
Uma nova avaliação de triagem motora para escolares de risco para transtorno motor:
validade de constructo
Paola Matiko Martins Okuda1, Melissa Pangelinan2, Carlo Chiorri3, Simone Aparecida Capellini4, Hugo Cogo–Moreira1
1Universidade Federal de São Paulo, Departamento de Psiquiatria e Psicologia, São Paulo SP, Brasil; 2Auburn University, School of Kinesiology, Auburn, AL, USA;
3University of Genoa, Department of Educational Sciences, Genova, Italy;
4Universidade do Estado de São Paulo, Departamento de Ciências da Fala e da Audição, Marília SP, Brasil;
Correspondence: Paola Matiko Martins Okuda; Rua Borges Lagoa, 570/1º Andar; 04038–000 São Paulo SP, Brasil; E–mail: paolaokuda@yahoo.com.br Support: Provided by the São Paulo Research Foundation – FAPESP (Process nº. 2015/04619–0) and the National Counsel of Technological and Scientific Development – CNPq (Process nº. 475711/2009–2).
Conflict of interest: There is no conflict of interest to declare.
Received 25 July 2017; Received in final form 10 October 2017; Accepted 28 October 2017. ABSTRACT
Objective: To develop a motor screening assessment and provide preliminary evidence of its psychometric properties. Methods: A sample of 365 elementary school students was assessed, with structural equation modeling applied to obtain evidence of the adequacy of the factor structure of the motor screening assessment. As well, differential item functioning was used to evaluate whether various identifiable subgroups of children (i.e., sex and grade) perform particular tasks differently. Results: Overall, girls obtained higher scores than boys while, for both sexes, the assessment scores increased with age. Furthermore, differential item function analysis revealed that the precision of the test was highest for those with moderate to low motor performance, suggesting that this tool would be appropriate for identifying individuals with movement difficulties. Conclusion: Although further tests of its psychometric properties are required, the motor screening assessment appears to be a reliable, valid, and quickly–administered tool for screening children’s movements.
Key words: motor skills disorders; psychometrics.
RESUMO
Objetivo: Desenvolver uma avaliação de triagem motora (ATM) e fornecer evidências preliminares de suas propriedades psicométricas.
Métodos: 365 alunos do ensino fundamental foram avaliados. Foi utilizado modelagem de equações estruturais para evidenciar a adequação da estrutura fatorial da ATM. A função diferencial do item foi utilizada para avaliar tarefas podem funcionar de forma diferente para subgrupos (ou seja, sexo e escolaridade). Resultados: Em geral, as meninas obtiveram pontuações mais altas do que os meninos e, em ambos os sexos, os escores da avaliação aumentaram com a idade. A análise da função diferencial do item revelou que a precisão do teste foi maior para aqueles com desempenho motor baixo a moderado, sugerindo que essa ferramenta seria apropriada para identificar aqueles com dificuldades motoras. Conclusão: Embora sejam necessários novos testes de suas propriedades psicométricas, a ATM parece ser uma ferramenta confiável, válida e rápida de administrar como rastreio motor para crianças.
Palavras–chave: transtornos das habilidades motoras; psicometria.
The identification of movement difficulties in children is crucial for understanding the biological basis of neurodevel
-opmental disorders, such as devel-opmental coordination dis
-order1
and neurological soft signs2
, which affect daily activi
-ties performed at home (e.g., fastening buttons, tying shoes, using utensils), at school (e.g., writing, using scissors), and during recreation/sports (e.g., balance, ball skills, etc.), and can persist into adulthood, bringing a risk of psychological and psychiatric distress3,4. Furthermore, this identification
is also important for implementing early intervention and effective rehabilitation treatment plans.
Currently, several standardized motor skill assessments are widely used to identify children with movement difficul
-ties, including the Movement Assessment Battery for Children, (second edition) (MABC–2)5
, the Bruininks–Oseretsky Test of Motor Proficiency (second edition) (BOT–2)6
, the Test of Gross Motor Development (second edition)7
, and the Peabody Developmental Motor Scales (second edition)8
assessments comprise a different number of tasks, and assess slightly different skills, such as fine motor skills, manual dex
-terity, and/or gross motor skills (e.g., object control, ball skills, and static/dynamic balance, respectively).
The internal validity of each of these scales has been sup
-ported by confirmatory factor analysis. However, although the MABC–2, BOT–2 (full and short form), Test of Gross Motor Development–2, and Peabody Developmental Motor Scales–2 exhibit good psychometric properties, they have practical limitations, as they require considerable time to administer (between 30 and 45 minutes), are expensive for low–income and middle–income countries, and generally must be admin
-istered by occupational therapists, physical therapists, and/or physical education teachers who have formal training in motor development. Moreover, some tasks that are relevant to in–home and school activities are not directly measured by these assessments (i.e., fastening buttons and tying shoes).
Furthermore, although parent– and teacher–reported checklists such as the Developmental Coordination Disorder Questionnaire ’079
and the MABC–2 Checklist5
may be used to identify children with possible motor difficulties and provide insights into the methods by which poor motor performance interferes with common activities at home and at school, questionnaires may be considered subjective measures.
Thus, objective tools are necessary to properly and thor
-oughly assess movement difficulties in children, as well as both the presence and the severity of any impairment found10.
Moreover, such a tool would be applicable now more than ever as, in recent years, the investment in early childhood initiatives in low–income and middle–income countries has increased, with a focus on prevention, and improvement of health and developmental trajectories in childhood11
. Considering the above, to address this gap, the overarch
-ing aim of the current study was to develop a highly infor
-mative motor screening assessment (MSA) tool for children with a high risk of having a motor disorder, and to provide preliminary evidence of its psychometric properties. The need for such a simple test has been regularly mentioned by professionals from health and education areas due to the lack, in certain countries, of specialized professionals, such as occupational therapists and physiotherapists, in schools, as well as in basic healthcare.
METHODS
This study consisted of two stages: i) the development of the assessment, and ii) the assessment of its psycho
-metric properties.
Development of motor screening assessment
To begin, the items included in the assessment were created based on clinical observations of elementary school students in the school environment, focusing on
motor–performance aspects during the execution of tasks in physical education classes, during recreational time, in the classroom, and on the school premises (bathroom, cafeteria).
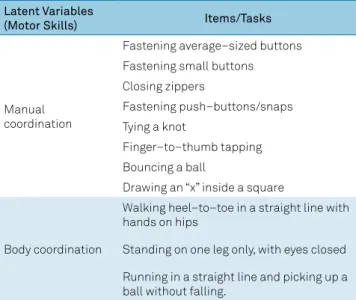
After conducting a comprehensive review of the literature and holding specialist consultations (with one occupational therapist, five teachers, one speech language pathologist, and one pediatrician), the first version of the MSA was developed, featuring 11 items and designed to assess two domains: man
-ual coordination and body coordination (Table 1).
For the literature review, two key areas of difficulty that are relevant for motor performance were considered: fine motor skills (manual skills/manipulation skills)12,13,14,15,16, and
balance/body control17,18,19,20.
The items in the MSA focus on skills that are known to be deficient in children with motor–coordination difficul
-ties (e.g., fastening buttons, tying shoes, and dynamic bal
-ance)21,22,23; however, the tool can also be adapted to assess
additional motor skills, which are considered to be relevant and clinically useful functions with respect to the enhanced identification of motor delays or difficulties10.
Further, regarding the theoretical construct, some of the task domains are similar to other common motor perfor
-mance assessments that were used as references, such as the MABC–25
and the BOT–26
; however, none of the tasks used to test manual coordination resemble the tasks contained in the BOT–2 and MABC–2.
The MSA items are evaluated using a three–point rating scale, indicating each child’s degree of performance in a given task; here, “0” equals “did not perform” (meaning the child did not perform the required test), “1” equals “low performance” (the child performed poorly), and “2” equals “normal perfor
-mance” (the child performed properly). To limit subjectivity in terms of task scoring, for each task a detailed description is provided for the scorer concerning aspects to observe and consider when scoring the items (Appendix).
Table 1. Composition (latent variables and items) of the motor screening assessment.
Latent Variables
(Motor Skills) Items/Tasks
Manual coordination
Fastening average–sized buttons Fastening small buttons Closing zippers
Fastening push–buttons/snaps Tying a knot
Finger–to–thumb tapping
Bouncing a ball
Drawing an “x” inside a square
Body coordination
Walking heel–to–toe in a straight line with hands on hips
Standing on one leg only, with eyes closed
The MSA was developed to be a standardized procedure, quantitatively assessing the motor skills of children aged between five years and 10 years and 11 months. It was nec
-essary that this new assessment tool be quick (taking less than 15 minutes) and easy to administer and to be applicable to clinical, academic, and research contexts; that is, profes
-sionals from health and education areas (teachers, clinicians, and/or researchers), and those who do not have formal train
-ing in motor development or the assessment of motor per
-formance, should be able to use this tool to test children in environments such as the home or school, to determine their performance on simple tasks that they may find difficult.
Assessment of the psychometric properties of the MSA
Participants and procedure
This research was approved by the Ethics Committee of Research at the Federal University of São Paulo. At the begin
-ning of the study, the parents of each participant completed and signed an informed consent form.
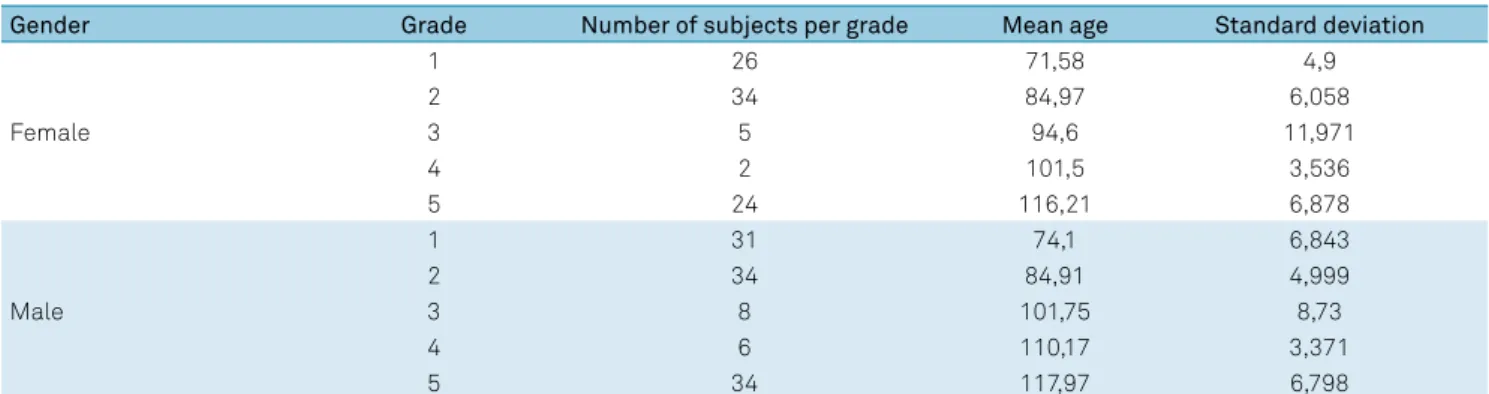
The sample comprised 365 elementary school students (53.7% males: n = 196) ranging from grades 1–5 ( five years to 10 years 11 months) from one school in the State of São Paulo. The descriptive statistics of the participants are pre
-sented in Table 2.
Using school records and a parental questionnaire, we selected participants with no pre–, peri–, or post–natal dif
-ficulties, no delay in terms of neuropsychomotor or language development, no behavioral problems, and no diagnosis of intellectual or physical disability, including pervasive develop
-mental disorder and general medical conditions such as cere
-bral palsy, muscular dystrophy, and hemiplegia. All partici
-pants were assessed individually during school hours; the total testing time for the MSA was, on average, 15 minutes.
As this work was a preliminary study, all of the children were assessed by a single trained occupational therapist who had experience administering motor assessments and who participated in developing the MSA.
Statistical analyses
To investigate the factor structure of the MSA, a cross–validation approach was used. First, exploratory structural equation modeling (ESEM) was performed using data sourced from one side of a random split of the total sam
-ple (n = 173). Similar to exploratory factor analysis, all factor loadings and factor correlations were estimated by ESEM; fur
-ther, similar to a confirmatory factor analysis, ESEM provides parameter estimates, standard errors, goodness–of–fit statis
-tics, and modification indices24. Then, after an adequate mea
-surement model was found, confirmatory factor analysis was performed using data from the other side of the random split (n = 192). Since the items were categorically ordered, Mplus 7.0’s weighted least squares mean– and variance–adjusted estimator function25
was used.
The following fit indices were used to evaluate the model fit for both the ESEM and confirmatory factor analysis: chi–square, comparative fit index (CFI), Tucker–Lewis Index (TLI), root mean square error of approximation (RMSEA), and weighted root mean square residual (WRMR). For both the CFI and TLI, values greater than 0.90 and 0.95 were considered acceptable and optimal fits to the data, respec
-tively; for the RMSEA, values less than 0.08 and 0.06 were considered reasonable and optimal fits to the data, respec
-tively; and for the WRMR, values near or below 0.90 were considered adequate26
.
To evaluate the association of background variables with factor and item scores (the invariance of the model) multiple indicators, multiple causes (MIMIC) models were used; this also allowed us to verify whether the covariates had a significant direct effect on the latent variables, which would indicate population heterogeneity. First, the fac
-tor scores for sex, grade, and the sex–by–grade interaction were regressed. This allowed us to test whether the factor scores varied as a function of these variables. If this were the case, it would mean that normative scores account
-ing for age and/or sex would be needed. Second, analyz
-ing the regression of item scores for the background vari
-ables enabled the testing of differential item functioning;
Table 2. Mean ages in months and standard deviation for gender and grade.
Gender Grade Number of subjects per grade Mean age Standard deviation
Female
1 26 71,58 4,9
2 34 84,97 6,058
3 5 94,6 11,971
4 2 101,5 3,536
5 24 116,21 6,878
Male
1 31 74,1 6,843
2 34 84,91 4,999
3 8 101,75 8,73
4 6 110,17 3,371
5 34 117,97 6,798
this also allowed us to verify whether the covariates had a significant direct effect on an indicator (by considering group differences in terms of each indicator’s threshold). If the regression coefficients of these variables were found to be significant, this would mean that age and/or sex differ
-ences in item scores are not fully explained by differ-ences in factor scores once these were kept constant; thus, the item in question could not be considered equivalent for all sex and/or age categories27
.
Finally, we used a total information curve to verify the precision (i.e., amount of information) provided by each latent trait across the full range of that trait (e.g., from low to high performance). The precision of a given test is not constant across the range of a latent trait, and inspection of the total information curve affords the determining of the range of each latent trait, which results in higher pre
-cision regarding the overall motor performance. Moreover, if the total information curve shows that the greatest amount of information relates to children with low latent traits, this would suggest that the MSA is an appropriate and accurate measure for those with poor motor perfor
-mance and, consequently, may be an appropriate screen
-ing tool for identify-ing individuals at risk of hav-ing devel
-opmental coordination disorder.
RESULTS
We initially tested a two–factor ESEM model on the first random split of participants, applying the structure presented in Table 1. However, the results suggested an over–fit (X2
(34) = 33.95, p = 0.470; CFI = 1.00, TLI = 1.00,
RMSEA = 0.00, WRMR = 0.57); moreover, only two items loaded on the second factor (walking heel–to–toe and sin
-gle–leg balance), while other items had either substantial factor loadings (i.e., larger than 0.30) on both factors, or no substantial factor loadings at all. Then, a one–factor ESEM model was tested, and showed an acceptable fit (X2
(44) = 54.45, p = 0.156; CFI = 0.95, TLI = 0.93, RMSEA
= 0.04, WRMR = 0.77). These results suggested that a one–factor measurement model was adequate, despite the initial hypothesis. However, not all items in this model had substantial loading (> 0.30); hence, we removed the items with the lowest loading and then tested the fit of the model again (the three items removed were: closing zippers, bouncing a ball, and drawing an “x”). As a result, the one–factor model with the remaining eight items was found to have an excellent fit (X2
(20) = 22.57, p = 0.310;
CFI = 0.98, TLI = 0.98, RMSEA = 0.03, WRMR = 0.64). We then tested the fit of this model using the data from the other side of the random split of partici
-pants. Here, we found that the fit was not acceptable (X2
(20) = 39.22, p = 0.006; CFI = 0.90, TLI = 0.87, RMSEA = 0.07,
WRMR = 0.87) and that one item (single–leg balance) had
no significant factor loading (0.13, p = 0.155); however, when this item was removed, the fit of the model was found to be optimal (X2
(14) = 20.16, p = 0.125; CFI = 0.97, TLI
= 0.95, RMSEA = 0.05, WRMR = 0.67), and a similar result was obtained when data from the first side of the random split of participants were used (X2
(14)= 9.02, p = 0.830; CFI
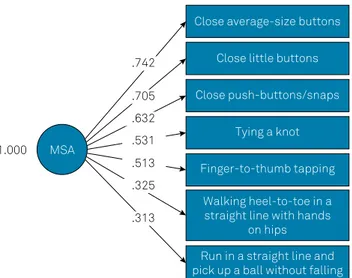
= 0.99, TLI = 0.99, RMSEA = 0.04, WRMR = 0.43). Thus, the final assessment comprised a one–factor ESEM model featuring seven items (Figure 1); the reliability of the MSA score in the total sample, computed as ordinal alpha28
, was 0.73.
Figure 2 shows the parameter estimates, sourced by applying the MIMIC model and in which the factor score
Close average-size buttons
Close little buttons
Close push-buttons/snaps
MSA
1.000
Tying a knot
Finger-to-thumb tapping
Walking heel-to-toe in a straight line with hands
on hips
Run in a straight line and pick up a ball without falling
.632
.531
.513
.325
.313 .705 .742
Figure 1. Confirmatory Factor Analysis for the motor screening assessments (MSA) and the respective factor loading for the 7 items, showing the association between the items and the latent variable (the higher the factor loading, the stronger associated with MSA).
Close average-size buttons
Close little buttons
Close push-buttons/snaps Sex
Grade
Sex x Grade
Tying a knot
Finger-to-thumb tapping
Walking heel-to-toe in a straight line with hands
on hips
Run in a straight line and pick up a ball without falling
0.59*** 0.39***
0.29**
0.36** 1.02**
MSA
-0.55**
0.09 0.19*
0.65*** 1.25*** 1.00
was regressed on background variables, for the MSA with a reduced number of items; the model had an ade
-quate fit (X2
(32) = 48.73, p = 0.029; CFI = 0.94, TLI = 0.92,
RMSEA = 0.04, WRMR = 0.87). Notably, significant effects of sex (girls scoring higher than boys) and grade were found (scores increased as a function of age), while the interaction was not significant, meaning that the model was non–invariant.
Table 3 shows the parameter estimates for the MIMIC model used to test differential item functioning; here, the fit of the overall model was found to be excellent (X2
(14)
= 17.90, p = 0.211; CFI = 0.99, TLI = 0.96, RMSEA = 0.03, WRMR = 0.50). For four items ( fastening differently sized buttons and tying knots), even when the MSA score remained constant, we found sex had a significant effect, with girls scoring higher than boys. Furthermore, the grade was found to have significant effects for three items: tying knots, walking heel–to–toe, and running in a straight line. This suggested that scores in these items increased as a function of age, regardless of the score for the latent motor performance factor. No interaction effects were found.
Taken together, these results suggested the need for sex– and grade–specific normative scores; thus, Table 4 shows the normative scores for the current sample, which was not representative.
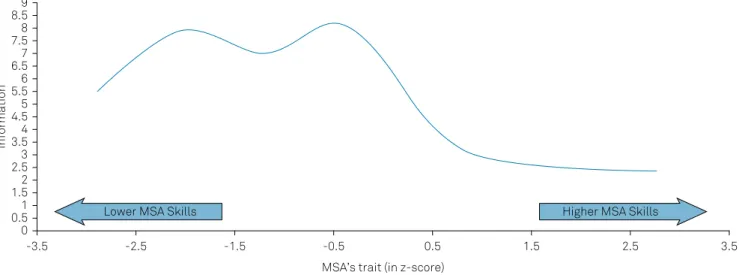
The total information curve (Figure 3) for the latent traits of the seven items showed that the MSA provided more precise estimates (i.e., higher information values) in the lowest–to–middle range of each latent trait (i.e., z–score = –2.5 and –0.5). This meant that the assessment could capture a greater amount of information among par
-ticipants with poor motor skills.
Table 3. Standardized+ regression coefficients for item scores
with respect to sex, grade, and their interaction with the MIMIC model used to test differential item functioning.
Item Sex Grade Interaction
Fasten average–sized
buttons –0.60** –0.06 0.29
Fasten small buttons –0.71** 0.19 –0.04
Fasten push–buttons/
snaps –0.45* 0.10 0.12
Tie a knot –0.43* 0.22* 0.04
Finger–to–thumb
tapping –0.20 0.14 0.11
Walking heel–to–toe in a straight line with hands on hips
0.10 0.19** 0.11
Running in a straight line and picking up a ball without falling
–0.19 0.18* –0.20
*p < 0.05; **p < 0.01; +standardization using the variance of the motor
screening assessment. MIMIC: multiple indicators, multiple causes model
Table 4. Normative motor screening assessment scores based on the current sample.
Grade Girls Boys
M ± SD Quartiles M ± SD Quartiles
1 9.21 ± 2.11 8.0–9.0–10.5 8.24 ± 2.19 7.0–8.5–10.0 2 11.17 ± 1.52 10.0–11.0–12.0 10.49 ± 1.96 10.0–11.0–12.0 3 11.42 ± 1.64 10.0–12.0–13.0 10.55 ± 2.38 9.0–11.0–13.0 4 10.98 ± 1.85 9.0–12.0–12.5 9.95 ± 2.18 8.0–10.0–11.0 5 11.54 ± 1.69 10.3–12.0–13.0 11.58 ± 1.52 10.8–12.0–13.0
M: Mean; SD: Standard deviation.
Figure 3. Total Information Curve of Motor Screening Assessment (MSA). The curve shows that the highest peak of information, indicating the test precision, is for Z–score < 0. This means that the latent trait captured by the MSA is more suitable for evaluating children with poor performance. For those with higher performance in the MSA, a lower the amount of information is captured by the latent trait.
Information
MSA’s trait (in z-score) 9
8.5 8 7.5 7 6.5 6 5.5 5 4.5 4 3.5 3 2.5 2 1.5 1 0.5 0
-3.5 -2.5 -1.5 -0.5 0.5 1.5 2.5 3.5
DISCUSSION
The aim of this study was to develop a measure for identi
-fying children between five years and 10 years 11 months who were at risk of having a motor disorder (developmental coor
-dination disorder or neurological soft signs). It was necessary that this measure be reliable, valid, and quick to administer, include broad dimensions relevant to motor performance, and be applicable in a variety of settings. We consequently devel
-oped a seven–item tool, and determined it to have factorial validity with a unidimensional structure (global motor skill).
Moreover, MIMIC modeling revealed that, in our sample: (i) consistent with previous literature12
, MSA scores increased with age (i.e., the older the participant, the more likely they were to perform the tasks correctly); and, (ii) girls obtained higher scores than boys, again consistent with previous literature on fine motor skills29,30. Thus, grade– and sex–specific scores could
be used as normative scores (provided in Table 4); although this preliminary study used data from a robust sample of children with “typical development” (n = 365), it would be wise to con
-sider the group as a representative “normative” sample. Also, we found evidence of differential item functioning, even when the MSA score remained constant. Specifically, boys performed worse on tasks such as fastening differently–sized buttons, fastening snaps, and tying knots, all activities of daily living that involve fine visual–motor control/manipulation. This result is consistent with those of previous studies show
-ing that girls perform these kinds of skills better30,31.
Meanwhile, no differences between sex were found on tasks concerning body coordination/balance skills, and this is also consistent with the literature32
. Further, the difference we found between ages indicates that the skills in question improve with age but, as suggested by Larson et al.33
, in typically–developing children, these motor functions (and the neural systems sup
-porting these functions) reach an “adult” level of maturity by age seven; thus, this finding may also support the assumption that children above seven or eight years old, who cannot perform the proposed tasks, are at risk of having motor disorder.
According to the information curve analysis, even within a sample of typically–developing children, the MSA was capable of identifying children with poor motor performance. These results, therefore, show that the latent traits can provide addi
-tional information in this regard, which could indicate that this tool is beneficial for screening for positive cases of movement disorder risk. According to the fifth edition of the Diagnostic
and Statistical Manual of Mental Disorders, difficulties in motor performance are considered part of the diagnostic criteria of many developmental disabilities1
; thus, this finding is important because, even within a “typically–developing sample,” the MSA can be used to identify those with subtle motor skill difficulties.
The literature shows that children at risk of having motor disorders, such as developmental coordination disor
-der (deficits in motor performance and (perceptual/motor) psychomotor functions) or neurological soft signs (discrete motor and sensory disorders that cannot be linked to spe
-cific cerebral lesions) may present with co–occurrences with other disorders, such as learning disorders34 and attention
deficit/hyperactivity disorders2,35; thus, identifying motor
changes in children with no apparent diagnosis may also point to referral for more detailed and specific evaluations.
Overall, based on its psychometric properties, the MSA can be considered appropriate as an initial screening tool, and it provides a precise estimate of motor skills for those with mild to moderately poor performance. In the context of early identification, especially in the school environment, the MSA may easily be applied by a teacher or paraprofessional to determine if a child should be referred for additional assess
-ment of motor impair-ments by a specialized professional.
Limitations of the study
The MSA consists of a limited number of items in the body– coordination domain; therefore, if the goal is to evaluate static and dynamic balance, other instruments should be considered. Moreover, other elements relating to MSA properties should be investigated further; specifically, additional evidence is required regarding inter–rater agreement (here, only one health profes
-sional rated all the children) and accuracy studies (e.g., how MSA scores discriminate between children who have been diagnosed with motor performance difficulties and undiagnosed children), which would be fundamental for evaluating the best cutoff for this test. Lastly, as the MSA has been developed in a Brazilian context, the cross–cultural validity of the assessment should be investigated via invariance testing.
In conclusion, despite the aforementioned limitations, the MSA appears to be a reliable, quickly administered, and valid screening tool for identifying and quantifying children at risk of having a motor disorder. Thus, it can be considered a useful tool for settings in which the assessment time is lim
-ited (e.g., large–scale assessment programs) and/or when resources for purchasing assessments and training profes
-sionals to use these assessments are scarce or limited.
References
1. American Psychiatric Association. Diagnostic and statistical manual of mental disorders (5th ed.). Arlington: American Psychiatric Association; 2013. 2. Pasini A, D’agati E. Pathophysiology of NSS in ADHD. World J Biol Psychiatry. 2009;10(4-2):495-502. https://doi.org/10.1080/15622970902789148 3. Missiuna C, Cairney J, Pollock N, Campbell W, Russell DJ, Macdonald K
et al. Psychological distress in children with developmental coordination
disorder and attention-deficit hyperactivity disorder. Res Dev Disabil. 2014;35(5):1198-207. https://doi.org/10.1016/j.ridd.2014.01.007 4. Poole KL, Schmidt LA, Missiuna C, Saigal S, Boyle MH, Van Lieshout RJ.
5. Henderson SE, Sugden DA, Barnett AL. Movement assessment battery for children-2: Movement ABC-2: Examiner’s manual. Boston: Pearson; 2007.
6. Bruininks RH, Bruininks BD. BOT2: Bruininks-Oseretsky test of motor proficiency: manual. Boston: Pearson Assessments; 2005.
7. Ulrich DA. Test of gross motor development-2. Austin: Prod-Ed; 2000. 8. Folio M, Fewell R. Peabody development motor scales (PDMS-2). San
Antonio: Therapy Skill Builders; 2000.
9. Rivard L, Missiuna C, McCauley D, Cairney J. Descriptive and factor analysis of the Developmental Coordination Disorder Questionnaire (DCDQ’07) in a population-based sample of children with and without Developmental Coordination Disorder. Child Care Health Dev. 2014;40(1):42-9. https://doi.org/10.1111/j.1365-2214.2012.01425.x 10. Blank R, Smits-Engelsman B, Polatajko H, Wilson P; European Academy
for Childhood Disability. European Academy for Childhood Disability (EACD): recommendations on the definition, diagnosis and intervention of developmental coordination disorder (long version). Dev Med Child Neurol. 2012;54(1):54-93. https://doi.org/10.1111/j.1469-8749.2011.04171.x 11. Sabanathan S, Wills B, Gladstone M. Child development
assessment tools in low-income and middle-income countries: how can we use them more appropriately? Archives of disease in childhood. 2015;100(5)(5):482-8. https://doi.org/10.1136/archdischild-2014-308114 12. Haywood K, Getchell N. Life span motor development. 6th ed.
Champaign: Human Kinetics; 2014.
13. Henderson A, Pehoski C. Hand function in the child: foundations for remediation: Gurgaon: Elsevier Health Sciences; 2006.
14. Shumway-Cook A, Woollacott MH. Motor control: translating research into clinical practice. Philadelphia: Lippincott Williams & Wilkins; 2007.
15. Siu AM, Lai CY, Chiu AS, Yip CC. Development and validation of a fine-motor assessment tool for use with young children in a Chinese population. Res Dev Disabil. 2011;32(1):107-14. https://doi.org/10.1016/j.ridd.2010.09.003
16. Brandão JS. Desenvolvimento psicomotor da mão. Rio de Janeiro: Enelivros; 1984.
17. Faigenbaum AD, Myer GD, Fernandez IP, Carrasco EG, Bates N, Farrell A et al. Feasibility and reliability of dynamic postural control measures in children in first through fifth grades. Int J Sports Phys Ther. 2014;9(2):140-8.
18. Cankaya S, Gokmen B, Tasmektepligil MY, Con M. Special balance developer training applications on young males’ static and dynamic balance performance. Anthropologist. 2015;19(1):31-9.
19. Condon C, Cremin K. Static balance norms in children. Physiother Res Int. 2014;19(1):1-7. https://doi.org/10.1002/pri.1549 20. Gallahue DL, Ozmun JC, Goodway JD. Understanding motor
development: infants, children, adolescents, adults. 7th ed. Boston: McGraw HIll; 2012.
21. Kirby A. Dyspraxia: developmental co-ordination disorder. London: Souvenir Press; 2006.
22. Linde BW, Netten JJ, Otten BE, Postema K, Geuze RH, Schoemaker MM. Development and psychometric properties of the DCDDaily: a new test for clinical assessment of capacity in activities of daily living in children with developmental coordination disorder. Clin Rehabil. 2013;27(9):834-44. https://doi.org/10.1177/0269215513481227
23. Josman N, Goffer A, Rosenblum S. Development and standardization of a “do-eat” activity of daily living performance test for children. Am J Occup Ther. 2010;64(1):47-58. https://doi.org/10.5014/ajot.64.1.47 24. Asparouhov T, Muthén B. Exploratory structural equation
modeling. Struct Equ Modeling. 2009;16(3):397-438. https://doi.org/10.1080/10705510903008204
25. Muthén LK, Muthén BO. Mplus user’s guide. 7th ed. Los Angeles: Muthén and Muthén; 2012.
26. Marsh HW, Hau KT, Wen Z. In search of golden rules: comment on hypothesis-testing approaches to setting cutoff values for fit indexes and dangers in overgeneralizing Hu and Bentler’s (1999) findings. Struct Equ Modeling. 2004;11(3):320-41. https://doi.org/10.1207/s15328007sem1103_2
27. Brown TA. Confirmatory factor analysis for applied research. New York: Guilford; 2015.
28. Zumbo BD, Gadermann AM, Zeisser C. Ordinal versions of coefficients alpha and theta for Likert rating scales. J Mod Appl Stat Methods. 2007;6(1):Article 4. https://doi.org/10.22237/jmasm/1177992180 29. Chui MM, Ng AM, Fong AK, Lin LS, Ng MW. Differences
in the fine motor performance of children in Hong Kong and the United States on the Bruininks-Oseretsky test of motor proficiency. Hong Kong J Occup Ther. 2007;17(1):1-9. https://doi.org/10.1016/S1569-1861(07)70002-5
30. Moser T, Reikerås E. Motor-life-skills of toddlers-a comparative study of Norwegian and British boys and girls applying the Early Years Movement Skills Checklist. Eur Early Child Educ Res J. 2016;24(1):115-35. http://dx.doi.org/10.1080/1350293X.2014.895560 31. Chien CW, Brown T, McDonald R. Rasch analysis of the assessment of
children’s hand skills in children with and without disabilities. Res Dev Disabil. 2011;32(1):253-61. https://doi.org/10.1016/j.ridd.2010.09.022 32. Barnett LM, van Beurden E, Morgan PJ, Brooks LO, Beard JR. Gender differences in motor skill proficiency from childhood to adolescence: a longitudinal study. Res Q Exerc Sport. 2010;81(2):162-70. https://doi.org/10.1080/02701367.2010.10599663
33. Larson JCG, Mostofsky SH, Goldberg MC, Cutting LE, Denckla MB, Mahone EM. Effects of gender and age on motor exam in typically developing children. Dev Neuropsychol. 2007;32(1):543-62. https://doi.org/10.1080/87565640701361013
34. Okuda PM, Ramos FG, da Moura Ribeiro NA, Kirby A, Capellini SA. Motor profile of students with dyslexia. Psychol Res. 2014;4(1):31-9. https://doi.org/10.17265/2159-5542/2014.01.005
Appendix
Motor screening assessment (MSA)
Material: stopwatch, pencil, measuring tape, adhesive tape, mat with buttons*, string.
General instructions for tasks 1, 2 and 3:
• The examiner must sit in front of the child for better demonstration and observations.
• Put the mat with buttons in front of the child and give the following instruction: You must stay seated!
• The examiner must demonstrate all the tasks at least once (but no more than three times) to the child so that he/she under
-stands how the tasks are performed. After three demonstrations, if the child does not understand and is not able to perform the task, score that task as zero.
* The model for the mat with buttons is available under request for the correspondent author: paolaokuda@yahoo.com.br
3) Close pushbuttons: ask the child to close the pushbuttons/ snaps (5 pushbuttons), as fast as he/she can.
Always remind the child: You must stay seated!
Note: mark the runtime for the activity, to calculate a “standard running time”.
( ) 0 = No function (does not perform the test correctly) ( ) 1 = Low (performs the test with great difficulty (uses
too much force to perform the task, or pushes the body forward, or raises the shoulder, or brings the mat closer to his/her body/face), or closes only two or three push
-buttons completely, or closes all but not completely, or performs the task very slowly)
( ) 2 = Normal (performs the test correctly) Run Time: _____
4) Tie a knot: Remove the mat with the buttons and place it to the side. The child must still sit in front of the examiner.
Now the examiner must demonstrate how to make a simple knot with a length
of string (30 cm) around his/her finger. After the demonstration, ask him/her to do the same on the examiner’s finger.
Attempts: three times. After three demonstrations, if the child is not able to perform the task, score the task as zero.
Always remind the child: You must stay seated!
Note: mark the runtime for the activity, to calculate a “standard running time”.
( ) 0 = No function (does not perform the test correctly, wraps the string without tying the knot)
( ) 1 = Low (made a partial knot; or the knot was not tight; or only used the string tips to do the knot but does not com
-plete the loop to tighten; or performs the task very slowly) ( ) 2 = Normal (performs the test correctly)
Run Time: _____ 1) Close average buttons (2 cm): ask the child to close all five
(5) buttons, as fast as he/she can. Remember that all the but
-tons must be put into the correct buttonholes as if it were a shirt, in order not to open.
Always remind the child: You must stay seated!
Note: mark the runtime for the activity, to calculate a “standard running time”.
( ) 0 = No function (does not perform the test correctly) ( ) 1 = Low (performs the test with great difficulty (uses
too much force to perform the task, or pushes the body forward, or raises the shoulder, or brings the mat closer to his/her body/face), or closes only two or three but
-tons completely, or closes all but not completely, or performs the task very slowly)
( ) 2 = Normal (performs the test correctly, closing all the buttons)
Run Time: _____
2) Close little buttons (1.5 cm): ask the child to close all five (5) buttons, as fast as he/she can. Remember that all the but
-tons must be put into the correct buttonholes as if it were a shirt, in order not to open.
Always remind the child: You must stay seated!
Note: mark the runtime for the activity, to calculate a “standard running time”.
( ) 0 = No function (does not perform the test correctly) ( ) 1 = Low (performs the test with great difficulty (uses
too much force to perform the task, or pushes the body forward, or raises the shoulder, or brings the mat closer to his/her body/face), or closes only two or three but
-tons completely, or closes all but not completely, or performs the task very slowly)
5) Finger–to–thumb tapping: The child must still be sitting in front of the examiner.
Ask him/her to put his/her hands on the table, in a sequence touch each fingertip with his/her thumb, starting from index finger to little/pinkie finger, and vice versa, with eyes closed during the execution of the whole task.
The child must complete the task with one hand at a time and then both hands together.
Attempts: One demonstration, one practice trial, three formal trials with each hand and three times with both hands together.
Always remind the child: You must keep your eyes closed the entire time!
( ) 0 = No function (does not perform the test correctly, opens the eyes constantly during execution)
( ) 1 = Low (just one hand at a time, or skips fingers, or touches two fingers at the same time, or opens eyes when changing hands)
( ) 2 = Normal (performs the test correctly) Run Time: _____
6) Walk heel–to–toe in a straight line with hands on hips: Make a straight line on the floor with adhesive tape and ask the child to walk on it with heel–to–toe, i.e., the heel of one foot must touch the toes of the other. The child must be advised to put their hands on their hips, to look forward to walk and perform ten (10) steps.
The examiner must demonstrate the task at least once (but no more than three times) for that the child to understands how it is performed. After three demonstrations, if the child is not able to perform the task, score zero.
Attempts: One demonstration, one practice, three formal trials.
( ) 0 = No function (does not perform the test correctly) ( ) 1 = Low (5 steps or appears unsteady/unbalanced) ( ) 2 = Normal (performs the test correctly)
Run Time: _____
7) Run in a straight line and pick up a ball without falling: Run 5 meters along the straight line of tape, get a ball at the end of the line, return to the start and stop on the line.
The child must run along the straight line, must balance when picking up the ball, without falling, and must stop exactly on the starting line upon return. Attempts: One demonstration, one formal trial.
Note: Mark the execution times of each activity to calculate a “standard run time”.
( ) 0 = No function (does not perform the test correctly; does not return to the starting line; does not stop on the end of the line; drops the ball and does not stop on the starting line)
( ) 1 = Low (broke one rule of the task (e.g., runs straight and has the right intention, but does not stop on the line, or runs past the end of the line or stops before the line, or fails to pick up the ball or reach the ends, or per
-forms the task very slowly)
( ) 2 = Normal (performed the test correctly) Run Time: _____
General observations during the task:
Attention
Time to respond and execute Organization during the task Dominant hand
Dominant foot