UNIVERSIDADE DO ALGARVE
USING DATA ENVELOPMENT ANALYSIS TO ASSESS THE EFFICIENCY OF PORTUGUESE POST OFFICES
AND POSTAL DISTRIBUTION CENTERS
ANA LUISA FADISTA MANSO
Dissertação para obtenção do Grau de Mestre em Contabilidade
ii
UNIVERSIDADE DO ALGARVE
USING DATA ENVELOPMENT ANALYSIS TO ASSESS THE EFFICIENCY OF PORTUGUESE POST OFFICES
AND POSTAL DISTRIBUTION CENTERS
ANA LUISA FADISTA MANSO
Dissertação para obtenção do Grau de Mestre em Contabilidade
Trabalho efetuado sob orientação de:
Professor Doutor Sérgio P. Santos
Professora Doutora Carla A. F. Amado
iii
USING DATA ENVELOPMENT ANALYSIS TO ASSESS THE EFFICIENCY OF PORTUGUESE POST OFFICES
AND POSTAL DISTRIBUTION CENTERS
DECLARAÇÃO DE AUTORIA DE TRABALHO
Declaro ser a autora deste trabalho que é original e inédito. Autores e trabalhos consultados estão devidamente citados no texto e constam da listagem de referências incluídas.
______________________________
Copyright. A Universidade do Algarve tem o direito perpétuo e sem limites geográficos, de arquivar e publicitar este trabalho através de exemplares impressos reproduzidos em papel ou de forma digital, ou por qualquer outro meio conhecido ou que venha a ser inventado, de o divulgar através de repositórios científicos e de admitir a sua cópia e distribuição com objetivos educacionais ou de investigação, não comerciais, desde que seja dado crédito ao autor e editor.
iv
TABLE OF CONTENTS
LIST OF TABLES ... v LIST OF ABBREVIATIONS ... vi RESUMO ... vii ABSTRACT ... viii ACKNOWLEDGMENTS ... ix 1. Introduction ... 1 2. Literature review ... 4 3. Empirical analysis ... 14 3.1. Post offices ... 143.1.1. The DEA model - Post Offices ... 15
3.1.2. Data and efficiency results ... 17
3.1.3. Exploring Scale Efficiency ... 25
3.1.4 Exploring seasonality in the efficiency of the Post Offices ... 30
3.2. Postal Distribution Centers ... 32
3.2.1. The DEA model – Postal Distribution Centers ... 32
3.2.2. Data and efficiency results ... 34
3.2.3. Exploring Scale Efficiency ... 39
3.2.4 Exploring seasonality in the efficiency of the Postal Distribution Centers .... 42
4. Conclusion ... 43
v
LIST OF TABLES
Table 1 – DEA Model to assess efficiency of post offices ... 16
Table 2 – DEA Model statistics ... 17
Table 3 – Statistics of efficiency scores obtained with DEA ... 18
Table 4 – Efficiency scores obtained with DEA (VRS assumption) ... 19
Table 5 – Statistics of post offices efficiency scores per group ... 20
Table 6 – Efficient post offices per group ... 21
Table 7 – Percentage of post offices that score above average per group ... 22
Table 8 – Benchmarks for post offices with efficiency scores above average ... 23
Table 9 – Statistics of Scale Efficiency ... 26
Table 10 – Scale Efficiency ... 27
Table 11 – Statistics of post offices scale efficiency score per group ... 28
Table 12 – Statistics of Group C post offices with scale efficiency score above 90% ... 29
Table 13 – Seasonal patterns in the Post Offices Efficiency Scores ... 31
Table 14 – DEA Model to assess efficiency of PDCs ... 33
Table 15 – Statistics for the inputs and outputs used in the evaluation of PDCs ... 35
Table 16 – Efficiency Scores obtained with DEA (VRS assumption) ... 36
Table 17 – Statistics of PDCs efficiency scores by group ... 37
Table 18 – Efficient postal distribution centers per group ... 38
Table 19 – Benchmarks for postal distribution centers with efficiency scores above average ... 39
Table 20 – Postal distribution centers Scale Efficiency ... 40
Table 21 – Statistics of Scale Efficiency ... 41
vi
LIST OF ABBREVIATIONS
BCC - Banker, Charnes and Cooper
CCR - Charnes, Cooper and Rhodes
CRS - Constant Returns to Scale
CSM - Customer Service Management
DEA - Data Envelopment Analysis
DMU - Decision Making Unit
DRS - Decreasing Returns to Scale
MEU - Mail Equivalent Unit (in portuguese Unidade Equivalente de Correio)
NCS - National Customer Service
PDC - Postal Distribution Center
vii
RESUMO
Os correios de Portugal têm sofrido, desde o seu início em 1520, profundas alterações quer organizacionais quer nos serviços que prestam à população. Quem visita hoje em dia a empresa CTT Correios de Portugal, S.A., quer seja uma Loja, um Centro de Distribuição Postal ou um Centro de Tratamento, fica certamente surpreendido, não só com toda a tecnologia que auxilia as operações internas, como também com o profissionalismo e atitude proactiva dos colaboradores desta empresa. Toda esta evolução que transparece para os clientes é o reflexo de cinco séculos de história. Este estudo tem como objetivo principal explorar o potencial do Data Envelopment Analysis (DEA) para avaliar a eficiência das Lojas e dos Centros de Distribuição Postal (CDPs) a operar no sul de Portugal. Para o efeito, foram recolhidos dados de 84 lojas e 42 CDPs. Os resultados obtidos revelam diferenças significativas na eficiência das unidades de ambos os grupos e demonstram a importância de identificar unidades eficientes, as quais podem definir boas práticas a aplicar nas outras unidades a fim de as tornar eficientes e sustentáveis. Os resultados alcançados também revelam a utilidade do DEA como instrumento de apoio aos decisores desta empresa, uma vez que ajuda a analisar quais as unidades onde deve existir um maior enfoque para a melhoria da performance. Para além disso, o facto de esta técnica permitir decompor a eficiência em várias componentes (eficiência técnica pura e eficiência de escala) permite perceber qual o tipo de restruturação que deve ser implementada em cada unidade para melhorar a sua performance. Por fim, com base numa análise preliminar ao impacto da sazonalidade na eficiência das unidades dos CTT, foi possível concluir que, nalguns casos, este pode ser também um dos fatores que contribuem para explicar a variação nos níveis de eficiência, alertando para a necessidade de ajustar a capacidade de algumas unidades em função da estação.
Palavras-chave: Avaliação de eficiência; Data Envelopment Analysis (DEA); lojas de
viii
ABSTRACT
The Portuguese Post Offices have suffered, since their inception in 1520, profound changes in their structure and in the services provided to the population. Anyone who visits today the company CTT Correios de Portugal, SA, whether visiting a post office, a postal distribution center or a post treatment center will certainly be surprised not only with all the technology that supports internal operations, but also with the professionalism and proactive attitude of the employees of this company. All this evolution perceived by customers is the result of five centuries of history. The aim of this study is to explore the potential of Data Envelopment Analysis (DEA) to assess the efficiency of the post offices and postal distribution centers (PDCs) in the south of Portugal. To this effect, we collected data from 84 post offices and 42 PDCs. Our results show significant differences among efficiency scores in both groups and emphasize the importance of identifying efficient units. These efficient units can serve as benchmarks for learning, revealing the type of structures and processes that can be applied in other units in order to make them efficient and sustainable. Our results also show the utility of DEA as a tool to support decision-making in this company, as this technique can assist managers in the identification of the units that have the greatest potential to improve their performance. Furthermore, the fact that DEA allows the decomposition of efficiency in two components (pure technical efficiency and scale efficiency) is very useful in order to identify the type of restructuring that can be most efficacious in each unit. Lastly, a preliminary analysis of the impact of seasonality in the efficiency of the units revealed that this can be one of the factors that contribute to explaining variations in performance in some of the units. This result suggests that, in order to remain efficient, some units may need to adjust their capacity according to the season.
Keywords: Efficiency; Data Envelopment Analysis (DEA); post offices; postal
ix
ACKNOWLEDGMENTS
To all those who have been linked to this project from its outset, I express my appreciation and gratitude.
I thank Prof. Sérgio Santos and Prof. Carla Amado, my advisors, for all their dedication, commitment and availability throughout the execution of this work.
I thank my husband and my mother for their understanding, unconditional support, encouragement and motivation which were essential for completing this work.
In particular, I would like to thank CTT, Correios de Portugal S.A. in the person of Eng. Agostinho Sousa for his support and availability in the preparation of this work.
1
1. Introduction
The ancient and constant need for men to exchange messages led first kings and then States to make use of all possible resources to overcome the distance.
Pilgrims, squires, couriers on horseback, post coach and rail ambulances, were successively used throughout history to make missives arrive at their destinations. At the same time, the stamp was invented and the access to post was democratized across home delivery, being called at that time as “Posta Pequena”.
Then, in the twentieth century, by making the best use of the technological and industrial developments, the car, the plane and the computer were placed at the postal service, making the circulation faster and more efficient. CTT “Correios de Portugal, S.A.” (Portuguese postal company) is one of the companies that the majority of the Portuguese population recognizes as one of the most popular and with the best public image. The Post Offices are now a modern institution that was able to effectively adapt to the evolution of society and its demands.
When we visit a post office today, a postal distribution center or a post treatment center, we will certainly be impressed not only by the quality and sophistication of existing equipment, but also by the professionalism and attitude of the commercial employees who assist the customers, the postmen who deliver the mail and the employees who treat the mail. All these characteristics are the result of an experience accumulated during five centuries of activity since the days of King D. Manuel I to the present day.
The creation of CTT dates back to the year 1520, when King D. Manuel I created the first public post service. The evolution of the service has been a constant and has been influenced by several events including the publication of the structure of Post Service (1644), the agreement with Spain for interaction services (1718), the first regulations on sending money by post (1753), the regulation of postal service between Portugal and Brazil (1819), and the start, in 1821, of postal service home delivery in Lisbon.
The CTT that exist nowadays started in 1880 during the fusion of the General Directions of Post and Telegraph in a single department called “General Direction of
2 Posts, Telegraphs and Lighthouses”. However, it was only in 1911 that the institution became endowed with administrative and financial autonomy, changing its name to General Administration of Posts, Telegraphs and Telephones, adopting the acronym CTT that still exists today.
In 1928, it was established the first international connection between Lisbon and Madrid, the installation of telephone booths and the automation of the telephone network (completed in 1985).
In 1969, CTT were transformed into a public company by Decree-Law 49 308 of 10th November, with the name of “CTT - Correios e Telecomunicações de Portugal, E. P.”. Predicting that the future of post offices would greatly depend on the speed of mail delivery, in 1972 the Postal Express Train was created, which was the forerunner of all quick postal services that emerged in the 80s and 90s. However, the most important organizational measure was taken at the end of the 70s, when the postal code emerged and allowed direct routing of correspondence from the delivery.
In the 80s, the railroad was definitely replaced by the highway as the preferred means of transportation of post, since it allowed the delivery of post throughout the country. At the same time, the first computer applications emerged in stations and handling centers, which started functioning in full at the beginning of the 90s.
In 1992, CTT were transformed into a limited company under the name CTT -
Correios de Portugal, SA, while the telecommunications area was separated, forming an
independent company (Portugal Telecom S.A.).
In the 90s computerization was extended to the whole network, where the postal mechanization achieved a remarkable degree of effectiveness. At this time, new services appeared and were massively implemented, such as Priority Mail, EMS or Corfax.
Currently the CTT Correios de Portugal SA is a business group consisting of eight companies, besides the mother company, all with their own individual leadership but dependent on the Board of Directors of CTT: PostContacto, Payshop, CTT
Expresso, Tourline Express, Express Mail Mozambique (CORRE), Mailtec SGPS, EAD
3 The company is divided into eight business areas: “Marketing”, “Business”, “Retail”, “Post Operations”, “CEP” (Postal Express Post), “Data and Documents,” “Philately” and “Telecommunications”; all of which also have subdivisions. The post offices and postal distribution centers that we examine in this study are part of the “Retail” area; more concretely, they belong to the “National Customer Service” (NCS).
The NCS consists of nine directorates (seven on the mainland Portuguese territory plus the Azores and Madeira Islands), where each directorate is called “Customer Service Management” (CSM) followed by the name of the corresponding region.
This dissertation aims to use Data Envelopment Analysis (DEA) to evaluate the performance of 84 post offices and 42 postal distribution centers (PDCs) of the CSM South directorate. The post offices and PDCs will be analyzed separately as they are not comparable with each other.
The study we undertake is distinct from the other published studies because it examines two types of distinct Decision Making Units (DMUs) – post offices and PDCs. For each type of DMU we will propose performance assessment models that take into account their specific characteristics. As a consequence, the DEA models we propose to assess the performance of the post offices are different from the ones we propose to assess the PDCs. This is a relevant contribution to the study of the performance of mail delivery units. Furthermore, this study makes two additional contributions to the literature. Firstly, it is one of the few studies that examine the impact of seasonality in the efficiency of organizational units (being the first study to analyze it in this context). Secondly, it is the first study that explores the use of DEA to compare post offices and PDCs in Portugal, evaluating their technical and scale efficiency.
In order to achieve the objectives of the study, the remainder of this dissertation is organized as follows. Section 2 discusses the CTT Correios de Portugal structure, gives an overview of the DEA methodology and comments on the extent to which its use has been documented in the context under study. Informed by the literature review, Section 3 presents the empirical analysis and is divided in two main sections: one dedicated to the post offices, and the other to the PDCs. In this context, this section starts with a discussion of the DEA model we use to assess the efficiency of 84 post offices and 42 PDCs, discusses the data and the empirical results obtained for technical and scale
4 efficiency, and explores the impact of seasonality on efficiency. Finally, Section 4 concludes the dissertation with some closing remarks.
2. Literature review
“The CTT - Correios de Portugal mission is to create physical and electronic
links between the citizens, the Public Administration, the companies and the social organizations in general. Its postal tradition has been progressively strengthened and expanded to the business areas, where the logistical and communications capabilities of the company may be made available to clients.”1 This company “is a powerful multi-service platform meant to meet the needs of citizens and economic players through a commercial and logistics network of exceptional quality, efficiency and proximity to the client. CTT - Correios de Portugal will be an essential element in the social and economic development of the country, contributing to an improvement in standards for both clients and employees through exceptional dynamics in addressing clients’ needs and an acute sense of social responsibility.”2
Efficiency is a term often used to indicate the extent to which an organization is making an appropriate use of organizational resources to produce goods and deliver services (Charnes et al. 1978), and as can be observed from the mission and objectives of this company, efficiency is a factor of great importance for CTT.
At this moment, the efficiency of both post offices and postal distribution centers is measured by various performance indicators that are part of the Management Commitment. The most important performance indicators in the post offices analysis are the revenue (deviation from the target), cost control (deviation from the target), productivity (calculated by dividing revenue by full time staff (FTS)), the Human Resources Plan (HRP), the credit control, the share of occasional revenue of value-added products and the average of waiting times in queues.
1
In www.ctt.pt
2
5 As for the PDCs, the most important performance indicators are cost control, the HRP, productivity (calculated by dividing the units of post-delivery (Mail Equivalent Units - MEU) by full time staff (FTS)), balances (amount of post received in PDC and which is not distributed on the same day), supervision (internal control) and the level of quality of processes (certification / optimization). All of these aspects are important to be analyzed, however, they represent partial measures of performance making it difficult to compare units and identify the most efficient ones. Generally, the units that present good results in some indicators, tend to present poor results in other indicators, making it difficult to obtain an overall indicator of their performance.
Data Envelopment Analysis (DEA), developed by Charnes, Cooper and Rhodes in 1978, is a non-parametric technique which has proved very effective in benchmarking studies and is one of the most important and widely used approaches to measure the performance of homogeneous DMUs, such as post offices and PDCs. This technique provides us with an efficiency ratio which facilitates the comparison between DMUs and allows the identification of the units that are efficient and inefficient in relative terms. The DEA technique also provides useful information regarding the dimensions of the relative inefficiency of each unit. As pointed out by Santos et al. (2012), DEA uses a production metaphor. In this respect, each DMU is considered to be engaged in a transformation process where by using some resources (inputs) it is trying to produce some goods or services (outputs). With the production of goods and/or the provision of services, the DMU achieves certain outcomes which measure the impact of the goods and/or services on the stakeholders. One of the interesting features of DEA, according to Santos et al. (2012), is that it allows each DMU under analysis to identify a benchmarking group; that is, a group of DMUs that are following the same objectives and priorities, but performing better. In so doing, DEA aims to account for the priorities of each DMU by allowing each one of them to choose the weight structure for inputs and outputs that most benefits its evaluation. As a result, DEA classifies each unit in the best possible light in comparison to the other units.
Below we present the envelopment form and the multiplier form of the DEA problem, with input orientation and assuming Constant Returns to Scale (CRS) for DMU0 (Cooper et al. 2007a):
6 , 0 0 E n v e l o p m e n t f o r m : : 0 0 0 M i n s u b j e c t t o y Y x X θ λθ λ θ λ λ − + ≥ − ≥ ≥ , 0 0 M u l t i p l i e r f o r m : : 0 1 , 0 . u v
M a x
u y
s u b j e c t t o
u Y
v X
v x
u v
− ≤ = ≥This problem will have to be solved individually for each of the N DMUs compared. In the primal (envelopment) and dual (multiplier) formulations presented, u and v are row vectors of output and input weights,
x
0 andy
0 are column vectors of the inputs used and the outputs produced by DMU0 under evaluation, X and Y are input andoutput matrices representing the data for all N DMUs,
θ
is a scalar representing the radial reduction in all inputs used by DMU0 andλ
is a column vector of intensityvariables, reflecting the weight to be attached to each DMU in forming the efficient benchmark for the DMU0 under analysis.
θ
is the radial efficiency measure for DMU0,and will be equal to 1 if the DMU is radially efficient, and smaller than 1 if the DMU is inefficient when compared with the other DMUs.
The DEA input oriented model with Variable Returns to Scale (VRS) (Banker et al. 1984) is similar to the CRS version discussed above but includes the convexity
restriction in the envelopment form: 1
1 =
∑
= N j jλ
. The introduction of this additional restriction will produce a scale variable (unrestricted in sign), which is subtracted in the objective function and in the first set of restrictions of the dual formulation. As discussed by Banker et al. (1984), if DMU0 is efficient under the VRS assumption,whether increasing, constant or decreasing returns to scale are present depends on whether the scale variable assumes a positive, null or negative value, respectively, in the optimal solution for the dual problem. Furthermore, if we run the DEA model under the CRS (Technical Efficiency) and VRS (Pure Technical Efficiency) assumptions, we can obtain a measure of scale efficiency by diving the score obtained under the CRS assumption by the score obtained under the VRS assumption. If this ratio is equal to one, the DMU is scale efficient, but if it is smaller than one the DMU is scale inefficient.
7 Generally in DEA, all DMUs are free to choose their own input and output weights, in order to maximize efficiency, while maintaining feasibility for all other DMUs (Cooper et al. 2004). But when we know that some factors are not as important as others and want to ensure that efficiency scores are not overly influenced by these factors, we can add input and/or output weight restrictions.
According with Sarrico and Dyson (2004), the use of weight restrictions to restrain the complete freedom of variation of weights allowed by the original DEA model is necessary because the values obtained with the model with total flexibility of weights are often in contradiction with prior views or additional available information. In this respect, the intention of imposing restrictions to weights is to incorporate value judgments in the assessment of efficiency.
There are two kinds of weights in DEA: absolute weights and virtual weights. Absolute weights are the variables in the DEA model (multiplier form) and depend upon the units of measurement of the inputs and the outputs. On the other hand, virtual weights are the result of the multiplication of the input or output level by the corresponding optimal absolute weight attributed to that input or output. In this respect, as emphasized by Sarrico and Dyson (2004), virtual weights do not depend upon the units of measurement and are very important because they reveal the relative contribution of each input and output to the efficiency score. In this respect, virtual weight restrictions are easier to formulate, as they are more intuitive for the decision makers than the absolute weight restrictions.
Since the pioneering work of Charnes, Cooper and Rhodes in 1978, this technique has been the subject of several developments and has been extensively applied in many sectors including education, finance, justice, agriculture, sports, marketing and manufacturing, to name just a few. A comprehensive review of the DEA technique can be found in Cooper et al. (2000; 2004).
DEA has also been used to assess the performance of post-offices. In this respect, we will now discuss previous studies that have applied DEA to compare the efficiency of post-offices. This review of the literature aims to identify the variables and models used, as well as identify the main limitations of these studies, in order to inform the development of our models.
8 The first article analyzed is entitled “Measuring and improving technical efficiency in UK post office counters using Data Envelopment Analysis” and it was published by Doble in 1995. The purpose of this article is to analyze the efficiency of post office counters in England, Wales, Scotland and Northern Ireland. This article identifies the reasons for the existence of inefficient post offices and at the same time provides procedures to improve their performance.
In this study Doble (1995) used a single input measure: “hours of service to the public”, and as outputs the “average waiting time” and “services provided”. The latter output was subdivided into nine categories which functioned as isolated outputs. The variables selected for the DEA model, although important, in our opinion, are not fully comprehensive. In particular, we would like to emphasize that in addition to the hours of service to the public, there are other important resources which influence the efficiency of the DMUs, such as the number of workers per category, the size of the post office, the location of the post office.
The second article analyzed concerns an analysis of efficiency held at the Brazilian post offices and is entitled “Measuring the efficiency of Brazilian post office stores using data envelopment analysis” (Borenstein et al. 2002).
Its aim is to demonstrate the application of DEA methodology to evaluate the efficiency of the post offices of the Brazilian Post and Telegraph Company (in Portuguese ECT) of Rio Grande do Sul. This article is one of the most complete ones that we have analyzed and uses factors other than financial measures to assess the performance of post offices.
The study focused on 113 DMUs, which were divided into three groups: 30 client service post offices, 28 delivery post offices and 55 delivery and client service post offices. This division was required due to the fact that each type of DMU provides different services and therefore is only comparable with other DMUs of the same group. In spite of running separate analyses for each of the three groups, Borenstein et al. (2002) used a common DEA model, which was adjusted to account for the characteristics of each group.
Initially, the authors defined a set of seven inputs and eleven outputs some of which were later discarded because the data were difficult to collect or were unreliable.
9 The final list of inputs is constituted by the “number of employees”, “number of vehicles”, “investment in training programs”, “physical area” and “total cost”, while the outputs defined were “external customer satisfaction rate”, “quality program – PMAT”, “total revenue”, “population served”, “number of objects delivered” and “system of workload.”
As mentioned above, not all variables were used to assess the three groups of DMUS. For example, the DEA model used to assess the efficiency of post offices, which only provide direct services to the clients, did not include the input “number of vehicles” and the output “number of objects delivered”, as these would be meaningless in this group of DMUs.
Despite the importance of the input "physical area" as a proxy for capital, we believe that population density is also an important input in order to evaluate the potential of post offices to capture customers. This is due to the fact that the “physical area” of a post office does not greatly influence the number of clients who come to the post office or the results that it produces. As for outputs the “satisfaction of external customers’ rate” is interesting to analyze but it has limitations because it is influenced by subjective factors, such as the expectations of each customer.
Borenstein et al. (2002) identified the benchmark DMUs and established the targets to be achieved by the inefficient post offices to become efficient.
This article proves to be very interesting because it has two points that make it different from all the other articles analyzed. Firstly, the results of the DEA analysis were compared with the results of the existing evaluation system for the post offices (I/E – Income/Expenses). That is, in order for the managers of ECT to better understand the differences and advantages of using DEA, a comparison was made of the results obtained through the index I / E and the DEA evaluation and it was concluded that the evaluation system used, based only on variables of financial nature, could significantly harm assessment as it concealed important differences between the post offices. Secondly, the DEA evaluation was carried out taking into account the perspective of the post office managers and the ultimate goal was to identify good practices in local management, so that these could be replicated in inefficient post offices to improve their performance.
10 The third article analyzed was written in Portuguese and it is entitled: “A aplicação da Análise Envoltória de dados – DEA na Avaliação da eficiência dos Centros de Distribuição Domiciliária – CDD de uma regional dos Correios” which means “Application of Data Envelopment Analysis - DEA to evaluate the efficiency of Home Delivery Centers – CDD of a Post Office region” (Lima et al. 2006).
This article uses data from the Home Delivery Centers of a region of Brazil, which are equivalent to the Postal Distribution Centers in Portugal. According to Lima et al. (2006), the purpose of their study was to contribute positively to the measurement of the performance of these units in order to support decision making of the managers of the company.
For the application of DEA the inputs used were “the rest of the workload”, which in Portugal corresponds to “balance” (post that enters the PDC but is not distributed on the same day), the “number of workers”, and the “motorized workload” that corresponds to the load capacity of each type of vehicle multiplied by the number of vehicles of each type available in the PDC. In which regards the outputs, the authors used the “degree of customers’ satisfaction” which translates the results of a monthly customer survey made by the company in order to evaluate the customers’ opinion about the service and the “workload delivered” which is measured by the ratio: “workload delivered / received workload.” In this particular case, it is important to bear in mind that mixing volume measures with ratio measures might lead to biased results (Dyson et al. 2001).
In analyzing the inputs used in this study, it is noteworthy that two of them may not be directly used in a Portuguese PDC study because we have some specific aspects that have to be taken into account. In Portugal we have “delivery standards” which indicates in how many days a particular type of post should be distributed (that is, it tells us in what “post age” it should be distributed). This factor allows for the existence of “rest of the workload” in a particular PDC, without that necessarily meaning poor performance. For example, in Portugal we have two basic types of post, the regular post and the priority post, which have different delivery standards: the normal post has as its pattern D +3 (the day of acceptance of correspondence plus 3 days) and the priority post must have as its pattern D +1 (the day of acceptance of correspondence plus 1 day, that is, the letter should be delivered on the day following acceptance). Thus, if there are
11 normal (regular) letters arriving in the PDC in D +1 (1 day old), then they can remain as “balance” (if there is too much work) until they reach 3 days old, that is, the standard delivery D +3, whereas in the case of priority post, it can never remain in “balance” since its pattern is D +1, which means that it always has to be delivered on the day it arrives at the PDC. Thus, the input “rest of workload” may depend on the pattern and age of the post that enters the PDC.
In the same way, Lima et al. (2006) assume in their study that the postmen who use vehicles to deliver the post are more productive than those on foot. However in Portugal, there are “refilling stations” where postmen who go on foot refill their bag with more post, that is, a “giro” (the delivery routes made by a postman) can have several refilling stations, according to the amount of post for each zone of the “giro” (these refilling stations are supplied by a specific vehicle that will carry the packs of post that every postman prepares in advance at the PDC). Thus, the amount of post delivered by a postman on foot can be equal or higher to the post distributed by a postman in a motor vehicle, since his bag is refilled several times along the delivery route. Therefore, in Portugal further to the input “motor workload”, we would have to take into account the “refilling stations”.
As for the outputs used in this study, it is noteworthy that the “Satisfaction Survey” may pose some problems for the evaluation of DMUs, since it is directly related to a qualitative assessment of customers. This assessment depends upon external factors to the organization, which are subject to the examination and judgment of people who can make an ambiguous analysis and that may not correspond to reality. Thus, we consider that this output, although important, has limitations in the assessment of efficiency because it cannot transmit an objective assessment of the work that is carried out in each DMU.
In what concerns the impact of the results of this study, it is emphasized that it enabled the supporting of decisions aimed at specific points in the process distribution, and also enabled the identification of a benchmark unit serving as a reference to all other DMUs.
The last article found and analyzed on this topic is entitled “Comparing the efficiency of stores at New Zealand Post” (Priddey and Harton, 2010). The New Zealand Post Office wanted to find a fair way to compare post offices and to identify
12 which ones have the best and worst performances. To this end, they decided to use the DEA methodology, as it would allow them to achieve that goal.
The post offices analyzed in this study are located in various regions around the country, from big urban centers to the most rural areas. This causes the socioeconomic realities of the populations served by these post offices to be very different from each other. In this respect, the post offices compared have very different revenue levels, different cost levels and different types of clients. These differences directly influence the objectives of each post office and their performance. For example, a post office located in a large urban center has larger revenues because it has greater commercial potential than a post office located in a small rural area: its customers are potentially younger and have greater purchasing power, while in the small rural areas the majority of customers are pensioners and have reduced purchasing power.
Initially they studied some inputs and outputs that did not enter the final model because they were not significant or because the data were not available. So, Priddey and Harton (2010) have chosen as inputs the variables “expenditure of the type x”, “expenditure of the type y” and “competition”, which is measured by the number of other post offices existing within 5 km. As for outputs, the authors of this article discuss the inclusion of the following variables: four types of “revenue” (A, B, C and D), “sales lines by customers” and “results of the mystery shopper reports.” Despite this discussion, the authors are not explicit as to the choice of the variables used in the final model, so we cannot specifically understand what were the reasons behind the choice of the final variables.
Regarding the results of this research, they were not fully disclosed by the authors for confidentiality reasons. The authors mention that they were only able to establish the efficiency scores which led to the identification of efficient and inefficient post offices and that these should improve their performance to achieve the efficient frontier. Thus, this study neither does present results clearly, nor does it explain how the DEA helped in the analysis of post offices in New Zealand.
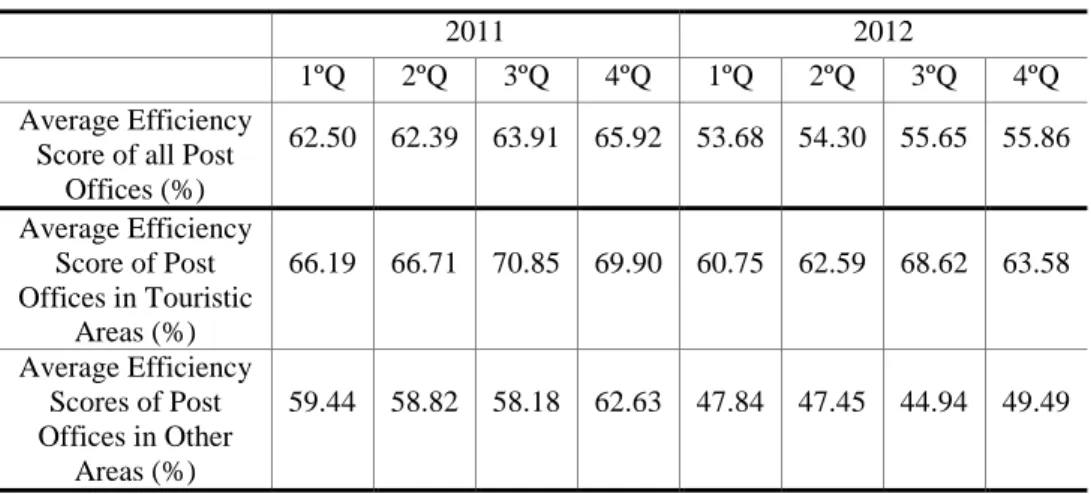
The analysis we discuss in this dissertation focuses on the efficiency of Portuguese Post Offices and Postal Distribution Centers, using data from January 2011 to December 2012 and it aims to offer an overview of the impact that the recent efforts targeted at increasing revenue and at reducing costs have had on the efficiency of the
13 post offices and PDCs, respectively. The models we propose are considerably different from all the models used in the previous articles, attempting to solve some of the limitations identified. In particular, we use variables more directly related to internal service (in post offices) and quality provided to customers (in postal distribution centers). Additionally, we explore the impact of seasonality in the results of the post offices and postal distribution centers, which is a major departure from previous work.
Over the past 30 years, DEA has been extensively applied in the context of performance assessment. For example, Liu et al. (2013), in a recent literature survey of DEA applications, identified 4936 DEA papers published in journals indexed by the Web of Science which discuss applications of this technique. Despite all this interest, very few studies have examined whether seasonality has had an impact on the results achieved by the different DMUs assessed. Some exceptions include the works by Friesner et al. (2008), who explores the extent to which hospitals are seasonally inefficient, the study by Picazo-Tadeo et al. (2009) who discuss the extent to which demand seasonality impacts on the managerial efficiency of water utilities and the work by Font et al. (2011), who tried to explain the observed differences in the efficiency results of a set of Balearic tourist accommodation units according to seasonal patterns in tourism activities. However, as far as we are aware, no study discusses this issue in the context of the postal services.
14
3. Empirical analysis
The choice of appropriate input and output variables is a fundamental step in DEA analysis, determining the context for evaluation and comparison (Thanassoulis, 2001). According to Priddey and Harton (2010: 20) “choosing different inputs and outputs can significantly affect the results and make different DMUs appear better or worse”. In this context, our choice of indicators was driven by the main objectives set by CTT, Correios de Portugal S.A.: to increase revenue and to decrease costs. Although there is no standard procedure to carry out this task, we made an initial list of all variables that may serve as a measure for efficiency. After that, we realized that we should keep only those that may effectively contribute to post offices and postal distribution centers efficiency evaluation, therefore discarding some factors and aggregating others.
The results for the models have been handed to CTT, Correios de Portugal S.A., however for confidentiality reasons, most of the results in the following sections are analyzed on an aggregated form and the identity of the post offices (PO) and postal distribution centers (PDC) is not disclosed.
3.1. Post offices
A post office is a postal store where customers can perform various postal services, such as sending normal mail, priority mail, registered mail, postal order and express mail. Besides these, the Portuguese post offices nowadays also have a set of solutions for financial services (payments and investments), as well as a wide range of merchandising articles, books, cd's, etc., to enable cross-selling and an increase in post offices revenues. CTT Post Offices are present in all the Portugal county seats and in all villages through local partnerships which ensure the availability of all postal services (excluding financial services).
In our sample we had 86 post offices, but we had to exclude two due to lack of data, so in this dissertation we will analyze 84 CTT post offices from the south of Portugal.
The Portuguese Post Offices are divided in three groups (A, B, C) according with similar revenues characteristics. So we have the following division in our sample:
15 − 4 Post Offices in Group A – post offices with revenues exceeding 450.000
euros per year;
− 20 Post Offices in Group B – post offices with revenues between 225.000 euros and 450.000 euros per year;
− 60 Post Offices in Group C – post offices with revenues lower than 225.000 euros per year.
3.1.1. The DEA model - Post Offices
For these DMUs the main objective is to increase revenue, so we decided to use an output-oriented model with three inputs and two outputs.
In order to capture the company objectives, the first output that we chose was the “revenue per month”. This indicator measures all casual and contractual revenues, including the business of subsidiaries such as “CTT Expresso” and “PostContacto” (relating to services performed by CTT). In these revenues we can find products and services related with all postal business, merchandising, communication or collectionism. The second output used in this model was “clients per month” and it measures the number of clients that each post office serves monthly.
Regarding the inputs, the first indicator that we chose was the “population’s density” (Number inhabitants/km2). This indicator is a measurement of population per unit area or unit volume, that is, the population divided by total land area and is calculated by INE (Instituto Nacional de Estatística - National Institute of Statistics). With this indicator we know how many people the post office can serve. It should be noted that this indicator is a non-discretionary input, which means that, although it influences the performance of the post office, it cannot be controlled by the post office.
The second indicator used in this DEA model as input is the “effective full time”, which measures the number of workers that are in a post office throughout the period of operation. To calculate this indicator we multiply the number of days each post office operates monthly by the full time staff and the number of daily hours each post office is opened. Thus we can analyze the number of hours worked in each post office per month.
16 The third input is the “costs per month” and it represents all the costs with products sold, supplies and services (e.g. electricity, office supplies, rent, communications, cleaning, security and safety, uniforms and conservation), personnel expenses (e.g. salaries and other compensation paid) and IT expenses.
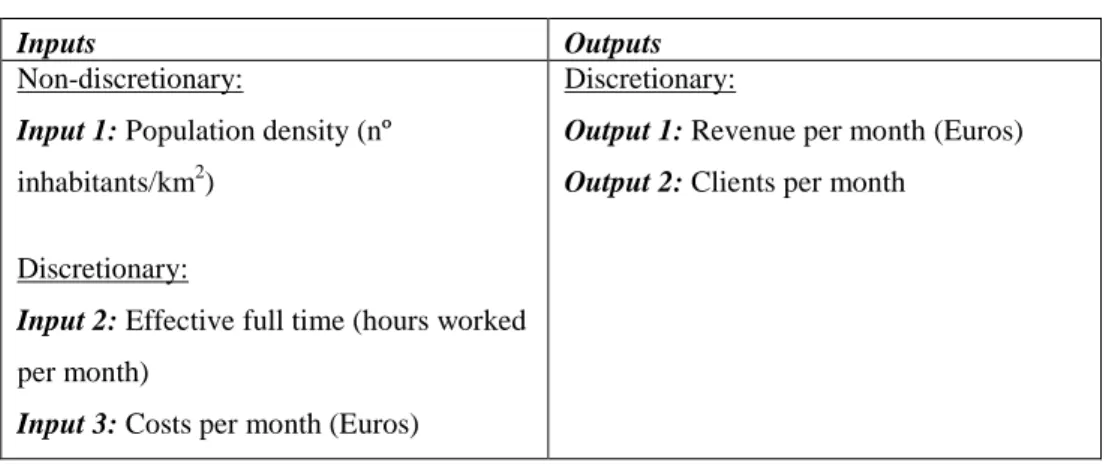
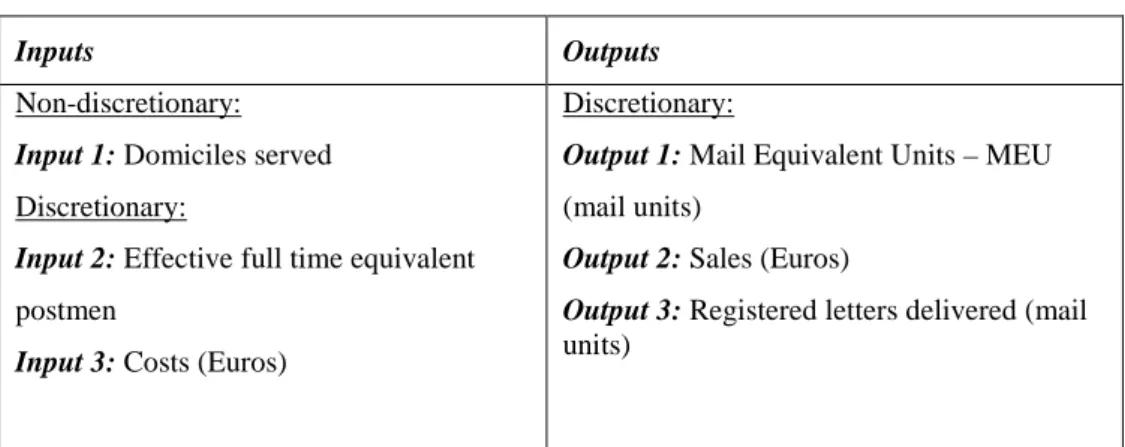
In summary, the DEA model we propose to assess the efficiency of post offices, which was developed based on the literature review and the knowledge we have regarding the post offices operation in Portugal, is the one presented in Table 1.
Table 1 – DEA Model to assess efficiency of post offices
Inputs Outputs
Non-discretionary:
Input 1: Population density (nº inhabitants/km2)
Discretionary:
Input 2: Effective full time (hours worked per month)
Input 3: Costs per month (Euros)
Discretionary:
Output 1: Revenue per month (Euros) Output 2: Clients per month
With the purpose of guaranteeing a balanced distribution of weights according to business objectives, we included three restrictions to the virtual weights in our model, which are consistent with the publication of Sarrico and Dyson (2004). The restrictions aimed to ensure that at least 95% the DMUs under analysis satisfy the following conditions:
− R1: the virtual weight given to revenue must be greater or equal than the virtual weight given to clients;
− R2: the virtual weight given to costs must be greater or equal than the virtual weight given to hours worked;
− R3: the virtual weight given to the hours worked must be greater or equal than the virtual weight given to the population density.
In this way we ensure that the main objectives are considered in the overall performance score by at least 95% of the post offices, whilst providing enough
17 flexibility to each post office to choose the weights for each indicator that are most beneficial. That is an important step in the model because some factors are not as important as others, and thus efficiency scores should not be overly influenced by the factors of relatively lower importance.
3.1.2. Data and efficiency results
The data used in this study refers to the activity from January 2011 to December 2012 (monthly average) and it was collected from formal documents made available by the company CTT, Correios de Portugal S.A.. By using data from a recent period, we can obtain valuable information for performance management and improvement.
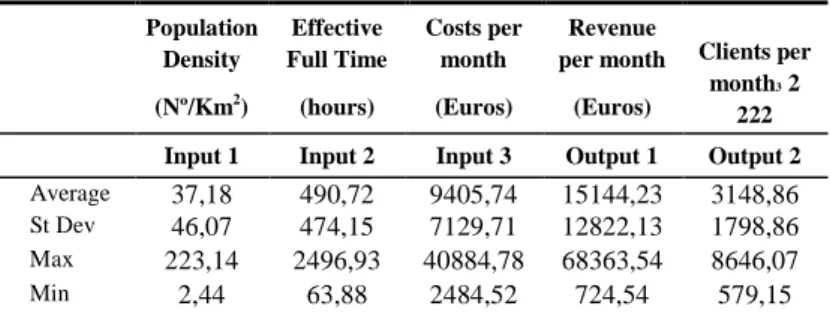
Table 2 presents a descriptive summary of data for the 84 post offices considered in the analysis.
Table 2 – DEA Model statistics
Population Density (Nº/Km2) Effective Full Time (hours) Costs per month (Euros) Revenue per month (Euros) Clients per month3 2 222
Input 1 Input 2 Input 3 Output 1 Output 2
Average 37,18 490,72 9405,74 15144,23 3148,86
St Dev 46,07 474,15 7129,71 12822,13 1798,86
Max 223,14 2496,93 40884,78 68363,54 8646,07
Min 2,44 63,88 2484,52 724,54 579,15
From this table we can see that there are considerable discrepancies across the post offices. In particular, we can see that post offices vary considerably in size. For example, whilst there is a post office with an average monthly revenue of 68.363,54 euros (the maximum observed), there is another with an average monthly revenue of only 724,54 euros, which represents around 1% of the previous value. Important differences are also observed on the other variables. A careful analysis of the data allowed us to conclude that most of the post offices (i.e. 52 post offices) have a monthly revenue below the average value calculated.
Another interesting conclusion from this table is the fact that the minimum value of costs is much higher than the minimum value of revenues (around 29%), meaning that some post offices do not have enough revenue to cover their costs, which is a
18 worrying situation to their managers. On the other hand, there are post offices that, in direct comparison of costs/revenue always have revenue to cover their costs, since the maximum cost is 40% lower than the maximum revenue.
In order to assess each post office’s efficiency, we used the EMS Software (Efficiency Measurement System version 1.3, Holger Scheel, 2000) and a DEA model with output orientation. This is justified by reasoning that the post offices should aim to increase the volume of revenue and the number of clients. Besides, we have used an assumption of variable returns to scale (VRS), as proposed by Banker et al. (1984), because it reflects the fact that production technology may exhibit increasing, constant and decreasing returns to scale. Our choice of a VRS assumption is also justified by the fact that in our model output levels will not change by the same proportion as inputs levels change (e.g. doubling the level of all inputs does not have to lead to doubling the level of all outputs).
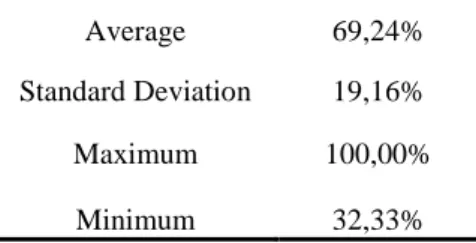
Table 3 presents the statistics of the results from the DEA model discussed above.
Table 3 – Statistics of efficiency scores obtained with DEA
Average 69,24% Standard Deviation 19,16% Maximum 100,00% Minimum 32,33%
The average efficiency score in this model is 69,24% and the standard deviation is 19,16%. The fact that the average efficiency score is below 70% and that 56% of the post offices present efficiency scores below the average, suggests considerable scope for improvement in the post offices belonging to the CSM South Directorate. Furthermore, the fact that some post offices present efficiency scores below 40% (e.g. PO1, PO17, PO24 and PO55) also suggest that major changes need to take place in these post offices as there is clearly a misalignment between the objectives of the company and the efficiency of these post offices.
In Table 4 we can analyze the results from our DEA model. It presents the efficiency scores for each of the 84 post offices.
19
Table 4 – Efficiency scores obtained with DEA (VRS assumption)
Post Office Group Score (%) Post Office Group Score (%)
PO1 C 33,91 PO43 C 65,56 PO2 C 50,59 PO44 C 66,75 PO3 C 64,08 PO45 C 100,00 PO4 C 43,55 PO46 C 53,71 PO5 C 95,76 PO47 C 78,55 PO6 C 55,90 PO48 B 59,33 PO7 B 80,97 PO49 C 95,31 PO8 C 42,11 PO50 C 58,43 PO9 C 47,67 PO51 C 40,44 PO10 C 56,66 PO52 B 62,42 PO11 C 84,29 PO53 B 72,54 PO12 B 100,00 PO54 B 76,90 PO13 B 84,12 PO55 C 32,33 PO14 B 72,29 PO56 C 84,07 PO15 C 41,57 PO57 C 79,22 PO16 C 58,68 PO58 B 67,58 PO17 C 35,03 PO59 C 73,42 PO18 B 67,98 PO60 C 56,61 PO19 C 100,00 PO61 A 100,00 PO20 C 100,00 PO62 C 60,92 PO21 C 63,95 PO63 C 62,83 PO22 C 57,20 PO64 C 100,00 PO23 A 93,19 PO65 C 76,70 PO24 C 38,46 PO66 B 73,32 PO 25 C 59,17 PO67 C 100,00 PO26 C 100,00 PO68 C 52,69 PO27 C 69,87 PO69 C 53,56 PO28 A 67,54 PO70 B 59,67 PO29 A 89,12 PO71 B 66,59 PO30 C 100,00 PO72 B 68,66 PO31 C 54,64 PO73 C 41,51 PO32 C 69,42 PO74 C 96,89 PO33 B 95,17 PO75 C 51,38 PO34 C 58,13 PO76 C 60,53 PO35 B 71,65 PO77 C 51,60 PO36 B 62,11 PO78 C 58,88 PO37 B 65,43 PO79 C 69,65 PO38 C 100,00 PO80 C 61,88 PO39 B 92,54 PO81 C 48,94 PO40 C 92,79 PO82 C 55,02 PO41 C 84,07 PO83 C 48,83 PO42 C 73,26 PO84 B 100,00
20 The efficiency scores are the first useful piece of information in Table 4. Post offices with a score of 100% are fully efficient and, in return, all the others are inefficient and should be able to improve their performance to reach the efficient frontier.
As we can see, 11 out of the 84 post offices are shown as efficient in which regards the way they use the inputs to produce the outputs, taking into consideration the virtual weight restrictions imposed. This represents just 13% of the post offices (PO12, PO19, PO20, PO26, PO30, PO38, PO45, PO61, PO64, PO67 and PO84). From the group of inefficient post offices, the PO1, PO17, PO24 and PO55 present the lowest efficiency scores and, therefore, the highest potential for improvement. We can also see that six post offices (PO5, PO23, PO39, PO40, PO49 and PO74) are close to the efficient frontier, as their efficiency scores are higher than 90%.
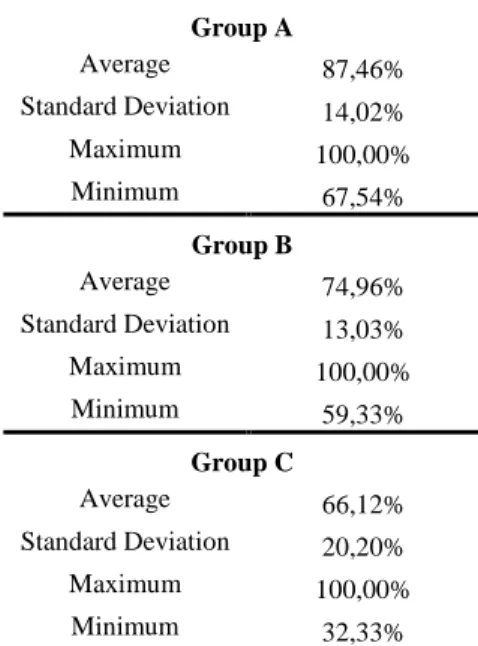
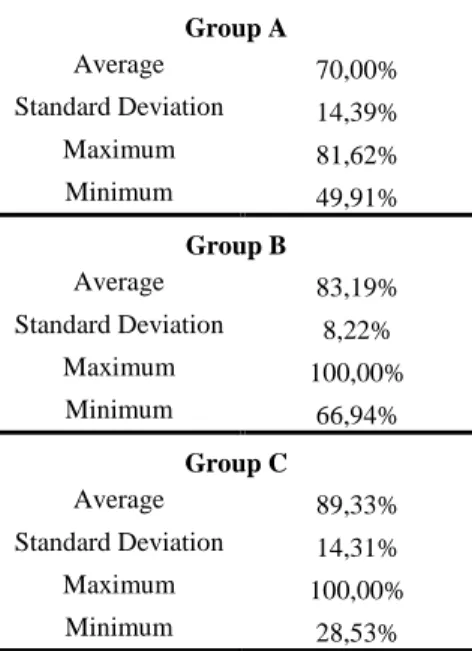
In order to analyze the extent to which efficiency varies by group of post offices, we have calculated summary statistics of the DEA results, by group. Table 5 presents these statistics.
Table 5 – Statistics of post offices efficiency scores per group
Group A Average 87,46% Standard Deviation 14,02% Maximum 100,00% Minimum 67,54% Group B Average 74,96% Standard Deviation 13,03% Maximum 100,00% Minimum 59,33% Group C Average 66,12% Standard Deviation 20,20% Maximum 100,00% Minimum 32,33%
With this information, we can see that the average efficiency score in Group A and Group B are higher than the average efficiency score obtained for the full set of 84 post offices (69,22%), and the average efficiency score from Group C is lower than the average obtained for the full set. We can also observe that the standard deviation for
21 Group A and B is very different to the one observed in Group C, and is lower than the standard deviation obtained when taking into account the full set (19,16%). The results in Table 5 show, therefore, that the post offices from Group A and B have better efficiency scores than Group C, and that the latter group is the one which has the largest scope to improve. Furthermore, we can see that the post office with minimum efficiency score belongs to Group C, because the minimum score in Group C is exactly the minimum score obtained when analyzing the full set of post offices.
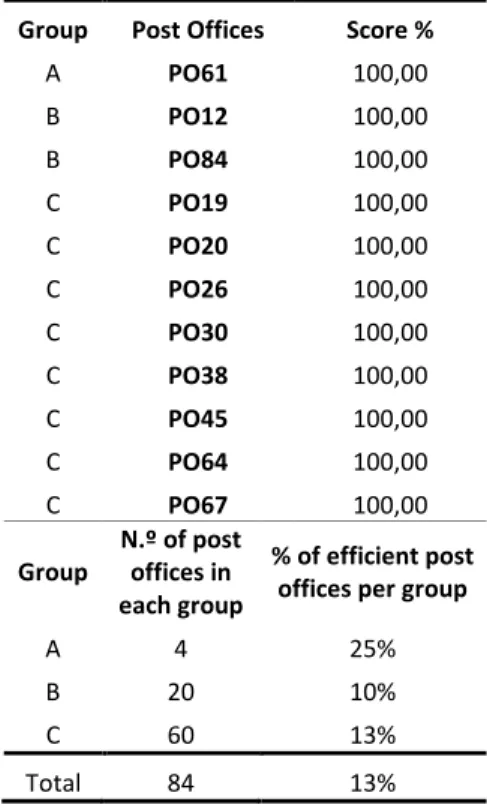
Table 6 shows to which groups do the efficient post offices belong and the percentage of efficient post offices in each of the three groups.
Table 6 – Efficient post offices per group
Group Post Offices Score %
A PO61 100,00 B PO12 100,00 B PO84 100,00 C PO19 100,00 C PO20 100,00 C PO26 100,00 C PO30 100,00 C PO38 100,00 C PO45 100,00 C PO64 100,00 C PO67 100,00 Group N.º of post offices in each group % of efficient post offices per group
A 4 25%
B 20 10%
C 60 13%
Total 84 13%
In this table we can see that 25% of the post offices from Group A are efficient, 10% of the post offices from Group B are efficient and 13% of the post offices from Group C are efficient. With this information we conclude that the post offices from Group A are the most efficient. Although the percentage of efficient post offices in Group B is lower than the one in Group C, the former group displays a higher average efficiency score. It is also important to emphasize that the results in Table 6 are influenced by the fact that there are only 4 post offices in Group A. As we use the VRS
22 assumption and DMUs in Group A do not have many post offices with similar size to compare, they end up being classified as efficient, explaining why the percentage of efficient post offices in this group is the highest of the three groups. In the case of the Group B and C as there are more post offices with similar size to be compared, they are more likely to be classified as inefficient and for that reason the percentage of efficient post offices is lower than in Group A.
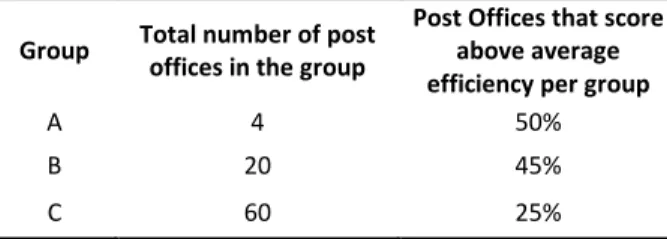
In this respect, in order to better analyze the efficiency score by group, it is important to look at the post offices that score above average in each group (Table 7).
Table 7 – Percentage of post offices that score above average per group
Group Total number of post offices in the group
Post Offices that score above average efficiency per group
A 4 50%
B 20 45%
C 60 25%
With these results, we can observe that the post offices that are closer to achieving efficiency belong to the Group A, and those who are further away from becoming efficient belong to Group C.
One of the advantages of the DEA technique is that it indicates the targets that the inefficient DMUs should aim to achieve in order to become efficient. This information, together with the information about the benchmarks for each inefficient DMU, represent important tools for performance improvement.
Table 8 displays the benchmarks and respective intensity variables for the post offices with efficiency scores above average.
23
Table 8 – Benchmarks for post offices with efficiency scores above average
Post Office Group Score % PO12 B PO84 B PO38 C PO61 A PO20 C PO64 C PO30 C PO45 C PO19 C PO26 C PO29 A 89,12% 1,00 PO23 A 93,19% 0,62 0,38 PO35 B 71,65% 0,09 0,79 0,12 PO14 B 72,29% 0,18 0,82 PO53 B 72,54% 0,27 0,34 0,39 PO66 B 73,32% 0,45 0,55 PO54 B 76,90% 0,16 0,70 0,14 PO7 B 80,97% 0,65 0,35 PO13 B 84,12% 0,68 0,11 0,21 PO39 B 92,54% 0,97 0,03 PO33 B 95,17% 0,05 0,94 0,01 PO32 C 69,42% 0,09 0,87 0,04 PO79 C 69,65% 0,28 0,58 0,14 PO27 C 69,87% 0,20 0,09 0,45 0,26 PO42 C 73,26% 0,09 0,19 0,44 0,28 PO59 C 73,42% 0,18 0,30 0,52 PO65 C 76,70% 0,03 0,12 0,85 PO47 C 78,55% 0,85 0,15 PO57 C 79,22% 0,88 0,12 PO41 C 84,07% 0,76 0,12 0,12 PO56 C 84,07% 0,97 0,03 PO11 C 84,29% 0,44 0,56 PO40 C 92,79% 0,66 0,34 PO49 C 95,31% 0,64 0,36 PO5 C 95,76% 0,96 0,04 PO74 C 96,89% 0,66 0,34 Number of times a post office is used as a benchmark for learning (in this Table)
18 12 9 8 6 6 2 2 1 1
Total number of times a post office is used as a benchmark for learning
45 35 16 24 7 24 3 18 2 3
In this table we can find the benchmarks for a particular inefficient post office - a group of post offices with similar weighting structures to the optimal weighting structure of the post office under evaluation. These benchmarks can be used as an example of good practice with whom the inefficient post office can learn. Benchmarks are units that are classified as efficient when applying the optimal weight structure of the inefficient unit under analysis.
For example, we know that the post offices PO35 and PO54 (who belong to the Group B) have the same characteristics and they are located in neighboring counties in Algarve, so they serve the same type of clients and have the same internal
24 characteristics. The results displayed on Table 8 for these two post offices show that they have the same set of benchmarks for learning. On one side, PO35 achieved efficiency score 71,65% and its benchmarks for learning are PO12, PO84 and PO61. On the other side PO54 achieved efficiency score 76,90% and its benchmarks for learning are PO12, PO84 and PO61. So, these two relatively inefficient post offices can get inspiration from the good practices of management from the same post offices. To confirm that, we inspected the optimal input weight structure of PO35 e PO54 and we concluded that these two post offices distribute all their virtual weight between the variables Effective Full Time and Costs, with the same weight division. From another side, if we inspect the output weight structure of these post offices, we conclude that they use the same weight for the variable Revenue and Clients.
In addition to the information regarding the benchmarks from whom the inefficient post offices can learn, Table 8 also provides useful information to define the targets to be achieved by these post offices. This information is contained in the optimal values obtained for the intensity variables, as displayed in each of the rows of Table 8. For example, the values of the intensity variables associated with each benchmark (i.e. 0,66 and 0,34) represent the proportion of the service levels of PO12 and PO20 that PO74 is required to achieve to become efficient.
From another angle, we can also look at the number of times a post offices acts as an efficient peer, or is “benchmarked”. Thus, in Table 8 we can also see that, in the total sample, there are four post offices that serve as benchmark to 24 or more post offices, presenting robust efficiency status. From these, it should be noted that PO12 is the most commonly used as benchmark because it serves as a reference to 45 post offices.
In order to specifically analyze the benchmarks, we split the post offices by the groups they belong to in the company: A, B or C, depending on their size and internal characteristics. Thus, in the sample analyzed in Table 8 (post offices with efficiency score above average) we have 2 post offices in the Group A (50%), 9 post offices in the Group B (45%) and 15 post offices in the Group C (25%).
With these results we can observe that the post offices have similar groups of benchmarks, depending on the group that they belong. In other words, we can confirm that in Group A the benchmarks are the same for the 2 post offices: PO84 and PO61. From another side, when we look at Group B we observe that, although with a different
25 weight structure, the benchmarks are the same for the 9 post offices: PO12, PO84 and PO61. The same thing happens in Group C, where the benchmarks, although more varied, tend to be different from the benchmarks used in Group A and Group B. In this case, for post offices from Group C the benchmarks are, in the majority of DMUs, PO12, PO38, PO20 and PO64. If we do a more specific inspection, we can see that the benchmarks usually belong to the same group as each post office, meaning that a post office that belongs to Group A can learn with post offices from the Group A and the same happens in the other groups. In Group C, this is clearly evident because seven out of ten benchmarks are from this group and they just serve as benchmark to post offices from Group C (PO38, PO20, PO64, PO30, PO45, PO19, and PO26), excepting PO12 which serves as benchmark for the majority of post offices from Groups B and C.
It should also be noted that PO67 does not appear in Table 8 because it is not used as benchmark for any post office. This happened because this post office is the smallest in all sample, it is located in a rural area from Alentejo and there is no post office similar to this. This means that PO67 can be considered an outlier3.
3.1.3. Exploring Scale Efficiency
As discussed in Chapter 2, if we run the DEA model under the CRS (Technical Efficiency) and VRS (Pure Technical Efficiency) assumptions, we can obtain a measure of scale efficiency by diving the score obtained under the CRS assumption by the score obtained under the VRS assumption (Banker et al., 1984). If this ratio is equal to one, the DMU is scale efficient, but if it is smaller than one the DMU is scale inefficient.
To analyze the scale efficiency in this group of post offices, we run our model using the CRS assumption. Table 9 presents the summary statistics of Scale Efficiency.
3
26
Table 9 – Statistics of Scale Efficiency
Technical Efficiency Pure Technical Efficiency Scale Efficiency Average 60,42% 69,24% 86,95% Standard Deviation 18,93% 19,16% 14,09% Maximum 100,00% 100,00% 100,00% Minimum 19,98% 32,33% 28,53%
With the information presented in this table we can see that the average technical efficiency score (CRS assumption) of the 84 post offices was only 60,42%, with a standard deviation of approximately 18,93%, which indicates that there are considerable differences between post offices and remarkable potential for improvement in some of them.
We can also observe that the scale efficiency is relatively high, suggesting that inefficiency is related, in most cases, to issues other than the scale of operations.
To better analyze the scale efficiency in this group of post offices, we present the results for each post office in Table 10.