MASTER OF SCIENCE IN FINANCE
MASTER’S FINAL WORK
DISSERTATION
Deferred Tax Assets in Portuguese Banking
José Guilherme Jesus
MASTER OF SCIENCE IN FINANCE
MASTER’S FINAL WORK
DISSERTATION
Deferred Tax Assets in Portuguese Banking
José Guilherme Jesus
Orientação: Prof. Dr. Joaquim Miranda Sarmento
1
Table of Contents
Abstract ... 3 1. Introduction ... 4 2. Literature Review ... 6 3. Methodology ... 10 4. Overview of DTA’s ... 14 4.1-Deferred Taxes ... 14 4.1.1-Temporary differences ... 144.1.2-Unused fiscal losses and reporting of unused fiscal credit ... 15
4.1.3-Revaluation of previously unrecognised DTA’s ... 15
4.1.4-Subsidiary investments ... 16
4.2-Mensuration and accounting of DTA’s ... 16
4.3.-Overview on the Basel diplomas... 17
4.3.1-BASEL I ... 17 4.3.2- BASEL II ... 18 4.3.3-BASEL III ... 19 5. Results ... 20 5.1. Statistical Analysis ... 20 5.2-Econometric Analysis ... 26 5.2.1- difTIER1 ... 26 5.2.2. difDebtEquity ... 28
5.2.3. TIER 1 without DTA ... 30
6. Conclusion ... 32
7. References ... 34
8. Abbreviation Glossary ... 37
2
Graph Index
Graph 1.-Portuguese Banking Net Income (in millions of Euros) ... 20
Graph 2.Sum of Yearly Banking Dta's( in millions of Euros) ... 21
Graph 3.-Dta's as a percent of Losses (bcp 2014 value of 2000% removed for scaling)22 Graph 4.-Average Percentage of Dta's as Equity………23
Table Index
Table 1.-OLS difTIER1 dependent variable... 26Table 2.-GLM difTier1 dependent variable ... 27
Table 3.-OLS difDebtEquity dependent variable ... 28
Table 4.-GLM difDebtEquity dependent variable ... 29
Table 5.-OLS TIER1 without DTA dependent variable... 30
Table 6.-GLM TIER1 without DTA dependent variable ... 31
Appendix Index
Appendix 1-Variable Description Table ... 38Appendix 2-Variables descriptives ... 40
3
Abstract
Deferred Tax Assets in Portuguese banking have increased tremendously during the past few years. In this paper we try to achieve some conclusions about the impact and relevance of these types of assets in banking results and performance. We conducted a Statistic and Econometric analysis to test the relevance and significance of these assets in results. We have concluded that the weighting and amount of Dta’s in the Portuguese banking system has indeed influenced results, especially after the introduction of the new CRD IV / CRR directive in 2014. We have also concluded that the accumulation of these assets and the lack of reversal conditions in the Portuguese banking systems has brought some unpredicted scenarios.
4
1. Introduction
The financial crisis that has settled in the last few years has taken its toll on international banking. In a time where economic changes are constant, financial institutions are forced to adapt and follow new, more restrictive, rules. A lot has changed during the last ten years. The 2008 financial crisis marked the beginning of the turmoil in the international financial structure and the way financial institutions are positioned in the market. Banks are one of the main pillars of the world economy, especially in recent times, where both private and corporate needs for financing are growing. This relevance is particularly noticeable in Europe where banks are traditionally the main source of financing.
Portuguese Banking is not an exception to this reality. The Portuguese economic environment has mutated tremendously during the last decade, not only because of the crisis, but also because of a series of economic, financial, political and legislative events. Along with the crisis effect, 2008 was marked as a dark year for national banking with the end of BPN (Banco Portugues de Negócios) that after financial scandals and liquidity problems had to be nationalised and later sold to BIC.
After the on-set of the financial crisis in 2008, Portuguese banks had to adapt to new accounting norms in 2010 with the introduction of SNC (Sistema de Normalização Contabilistica) that replaced the old POC (Plano Oficial de Contabilidade). The real downshift in banking results started in 2011. The arrival of Troika and the strict financial measures that were imposed on the population generated huge impairment losses in banking account receivables and increased credit default. In the later years
5
Portugal lost two important player in the banking industry, BES (Banco Espírito Santo) that defaulted in 2014 and BANIF (Banco Internacional do Funchal) in 2015.
The significant losses in the sector have led to the subsequent generation and accumulation of Deferred Tax Assets in the industry. We have two main questions: 1) What is the theoretical relevance of these assets in the firm’s accounts? And 2) What is the practical impact in the firm’s accounts? We have done some research and built a data base with the accounts from 2005 to 2015 and conducted some descriptive statistics and econometric analysis to answer these questions.
6
2. Literature Review
Deferred tax assets have been in the scope of many authors in the past years, the relation between deferred taxes and companies’ earnings has been studied and some fundamental relations have been found.
As for any tax related topic, the current tax law is the main determinant on how we approach these subjects. There have been many attempts to reach a higher level of tax harmonization and conformity in the way on how income tax is treated, that is, to uniformize or at least find some standardized tax rates across international entities, but the complexity of this topic has raised some issues and critics; Hanlon, et al (1992). Some pros and cons of conforming book and taxable income to one measure have been discussed. The potential benefits would include lower compliance costs for reporting income and the potential lowering of incentives to mislead the IRS (North American Tax Authority) and capital markets (basically deterring entities from engaging into tax shelters and schemes). The main handicap of this system would be the inevitable loss of information about the company’s accounts, as well as some inevitable losses or companies were the geographical tax rates are generally lower than average; Hanlon, et al (1992).
Atwood, et al (2010); also provided some insights on this topic, they stated that earnings persistence and the association between current earnings and future cash flows are lower when the level of required book-tax conformity is higher. This relation makes so that any movement towards book-tax conformity would likely result in reported accounting earnings that would be less persistent and less predictive of future cash flows.
7
On the topic of information translated by company accounts, Olivero and Trabelsi conducted a study between 1994 and 2003 in the U.S. to analyse the relation between the information content of financial statements and the net deferred taxes account. First of all they concluded that deferred tax information is more relevant when evaluating companies using the standardized US GAAP than evaluating those that are not. They also found that using the liability method for deferred taxes is more relevant when evaluating the firm. The main conclusion was indeed that the exclusion of deferred taxes from the results helped access the main differences from the sample company’s performance.
Laux (2013) also conducted a study to analyse if the deferred tax account provides any type of information regarding future tax payments. He found that even though some information may be found, the quality of this evidence was not satisfactory. He argues that there are some differences between theory and what is done in practice and because of that some contradictions on the information content of these accounts can be generated. This is highly related to the cost/benefit of disclosing information on deferred taxes since that the cost of acquiring and utilizing this information seems to nullify the benefits.
Also on the topic of information Burgstahler, et al (2002), concluded that in
some occasions managers tend to manipulate the net deferred tax asset account to increase earnings and avoid losses. This possible manipulation is also something that we should keep in mind when evaluating balance sheets where such accounts are present.
The valuation and accounting of deferred tax assets is the topic that interests us the most. The most important thing to notice is that deferred tax assets add value to the balance sheet, this happens because they represent the deferral of tax payments, so their
8
value is the net present value of the tax benefits; Eli Amir, et al (1997). It is important to note that classical accounting relations only hold when the deferred tax value is indeed adjusted to its net present value; Eli Amir, et al (1997).
Naturally as we evaluate deferred taxes, we may find both deferred tax assets and deferred tax liabilities, the difference will result in net deferred taxes. In an attempt to determine the best way to account for deferred taxes Amir and its peers conducted some research where they introduced net deferred taxes as a completely distinct category of assets, using the market value of equity per share as the dependent value. They have reached some interesting conclusions, especially on how investors look upon these assets. They have found that the valuation coefficient on deferred tax liabilities from depreciation and amortization was close to zero; also, deferred taxes from restructuring charges had valuation coefficients larger than other deferred tax components. They have also concluded that the net realizable value of deferred taxes from losses and credits carried forward were negatively correlated with stock prices. In the end they concluded that even though these types of assets are very different in nature from the rest of the assets in the balance sheet, they should nonetheless be accounted for in a way similar to any other asset or liability.
This issue of deferred tax accounting seems to be persistent. The premise is simple, deferred taxes should be accounted on a present value basis on the principle that they will be discounted in future cash flows. The problem is that under the actual rules adopted by FASB (Financial Accounting Standards Board), the deferred tax accounts are, in many cases, unlikely to reverse in the foreseeable future, due to the fact that companies seem to be able to defer taxes indefinitely; Ron Colley, et al (2006).
9
These authors address this statement in the study “Deferred Taxes in the Context of the Unit Problem” where they remove the deferred tax assets from the balance sheets. They defend that income taxation is an aggregate phenomenon and that an aggregate approach is required, making the flow-through method of accounting the best candidate. This accounting method for tax results would lower the Debt-to-Equity ratio for most firms improving their position. They argue that as long as we see taxation as a transaction between the private and public sectors and the governmental authority then this method would result in an equality of the tax provision and the cash outflow for a certain period, therefore eliminating deferred tax assets and liabilities. This idea of removing deferred taxes from the balance sheet has been supported by other authors like Chaney (1989) and Ketz (2010). They argue that deferred tax accounting is too complex, too expensive and too inconsistent with the US GAAP.
10
3. Methodology
The main objective of this dissertation is to evaluate the relevance of Dta’s in Portuguese banking in the last ten years (2005-2015). We want to answer two main questions: What is the theoretical relevance of Deferred Tax Assets in Portuguese banking? And, what is the practical impact of these Dta’s in Portuguese Banking?
We have selected a sample of nine portuguese banks: Caixa Geral de Depósitos (CGD); Banco Português de Investimento (BPI), Millennium Banco Comercial Português (BCP), Banco Popular Portugal (BAPOP), Banco Internacional do Funchal (BANIF), Banco Espírito Santo (BES), Montepio Geral (MONTEPIO); Caixa Agrícola (CA) e Santander Totta (SANTANDER). These are the largest Portuguese banks for which we had available information that was relevant for our model. We have collected all consolidated financial reports from these institutions from the year 2005 to 2015.
To answer our research questions we conducted a two stage data analysis. First we prepared some descriptive statistics were we analyzed the sector’s evolution and researched the presence and weighting of deferred tax assets in the banks accounts. Second, we conducted an econometric analysis to evaluate the relations and dependency between the selected variables, focusing on the effect of Dta’s. The variables are presented below:
Dependent Variables
Tier 1 with DTA (tier1), it’s the ratio between the firm’s core equity capital and
its total risk-weighted assets including DTA’s (applicable from 2014 onwards). This variable is presented as a percentage.
11
Tier 1 without DTA (tier1withoutdta), it’s the ratio between the firm’s core
equity capital and its total risk-weighted assets excluding DTA’s (applicable from 2005 to 2013). This variable is presented as a percentage.
D/E (debttoequity), it’s the ratio used to measure financial leverage. It is
computed by dividing a company’s total liabilities by stockholder’s equity. This variable is presented as a percentage of equity.
Independent Variables
Annual DTA (DTAan) represents the yearly total Deferred Tax Assets account.
As seen before, deferred tax assets are the result of differences between accounting and fiscal norms that generate future redeemable amounts. This variable is presented in Euros.
Accumulated DTA (DTAac) represents the accumulated Deferred Tax Asset
Account over the years. This variable is presented in Euros.
Financial Crisis (fincrisis) is a dummy variable for the 2008 financial crisis.
Troika (troika) is a dummy variable for the 2011 Troika intervention in Portugal.
Change in Law (changelaw2014) is a dummy variable for the law 61/2014 that
allowed the deduction of Dta’s as a tax benefit and their inclusion in the solvency ratios. Control Variables
Assets (lnassets), it’s the Ln of the total assets for each year. This variable is
12
Computed ROA (ROAc), it’s the manually computed Return on Assets. It’s an
indicator on the profitability of the institution relative to its total assets. This variable is presented as a percentage.
Financial Margin (finmargin), it’s the yearly Reduced Financial Margin. This
variable is presented in Euros.
Sales (logsales), it’s the logarithm of yearly Sales. This variable is presented in
Euros.
Default Credit (creditdefault), it’s the defaulted credit amount divided by the
conceded credit account. This variable is presented as a percentage.
Cost to Income (costtoincome), it’s an indicator of the firm’s efficiency. It
weights the operating costs with the operating income. This variable is presented as a percentage.
ECB lending (logecblending), it’s the amount of credit received from the central
bank. This variable is presented in Euros.
Banks lending (banks lending), it’s the amount of credit received from other
financial institutions. This variable is presented in Euros.
For the econometric analysis we used two models: OLS and GLM. The Ordinary Least Squares (OLS) is used for estimating unknown values in a linear regression. This method tries to find the line of best fit for a certain input (dataset), by minimizing the sum of the squares of the differences resulting from the observed values and the anticipated values predicted by the model. This model assumes that the errors are normally distributed.
13
The Generalized Linear Model (GLM) is another linear regression model that assumes that the errors do not follow a normal distribution. This is a good complement to the OLS since it is a more flexible and generalized model, fitting for comparisons.
14
4. Overview of DTA’s
4.1-Deferred Taxes
Deferred taxes are the result of differences between accounting and fiscal norms. These differences can originate both DTA’s (Deferred Tax Assets) and DTL’s (Deferred Tax Liabilities). Even though this dissertation is more incident on the DTA subject it is also important to also acknowledge the importance of the counterpart (DTL). Deferred Tax liabilities are the opposite of DTA’s, they represent future payable accounts and are also a product of differences between the book-value and the taxable base. These deferred liabilities can be originated by installment sales, for an instance, where the capital gain from the payments (installments) can be deferred to future years.
DTA’s refer to future redeemable amounts which can be originated under the following conditions: 1) temporary deductible differences, 2) reporting of unused fiscal losses and reporting of unused fiscal credit, 3) revaluation of previously unrecognised DTA’s and subsidiary investments.
4.1.1-Temporary differences
Temporary Differences represent differences between the reported amounts of an asset or liability in the balance sheet and its taxable base (5 NCRF 25).There are both taxable temporary differences and deductible temporary differences:
Taxable Temporary Differences are differences that result in
taxable amounts when determining the taxable profit (loss) of future periods when the reported amount of the asset or liability is recovered or paid. A Deferred Tax Liability should be recognised for all taxable temporary differences except for: Goodwill, a tax originated from a
15
concentration of entrepreneurial activity (51, NCRF 25) or if a transaction is directly recognized in the company’s equity.
Deductible Temporary Differences are differences that result in
deductible amounts when determining the taxable profit (loss) of future periods when the reported amount of the asset or liability is recovered or paid. A Deferred Tax Asset should be recognised for all deductible temporary differences to the point that the existence of a taxable profit is likely to occur and where that asset can be deducted. The exceptions are when the tax originated from a concentration of entrepreneurial activity
(51, NCRF 25) or if a transaction is directly recognized in the company’s
equity.
It’s important to note that unpaid current taxes should be accounted as a Deferred Tax Liability. Also, if the amount paid exceeds the current tax liabilities, the excess should be accounted as a Deferred Tax Asset (12 and 15, NCRF 25).
4.1.2-Unused fiscal losses and reporting of unused fiscal credit
A DTA should be recognised for reporting unused fiscal losses and unused tax credits to the extent that a taxable profit is likely to occur and where that asset can be deducted ( 31. NCRF 25).
4.1.3-Revaluation of previously unrecognised DTA’ s
An entity can recognize a previously unrecognised DTA to the extent that a taxable profit is likely to occur and where that asset can be deducted. (34. NCRF 25).
16
4.1.4-Subsidiary investments
These differences appear when the carrying amount of investments in subsidiaries is different from the taxable base (which in many cases represents the associated cost of the investment). In these cases a DTL should be reported.
4.2-Mensuration and accounting of DTA’s
For the paper at hand it is also important to understand how these assets (liabilities) should be mensurated. DTA’s (DTL’s) should be reported based on the expected tax rates at the time that the assets or liabilities are expected to be recovered/paid. These tax rates are based on the current year rates (44 NCRF 25). NCRF 25 also refers that most deferred tax assets appear when the gains/expenses are included in the accounting profit of a period, as long as they are included in the taxable profit (tax loss) of a different period (53 NCRF 25).
It’s also very important to note that deferred taxes should never be discounted ( we shouldn’t calculate the present value of the asset/liability). This norm exists so that deferred tax assets/liabilities are comparable between identities at any time.(47 and 48, NCRF 25).
As a main guideline, we can identify some situations where a deferred tax asset/liability could be recognized. These situations are the main source of these assets/liabilities:
The existence of tax losses, current or accumulated, which the identity intends to
discount during the legal deadline.
Accounting of assets impairment
17
Accounting of non-fiscally accepted provision costs
Recognition of subsidies for investment in the entity’s equity
Accounting of non-fiscally accepted fair value asset revaluation
When opting for the tangible assets revaluation model
When opting for the intangible assets revaluation model
4.3.-Overview on the Basel diplomas
The Basel diplomas are especially relevant for this dissertation. These standardized rules and requirements are the basis on which international banks comply. The way DTA’s are treated and considered in the capital requirements has changed over the years and, in consequence, the impact of these assets will be noticeable in the results. We will begin by presenting an overview on these diplomas:
4.3.1-BASEL I
The Basel I accord was first issued in 1988. The idea was to create a classification of banking assets and associated risk as well as minimum capital requirements for international banks. Banks are required to maintain capital (classified as tier 1 and tier 2) at least equal to 8% of its RWA’s (Risk-Weighted Assets). For tier 1 capital we consider shareholders’ equity (or stock issues) and reserves. For tier 2 capital we consider all other capital like guaranteed long term debt and returns on investment assets. This accord focused mainly on bank’s credit risk and attributed scaled risk percentages according to the nature of the bank’s owned debt.
18
4.3.2- BASEL II
This accord followed Basel I and expanded the rules for the minimum capital requirements and provided some framework for regulatory review. This diploma stands on three pillars: Capital requirements, market discipline and regulatory supervision.
On the minimum capital requirements perspective the 8% minimum is still in effect, as well as the tier nomenclature, with the addition of tier 3 capital, characterised by the sum of tier 2 capital with short term subordinated debt. Another important change was the way how RWA’s are considered in the equation. Basel II takes into account the rating of the assets credit risk, with this, banks that hold riskier debt will have a harder time achieving a favourable capital ratio.
The second and third pillars provide some standardization on the framework on how regulatory agencies should access many aspects of the banking activity. This framework is especially significant in the identification of the several separate types of risk that banking agencies may hold. The third pillar consists on a series of transparency and disclosure agreements that are especially useful for any type of entity that relies on financial statements information. This includes costumers and investors as well as audit and regulatory agencies.
19
4.3.3-BASEL III
The introduction of Basel III is the one that interests us the most on the DTA topic since it is the most restrictive and complete of the Basel’s so far since late 2009. In comparison with Basel II, the minimum common equity tier 1 capital requirement changed from 4% to 4.5% and the minimum tier 1 capital from 4% to 6%.
This diploma introduced some countercyclical measures to hedge banks against cyclical credit expansion and retraction. Also, banks were grouped according to their size and relevance in the market (bucketing). Higher relevance banks must maintain higher countermeasures. Additionally, leverage and liquidity measures were implemented to protect against over-borrowing. The main indicator is the new leverage ratio with a mandatory cap at 3%.
20
5. Results
5.1. Statistical Analysis
To analyse the impact of Dta’s in Portuguese banking we must first have an overview of the reported results over the last few years. The figure below illustrates the evolution of the net income of the considered sample banks:
Portuguese Banking Net Income
Graph 1.-Portuguese Banking Net Income (in millions of Euros)
We can observe a steady increase in results until 2007 and then a noticeable retraction after 2008. The financial crisis definitely took its toll on the banking sector. The results become negative from 2011 to 2014. This negative performance coincides with the arrival of Troika in 2011 and the austerity measures taken during the following years. During this year there were also some critical changes that had an immediate impact in banking results. During the last quarter of 2011 a significant portion of pension funds from banks were transferred to the Social Security, the costs of this transaction were immediately registered as a loss. Additionally, the accounting rules for the recognition of gains and losses from pension funds have changed, which translated into immediate losses that, at current law, will only be fiscally deductible in ten years.
(12.000,00) (10.000,00) (8.000,00) (6.000,00) (4.000,00) (2.000,00) 2.000,00 4.000,00 2005 2006 2007 2008 2009 2010 2011 2012 2013 2014 2015
21
The greatest hit in the results appears on the turbulent year of 2014, with the default of one of the biggest private Portuguese banks BES (Banco Espírito Santo) in August of that year. This was also the last reported year of Banif (Banco Internacional do Funchal) which was acquired by Santander Totta in the following year. The year of 2015 marked the return of overall profit for the sector, driven by the remarkable recovery of BPI (Banco Português de Investimento), BCP (Banco Comercial Português) and Santander. The public bank CGD (Caixa Geral de Depositos) still registered losses from 2011 until the present date.
We will now analyse the evolution of reported Dta’s over the same time period. Below we have an illustration of the evolution of these assets:
Sum of Yearly DTA’s
Graph 2.Sum of Yearly Banking Dta's( in millions of Euros)
As expected deferred tax assets have grown significantly over the past years, given the losses that were registered by the banking sector, as illustrated in graph 1. We can observe an overall rise in Dta’s from 2008 to 2010 and then a major increase from 2011 onwards. The registered losses are reflected in the rise and accumulation of deferred tax assets. 0 1.000 2.000 3.000 4.000 5.000 6.000 7.000 2005 2006 2007 2008 2009 2010 2011 2012 2013 2014 2015
22
These results reflect the rapid increase in Dta’s in the past years. We can see that the accrual is significantly higher since 2011. Portuguese banking is characterised by a high degree of Dta retention, not only because they are constantly being generated but also because the generating temporary differences are only reversed when there are registered losses associated with the correspondent provisioning. The nature of the banking business is prone to generating this type of assets given the nature of the conceded credits account and the growing impairment losses during the last years.
Another interesting aspect is to compare the evolution of deferred tax assets in the presence of losses. The representation can be seen below:
DTA’s as a Percent of Losses
Graph 3.-Dta's as a percent of Losses (bcp 2014 value of 2000% removed for scaling)
Our Portuguese banking sample did not register any losses before 2011, but from 2011 onwards seven out of nine presented negative results at some point. In the years where losses were registered, we can see that the DTA amount largely surpasses
0,00% 100,00% 200,00% 300,00% 400,00% 500,00% 600,00% 700,00% 800,00% 900,00% 1000,00%
CGD BPI BCP BAPOP BANIF BES MONTEPIO
2011 2012 2013 2014 2015
23
the value lost. The general tendency is that the increasing DTA’s accumulated during these years have become increasingly more expressive as a percentage of losses.
The Deferred Tax Asset Account is accounted as an Asset and is balanced in Equity. This creates and effect were a rise in Dta’s will also result in a rise in Equity by the same amount. The following graph illustrates this effect:
Average Percentage of DTA’s as Equity
Graph 4.-Average Percentage of Dta's as Equity
It is easy to conclude that the weight of Dta’s in equity is in line with the evolution of total Dta’s in Portuguese banking. This shows us that the weight of the reserves account associated with deferred tax assets has gained some relevance in recent years. The peak is definitely 2011, where Dta’s represented, on average, about 30% of Portuguese banking equity. In comparison with graph 2, were the average total DTA’s remained stable until 2015, the percentage in equity has been decreasing during the past years. 0% 5% 10% 15% 20% 25% 30% 35% 2005 2006 2007 2008 2009 2010 2011 2012 2013 2014 2015
24
It’s also important to analyse the evolution of the Tier1 and CET1 essential ratios:
Average Tier1 and CET1
Graph 5.-Average Tier1 and CET1
The Tier 1 and common equity Tier 1 tier 1 ratios measure the weight between the firm’s core equity capital and its total risk-weighted assets. This capital ratio is extremely important in the banking industry since it measures how well capitalized a
firm is and how well it can absorb losses during recession times. The minimal
requirements have changed over the years (please refer to chapter 4), during this time period Portuguese banks have been able to maintain the set requirements. From direct observation we can see that there was a rising tendency until 2013, then a decrease in 2014, followed by a recovery in 2015. There are some aspects that we need to keep in mind when analysing these last years. The new CRD IV / CRR directive, applicable from 2014 onwards that defined new rules for the computation of these ratios (with the inclusion of Dta’s and tax credits that rely on future profitability) must be taken into account when looking into these changes. After the implementation of this directive the general tendency was for a expected natural rise in the ratio, given the amount of DTA’s
0,00% 2,00% 4,00% 6,00% 8,00% 10,00% 12,00% 14,00% 2005 2006 2007 2008 2009 2010 2011 2012 2013 2014 2015 Average Tier1 Average common equity Tier1
25
in Portuguese Banking. Also, the incidents with BES and Banif are also relevant, from 2014 onwards we no longer have the participation of BES in the ratios and in 2015 the same applies to Banif. The general recovery of the remaining sample results and the inclusion of the new directive seem to be the main causes of this improvement.
26
5.2-Econometric Analysis
At this stage we will analyse the relations between the selected variables in order to try to respond to the main proposed questions. We have constructed six tables with the Stata software. For each dependent variable we ran both OLS and GLM regressions using various combinations of independent variables. We have ruled out highly correlated variables (please refer to the appendix). For each regression we include the effect of either the “DTA year” or the “DTA accum” variables to test for the significance of these independent variables.
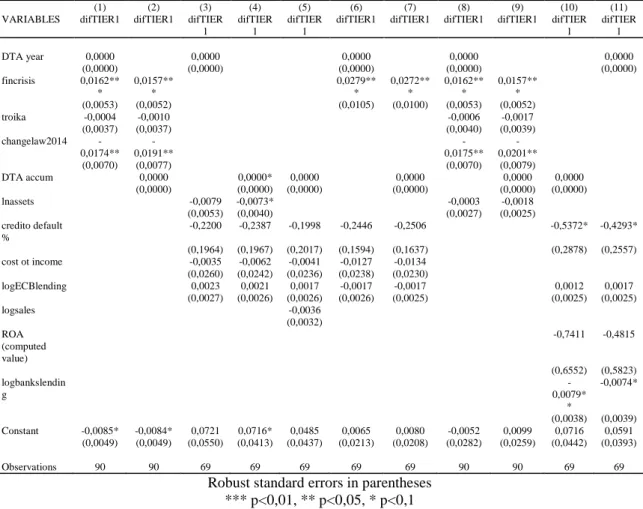
5.2.1- difTIER1
First, we analyse the difTIER1 variable:
Table 1.-OLS- Tier1 Significance analysis
(1) (2) (3) (4) (5) (6) (7) (8) (9) (10) (11) VARIABLES difTIER1 difTIER1 difTIER
1 difTIER 1 difTIER 1 difTIER 1 difTIER 1
difTIER1 difTIER1 difTIER 1 difTIER 1 DTA year (millions of Euros) 0,0000 0,0000 0,0000 0,0000 0,0000 (0,0000) (0,0000) (0,0000) (0,0000) (0,0000) fincrisis 0,0162** * 0,0157** * 0,0279* * 0,0272* * 0,0162** * 0,0157** * (0,0054) (0,0054) (0,0109) (0,0104) (0,0054) (0,0054) troika -0,0004 -0,0010 -0,0006 -0,0017 (0,0038) (0,0038) (0,0042) (0,0040) changelaw2014 -0,0174** -0,0191** -0,0175** -0,0201** (0,0072) (0,0079) (0,0072) (0,0082) DTA accum 0,0000 0,0000 0,0000 0,0000 0,0000 0,0000 (0,0000) (0,0000) (0,0000) (0,0000) (0,0000) (0,0000) lnassets -0,0079 -0,0073* -0,0003 -0,0018 (0,0055) (0,0041) (0,0028) (0,0025) credit default% -0,2200 -0,2387 -0,1998 -0,2446 -0,2506 -0,5372* -0,4293 (0,2040) (0,2044) (0,2096) (0,1656) (0,1701) (0,2990) (0,2656) cost ot income -0,0035 -0,0062 -0,0041 -0,0127 -0,0134 (0,0270) (0,0251) (0,0245) (0,0247) (0,0239) logECBlending 0,0023 0,0021 0,0017 -0,0017 -0,0017 0,0012 0,0017 (0,0028) (0,0027) (0,0027) (0,0028) (0,0026) (0,0026) (0,0026) logsales -0,0036 (0,0033) ROA (computed value) -0,7411 -0,4815 (0,6807) (0,6050) logbankslendin g -0,0079* -0,0074* (0,0040) (0,0041) Constant -0,0085* -0,0084* 0,0721 0,0716* 0,0485 0,0065 0,0080 -0,0052 0,0099 0,0716 0,0591 (0,0050) (0,0050) (0,0571) (0,0429) (0,0454) (0,0221) (0,0216) (0,0291) (0,0267) (0,0459) (0,0409) Observations 90 90 69 69 69 69 69 90 90 69 69 R-squared 0,1799 0,1912 0,0675 0,0797 0,0567 0,1903 0,1917 0,1800 0,1949 0,1434 0,1157
Robust standard errors in parentheses *** p<0,01, ** p<0,05, * p<0,1
27 Table 2.-GLM-Tier1 Significance analysis
(1) (2) (3) (4) (5) (6) (7) (8) (9) (10) (11) VARIABLES difTIER1 difTIER1 difTIER
1
difTIER 1
difTIER 1
difTIER1 difTIER1 difTIER1 difTIER1 difTIER 1 difTIER 1 DTA year 0,0000 0,0000 0,0000 0,0000 0,0000 (0,0000) (0,0000) (0,0000) (0,0000) (0,0000) fincrisis 0,0162** * 0,0157** * 0,0279** * 0,0272** * 0,0162** * 0,0157** * (0,0053) (0,0052) (0,0105) (0,0100) (0,0053) (0,0052) troika -0,0004 -0,0010 -0,0006 -0,0017 (0,0037) (0,0037) (0,0040) (0,0039) changelaw2014 -0,0174** -0,0191** -0,0175** -0,0201** (0,0070) (0,0077) (0,0070) (0,0079) DTA accum 0,0000 0,0000* 0,0000 0,0000 0,0000 0,0000 (0,0000) (0,0000) (0,0000) (0,0000) (0,0000) (0,0000) lnassets -0,0079 -0,0073* -0,0003 -0,0018 (0,0053) (0,0040) (0,0027) (0,0025) credito default % -0,2200 -0,2387 -0,1998 -0,2446 -0,2506 -0,5372* -0,4293* (0,1964) (0,1967) (0,2017) (0,1594) (0,1637) (0,2878) (0,2557) cost ot income -0,0035 -0,0062 -0,0041 -0,0127 -0,0134 (0,0260) (0,0242) (0,0236) (0,0238) (0,0230) logECBlending 0,0023 0,0021 0,0017 -0,0017 -0,0017 0,0012 0,0017 (0,0027) (0,0026) (0,0026) (0,0026) (0,0025) (0,0025) (0,0025) logsales -0,0036 (0,0032) ROA (computed value) -0,7411 -0,4815 (0,6552) (0,5823) logbankslendin g -0,0079* * -0,0074* (0,0038) (0,0039) Constant -0,0085* -0,0084* 0,0721 0,0716* 0,0485 0,0065 0,0080 -0,0052 0,0099 0,0716 0,0591 (0,0049) (0,0049) (0,0550) (0,0413) (0,0437) (0,0213) (0,0208) (0,0282) (0,0259) (0,0442) (0,0393) Observations 90 90 69 69 69 69 69 90 90 69 69
Robust standard errors in parentheses *** p<0,01, ** p<0,05, * p<0,1
Analysing the various combinations of variables we can see that some seem to be more relevant when predicting the behaviour of the dependent variable. The regressions that include the effect of the financial crisis, the arrival of Troika and the new 2014 law seem to be more relevant in explaining the evolution of the TIER 1 ratio
than the others when comparing the R2 values. These events seem to have a higher
impact on the Tier1 value than other factors like the amount of non-performing credit and Sales values.
28
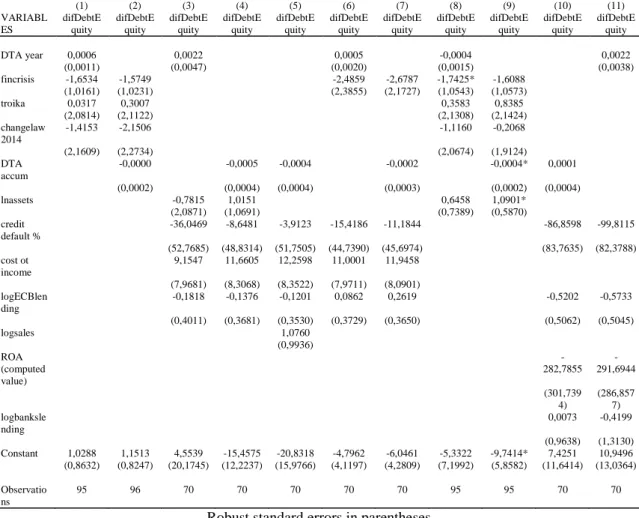
5.2.2. difDebtEquity
Table 3.-OLS- Debt to Equity Ratio Significance analysis
(1) (2) (3) (4) (5) (6) (7) (8) (9) (10) (11) VARIABL ES difDebtE quity difDebtE quity difDebtE quity difDebtE quity difDebtE quity difDebtE quity difDebtE quity difDebtE quity difDebtE quity difDebtE quity difDebtE quity DTA year 0,0006 0,0022 0,0005 -0,0004 0,0022 (0,0012) (0,0049) (0,0021) (0,0015) (0,0039) fincrisis -1,6534 -1,5749 -2,4859 -2,6787 -1,7425 -1,6088 (1,0384) (1,0454) (2,4769) (2,2560) (1,0835) (1,0866) troika 0,0317 0,3007 0,3583 0,8385 (2,1272) (2,1581) (2,1899) (2,2017) changelaw 2014 -1,4153 -2,1506 -1,1160 -0,2068 (2,2084) (2,3228) (2,1247) (1,9654) DTA accum -0,0000 -0,0005 -0,0004 -0,0002 -0,0004* 0,0001 (0,0002) (0,0005) (0,0004) (0,0003) (0,0002) (0,0005) lnassets -0,7815 1,0151 0,6458 1,0901* (2,1671) (1,1100) (0,7594) (0,6032) credit default% -36,0469 -8,6481 -3,9123 -15,4186 -11,1844 -86,8598 -99,8115 (54,7910) (50,7030) (53,7340) (46,4537) (47,4489) (86,9740) (85,5362) cost ot income 9,1547 11,6605 12,2598 11,0001 11,9458 (8,2735) (8,6252) (8,6723) (8,2766) (8,4001) logECBlen ding -0,1818 -0,1376 -0,1201 0,0862 0,2619 -0,5202 -0,5733 (0,4165) (0,3823) (0,3666) (0,3872) (0,3790) (0,5256) (0,5238) logsales 1,0760 (1,0316) ROA (computed value) -282,7855 -291,6944 (313,304 4) (297,852 4) logbanksle nding 0,0073 -0,4199 (1,0007) (1,3633) Constant 1,0288 1,1513 4,5539 -15,4575 -20,8318 -4,7962 -6,0461 -5,3322 -9,7414 7,4251 10,9496 (0,8822) (0,8427) (20,9478) (12,6922) (16,5889) (4,2776) (4,4450) (7,3987) (6,0205) (12,0876) (13,5360) Observatio ns 95 96 70 70 70 70 70 95 95 70 70 R-squared 0,0232 0,0329 0,0468 0,0523 0,0554 0,0558 0,0598 0,0293 0,0441 0,0649 0,0720
Robust standard errors in parentheses *** p<0,01, ** p<0,05, * p<0,1
29 Table 4.-GLM- Debt to Equity Ratio Significance Analysis
(1) (2) (3) (4) (5) (6) (7) (8) (9) (10) (11) VARIABL ES difDebtE quity difDebtE quity difDebtE quity difDebtE quity difDebtE quity difDebtE quity difDebtE quity difDebtE quity difDebtE quity difDebtE quity difDebtE quity DTA year 0,0006 0,0022 0,0005 -0,0004 0,0022 (0,0011) (0,0047) (0,0020) (0,0015) (0,0038) fincrisis -1,6534 -1,5749 -2,4859 -2,6787 -1,7425* -1,6088 (1,0161) (1,0231) (2,3855) (2,1727) (1,0543) (1,0573) troika 0,0317 0,3007 0,3583 0,8385 (2,0814) (2,1122) (2,1308) (2,1424) changelaw 2014 -1,4153 -2,1506 -1,1160 -0,2068 (2,1609) (2,2734) (2,0674) (1,9124) DTA accum -0,0000 -0,0005 -0,0004 -0,0002 -0,0004* 0,0001 (0,0002) (0,0004) (0,0004) (0,0003) (0,0002) (0,0004) lnassets -0,7815 1,0151 0,6458 1,0901* (2,0871) (1,0691) (0,7389) (0,5870) credit default % -36,0469 -8,6481 -3,9123 -15,4186 -11,1844 -86,8598 -99,8115 (52,7685) (48,8314) (51,7505) (44,7390) (45,6974) (83,7635) (82,3788) cost ot income 9,1547 11,6605 12,2598 11,0001 11,9458 (7,9681) (8,3068) (8,3522) (7,9711) (8,0901) logECBlen ding -0,1818 -0,1376 -0,1201 0,0862 0,2619 -0,5202 -0,5733 (0,4011) (0,3681) (0,3530) (0,3729) (0,3650) (0,5062) (0,5045) logsales 1,0760 (0,9936) ROA (computed value) -282,7855 -291,6944 (301,739 4) (286,857 7) logbanksle nding 0,0073 -0,4199 (0,9638) (1,3130) Constant 1,0288 1,1513 4,5539 -15,4575 -20,8318 -4,7962 -6,0461 -5,3322 -9,7414* 7,4251 10,9496 (0,8632) (0,8247) (20,1745) (12,2237) (15,9766) (4,1197) (4,2809) (7,1992) (5,8582) (11,6414) (13,0364) Observatio ns 95 96 70 70 70 70 70 95 95 70 70
Robust standard errors in parentheses *** p<0,01, ** p<0,05, * p<0,1
When analysing the Debt-to-Equity regressions we can observe that none of the
R2 are particularly high. Our variables do not seem to explain the evolution of this ratio
and do not seem to influence it on a significant level. The changes in Debt-and-Equity are probably not strongly related with the scope of our study. We have seen that DTA’s have occupied a higher percentage in equity in recent years, however, that does not seem to affect this ratio.
30
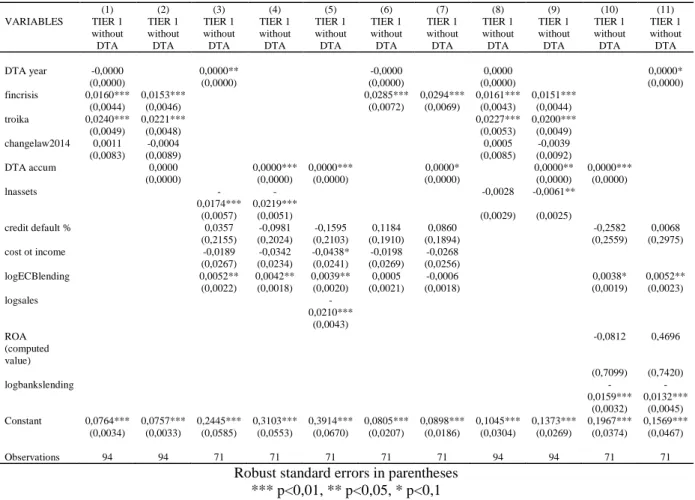
5.2.3. TIER 1 without DTA
Table 5.-OLS- Tier1 without the effect of DTA’s significance analysis
(1) (2) (3) (4) (5) (6) (7) (8) (9) (10) (11) VARIABLES TIER 1 without DTA TIER 1 without DTA TIER 1 without DTA TIER 1 without DTA TIER 1 without DTA TIER 1 without DTA TIER 1 without DTA TIER 1 without DTA TIER 1 without DTA TIER 1 without DTA TIER 1 without DTA DTA year -0,0000 0,0000** -0,0000 0,0000 0,0000 (0,0000) (0,0000) (0,0000) (0,0000) (0,0000) fincrisis 0,0160** * 0,0153** * 0,0285** * 0,0294** * 0,0161** * 0,0151** * (0,0045) (0,0047) (0,0075) (0,0071) (0,0045) (0,0045) troika 0,0240** * 0,0221** * 0,0227** * 0,0200** * (0,0050) (0,0049) (0,0055) (0,0050) changelaw201 4 0,0011 -0,0004 0,0005 -0,0039 (0,0085) (0,0090) (0,0087) (0,0094) DTA accum 0,0000 0,0000** * 0,0000** * 0,0000 0,0000** 0,0000** * (0,0000) (0,0000) (0,0000) (0,0000) (0,0000) (0,0000) lnassets -0,0174** * -0,0219** * -0,0028 -0,0061** (0,0059) (0,0053) (0,0030) (0,0026) credit default % 0,0357 -0,0981 -0,1595 0,1184 0,0860 -0,2582 0,0068 (0,2237) (0,2101) (0,2182) (0,1982) (0,1966) (0,2656) (0,3087) cost ot income -0,0189 -0,0342 -0,0438* -0,0198 -0,0268 (0,0278) (0,0243) (0,0250) (0,0280) (0,0266) logECBlendin g 0,0052** 0,0042** 0,0039* 0,0005 -0,0006 0,0038* 0,0052** (0,0023) (0,0019) (0,0020) (0,0022) (0,0019) (0,0020) (0,0024) logsales -0,0210** * (0,0045) ROA (computed value) -0,0812 0,4696 (0,7367) (0,7700) logbankslendi ng -0,0159** * -0,0132** * (0,0033) (0,0046) Constant 0,0764** * 0,0757** * 0,2445** * 0,3103** * 0,3914** * 0,0805** * 0,0898** * 0,1045** * 0,1373** * 0,1967** * 0,1569** * (0,0035) (0,0034) (0,0607) (0,0574) (0,0695) (0,0214) (0,0193) (0,0313) (0,0277) (0,0388) (0,0485) Observations 94 94 71 71 71 71 71 94 94 71 71 R-squared 0,4234 0,4257 0,2387 0,3755 0,4139 0,2577 0,2842 0,4283 0,4518 0,4202 0,3268
Robust standard errors in parentheses *** p<0,01, ** p<0,05, * p<0,1
31 Table 6.-GLM-Tier1 without the effect of DTA’s significance analysis
(1) (2) (3) (4) (5) (6) (7) (8) (9) (10) (11) VARIABLES TIER 1 without DTA TIER 1 without DTA TIER 1 without DTA TIER 1 without DTA TIER 1 without DTA TIER 1 without DTA TIER 1 without DTA TIER 1 without DTA TIER 1 without DTA TIER 1 without DTA TIER 1 without DTA DTA year -0,0000 0,0000** -0,0000 0,0000 0,0000* (0,0000) (0,0000) (0,0000) (0,0000) (0,0000) fincrisis 0,0160*** 0,0153*** 0,0285*** 0,0294*** 0,0161*** 0,0151*** (0,0044) (0,0046) (0,0072) (0,0069) (0,0043) (0,0044) troika 0,0240*** 0,0221*** 0,0227*** 0,0200*** (0,0049) (0,0048) (0,0053) (0,0049) changelaw2014 0,0011 -0,0004 0,0005 -0,0039 (0,0083) (0,0089) (0,0085) (0,0092) DTA accum 0,0000 0,0000*** 0,0000*** 0,0000* 0,0000** 0,0000*** (0,0000) (0,0000) (0,0000) (0,0000) (0,0000) (0,0000) lnassets -0,0174*** -0,0219*** -0,0028 -0,0061** (0,0057) (0,0051) (0,0029) (0,0025) credit default % 0,0357 -0,0981 -0,1595 0,1184 0,0860 -0,2582 0,0068 (0,2155) (0,2024) (0,2103) (0,1910) (0,1894) (0,2559) (0,2975) cost ot income -0,0189 -0,0342 -0,0438* -0,0198 -0,0268 (0,0267) (0,0234) (0,0241) (0,0269) (0,0256) logECBlending 0,0052** 0,0042** 0,0039** 0,0005 -0,0006 0,0038* 0,0052** (0,0022) (0,0018) (0,0020) (0,0021) (0,0018) (0,0019) (0,0023) logsales -0,0210*** (0,0043) ROA (computed value) -0,0812 0,4696 (0,7099) (0,7420) logbankslending -0,0159*** -0,0132*** (0,0032) (0,0045) Constant 0,0764*** 0,0757*** 0,2445*** 0,3103*** 0,3914*** 0,0805*** 0,0898*** 0,1045*** 0,1373*** 0,1967*** 0,1569*** (0,0034) (0,0033) (0,0585) (0,0553) (0,0670) (0,0207) (0,0186) (0,0304) (0,0269) (0,0374) (0,0467) Observations 94 94 71 71 71 71 71 94 94 71 71
Robust standard errors in parentheses *** p<0,01, ** p<0,05, * p<0,1
Finally we will analyse the Tier 1 without DTA variable. Our independent
variables seem to be much more accurate in predicting this dependent variable than the
previous ones, given the considerably higher R2. The regressions that present the higher
level of prediction are pretty much the same that applied to the difference in Tier 1. The inclusion of the dummy variables that represent major changes in the sector seems to be very relevant when predicting these dependent variables.
32
6. Conclusion
The average amount of DTA’s in Portuguese banking has more than tripled in the past ten years. The impact of the accumulation of these types of assets is real and its effects are visible and measurable. The effect of the new CRD IV / CRR directive that allowed the inclusion of deferred taxes in the Basel ratios has already seen some results. Even though the directive is relatively new and it isn’t possible for us to get more observations at this time, our main conclusion is that deferred tax assets definitely have an impact in Portuguese banking results. In the case of possible future profits, these Dta’s that have accumulated over the years will be deductible as a tax credit, therefore improving the result after taxes. The inclusion of DTA’s also helps financial institutions to comply with the very demanding Basel III requirements which are ever increasingly harder to achieve given the recession in the Portuguese financial sector. The impact of
this aid is already very noticeable in the year of 2015. The main negative impact of DTA’s should be felt by the state in next few years,
since as the banks recover and the deferred tax assets start to reverse the tax revenue will be decreased by the subsequent conceded tax credits. Because of this we anticipate that the deferred tax assets will be a highly debated subject over the next few years in Portugal, to a similar length as they are already discussed by foreign authors.
The issue with these types of assets in the current national banking reality is that an asset that is classified as a temporary item and that should be reversed quickly in the following years is having a much greater and more prolonged presence in balance sheets than what was expected. This artificial rise in the assets and equity accounts can become problematic as banks keep deferring these temporary items indefinitely, creating an
33
inflated balance sheet position that, in any way, represents the true measure of their accounts.
Since we have also studied the evolution of Portuguese banking on a more general scope (which was indeed necessary to determine what the effect of DTAs was and what was not) we have also reached some conclusions about the evolution of the sector itself. We have found that our dummy variables were highly relevant in translating the behaviour of banking results in the last years. The 2008 financial crisis was definitely a landmark but the arrival of Troika in 2011 was way more relevant for the Portuguese case than any other registered events. In fact, the start of heavy drops in results seems to be very consistently aligned with this event. Because of this we can conclude that this historical events are one of the main factors that dictated the subsequent unfavourable results in the past.
34
7. References
Data Base:
All the information concerning the banks accounts was retrieved from the correspondent financial statements available to the public on the institution’s website or through the Banco de Portugal online repository when needed.
Books:
Greene, W. H. (2003). Econometric analysis. Upper Saddle River, NJ: Prentice Hall.
Papers:
Amir, E., Kirschenheiter, M., & Willard, K. (1997). The Valuation of Deferred
Taxes. Contemporary Accounting Research, 14(4), 597-622.
Atwood, T., Drake, M. S., & Myers, L. A. (2010). Book-tax conformity, earnings
persistence and the association between earnings and future cash flows. Journal of
Accounting and Economics, 50(1), 111-125.
Burgstahler, D. C., Elliott, W. B., & Hanlon, M. (n.d.). How Firms Avoid Losses:
Evidence of Use of the Net Deferred Tax Asset Account.
Colley, R., Rue, J., Valencia, A. & Volkan, A. (2007), “Deferred Taxes in the Context of the Unit Problem”, Journal of Finance and Accountancy
Colley, R., Rue, J., Valencia, A., & Volkan, A. (2012). Accounting For Deferred Taxes:
Time For A Change. Journal of Business & Economics Research (JBER) JBER, 10(3),
149.
Comprix, J., Graham, R. C., & Moore, J. A. (2011). Empirical Evidence on the Impact
of Book-Tax Differences on Divergence of Opinion among Investors. The Journal of
35
Graham, J. R., Raedy, J. S., & Shackelford, D. A. (n.d.). Research in Accounting for Income Taxes.SSRN Electronic Journal. doi:10.2139/ssrn.1312005
Guerreiro, M. S., Rodrigues, L. L., & Craig, R. (2012). Voluntary adoption of
International Financial Reporting Standards by large unlisted companies in Portugal –
Institutional logics and strategic responses. Accounting, Organizations and
Society, 37(7), 482-499.
Hanlon, M., & Shevlin, T. (2005). Bank-Tax Conformity for Corporate Income: An
Introduction to the Issues
Hanlon, M., Maydew, E. L., & Shevlin, T. (2008). An unintended consequence of
book-tax conformity: A loss of earnings informativeness. Journal of Accounting and
Economics, 46(2-3), 294-311.
Laux, R. C. (2013). The Association between Deferred Tax Assets and Liabilities and Future Tax Payments. SSRN Electronic Journal.
Sansing, R. C., & Guenther, D. A. (n.d.). The Valuation Relevance of Reversing
Deferred Tax Liabilities.
Internet Sources:
Capital requirements regulation and directive – CRR/CRD IV. (n.d.). Retrieved April 05, 2016, from
http://ec.europa.eu/finance/bank/regcapital/legislation-in-force/index_en.htm
Comunicado relativo a aviso do Banco de Portugal sobre reforço do rácio "Core Tier 1" das instituições de crédito. (n.d.). Retrieved March 13, 2016, from
https://www.bportugal.pt/ptPT/OBancoeoEurosistema/ComunicadoseNotasdeInformaca o/Paginas/combp20110407.aspx
36
Ketz, E. (n.d.). Deferred Income Taxes Should be Put to Rest. Retrieved October 03, 2016, from http://accounting.smartpros.com/x68912.xml
Regulamento. (n.d.). Retrieved June 13, 2016, from http://www.cnc.min-financas.pt/regulamento.html
Tysiac, B. K. (2015). FASB simplifies presentation of deferred income taxes. Retrieved August 10, 2016, from http://www.journalofaccountancy.com/news/2015/nov/deferred-taxes-balance-sheet-201513434.html
37
8. Abbreviation Glossary
Banif- Banco Internacional do FunchalBapop- Banco Popular Portugal BCP- Banco Comercial Português BES- Banco Espírito Santo
BPI- Banco Português de Investimento CA- Caixa Agrícola
CGD- Caixa Geral de Depósitos DTA- Deferred Tax Asset DTL- Deferred Tax Liability
FASB- Financial Accounting Standards Board GLM- Generalised Linear Model
IRS- Internal Revenue Service (North American Tax Authority) OLS- Ordinary Least Squares
POC- Plano Oficial de Contabilidade RWA- Risk Weighted Assets
SNC- Sistema de Normalização Contabilistica
38
9. Appendix
Appendix 1-Variable Description Table
Dependent Variable Name Definition Type Unit
Tier 1 with DTA Tier1 Ratio between the firm’s core equity capital and its total risk-weighted assets including Dta’s (applicable from 2014 onwards).
% -
Tier 1 without DTA Tier1withouthdta Ratio between the firm’s core equity capital and its total risk-weighted assets excluding Dta’s (applicable from 2005 to 2013 onwards).
% -
D/E debttoequity Ratio used to measure financial leverage. It is computed by dividing a company’s total liabilities by stockholder’s equity.
% -
Computed ROE ROEc Manually computed Return on Equity. Measures the percentage of net income returned as shareholders equity.
% -
Reported ROE ROEr Reported Return on Equity. Measures the percentage of net income returned as shareholders equity.
39
Independent Variable Name Definition Type Unit
Annual DTA DTAan Yearly total Deferred Tax
Assets account.
Numeric Euros
Accumulated DTA DTAac Accumulated Deferred Tax Asset account.
Numeric Euros
Financial Crisis fincrisis Dummy variable for the 2008 financial crisis
Dummy -
Troika troika Dummy variable for the 2011
troika intervention
Dummy -
Change in law Changelaw2014 Dummy variable for the law 61/2014 that allowed the deduction of Dta’s as a tax benefit and their inclusion in the solvency ratios
Dummy -
Control Variables Name Definition Type Unit
Assets lnassets Ln of the total assets for each year.
Numeric Euros
Computed ROA ROAc Manually computed Return on Assets. It’s an indicator on the profitability of the institution relative to its total assets.
% -
Reported ROA ROAr Reported Return on Assets It’s an indicator on the profitability of the institution relative to its total assets.
% -
40 Margin.
Sales logsales Logarithm of yearly sales Numeric Euros Amount Credit logcredit Logarithm of the Conceded
Credit account
Numeric Euros
Cost to Income costtoincome It’s an indicator of the firm’s efficiency. It weights the operating costs with the operating income.
% -
Net Income lognetincome Logarithm of yearly Net Income
Numeric Euros
ECB lending logecblending Its amount of credit from the central bank.
Numeric Euros
Banks lending logbankslending Its amount of credit from other financial institutions
Numeric Euros
Default Credit creditoincumo It’s the amount of defaulted credit divided by the conceded credit.
% -
Appendix 2-Variables descriptives
Variable Obs Mean Std. Dev. Min Max
TIER1withDTA 96 0,018107 0,043733 0 0,165 TIER1witho~A 79 0,094701 0,023659 0,055 0,162 Debttoequity 98 15,78963 6,058777 -1,07338 51,23315 ROEValorca~o 98 0,05244 0,398756 -1,53222 3,43277 ROEvalorre~o 90 0,064164 0,108882 -0,354 0,256
41 Variable Obs Mean Std. Dev. Min Max
difTIER1 93 0,002237 0,045146 -0,135 0,165 difDebtEqu~y 96 -0,32042 6,435675 -30,6066 26,72631 difROE 86 -0,00638 0,088401 -0,281 0,266
Variable Obs Mean Std. Dev. Min Max
DTAan 97 425,0223 537,1272 0 2561,506 DTAac 99 1919,665 2816,443 0 14199,44 fincrisis 99 0,727273 0,447628 0 1 troika 99 0,454546 0,500464 0 1 changelaw2014 99 0,181818 0,387657 0 1
Variable Obs Mean Std. Dev. Min Max
lnassets 97 10,2699 1,055582 5,281197 11,74294 ROAc 98 -0,47549 4,725591 -46,779 0,012149 logfinmarg~s 96 13,05555 0,854349 11,34483 14,54844 logsales 97 14,01597 1,16439 7,521318 15,80688 logcredit 97 16,78737 1,047743 11,55497 18,2211 NPL 96 0,040768 0,029109 0,005 0,157 costincome 96 0,587194 0,110317 0,362 0,9005 lognetincome 75 11,48732 1,626989 6,369901 13,66039 logECBlend~g 71 7,295498 1,422571 1,111529 9,295905 logbanksle~g 97 7,638101 1,821387 -3,64966 9,907308
42 Appendix 3- Correlation table with cut-off
DTA an DTA ac fincr i~s troik a cha~2 014 lnass ets ROA c logfi n~s logsa les logcr e~t NPL costi n~e logne t~e logEC B~g logbanks le~g DTAan 1 DTAac 0,74 68 1 fincrisis -0,09 78 0,22 9 1 troika 0,05 44 0,34 99 0,41 49 1 changel~ 2014 -0,05 14 0,34 14 0,19 91 0,47 99 1 lnassets 0,72 65 0,48 82 -0,40 31 -0,32 79 -0,182 7 1 ROAc 0,12 3 0,02 79 -0,57 66 -0,40 71 -0,035 3 0,45 65 1 logfinmar g~s 0,69 24 0,38 86 -0,45 39 -0,40 56 -0,210 3 0,96 19 0,53 08 1 logsales 0,64 26 0,31 97 -0,44 61 -0,45 05 -0,329 1 0,95 33 0,50 37 0,949 1 logcredit 0,71 45 0,46 56 -0,40 83 -0,39 25 -0,232 8 0,98 93 0,46 42 0,950 3 0,96 46 1 NPL -0,21 08 0,02 75 0,51 51 0,69 05 0,474 1 -0,56 01 -0,57 86 -0,530 5 -0,65 54 -0,622 4 1 costincom e -0,20 43 -0,16 91 0,16 11 0,17 32 0,030 6 -0,35 12 -0,60 91 -0,358 3 -0,39 88 -0,365 2 0,38 18 1 lognetinc ome 0,47 15 0,31 27 -0,49 21 -0,41 91 -0,105 5 0,80 76 0,77 45 0,831 8 0,79 76 0,798 5 -0,64 19 -0,497 2 1 logECBle nd~g 0,17 75 0,43 01 0,49 19 0,31 56 0,057 6 0,17 37 -0,25 87 0,047 7 0,09 3 0,157 3 0,11 15 -0,128 1 -0,041 4 1 logbanksl e~g 0,52 26 0,27 76 -0,45 73 -0,46 46 -0,239 9 0,76 89 0,44 82 0,680 3 0,75 3 0,795 -0,82 35 -0,362 5 0,655 1 0,0457 1