The Role of Deferred Tax in the Regulatory Capital of Brazilian
Financial Institutions*
Michele Aparecida Dela Ricci Junqueira
Ph.D., of Business Administration Department School of Economics, Business Administration and Accounting at Ribeirão Preto, University of São Paulo E-mail: [email protected]
Sílvio Hiroshi Nakao
Ph.D. Associate Professor, Accounting Department School of Economics, Business Administration and Accounting at Ribeirão Preto, University of São Paulo E-mail: [email protected]
Received on 7.31.2012- Desk acceptance on 8.14.2012- 3rd. version approved on 7.25.2013
ABSTRACT
This study sought to provide evidence on the role of deferred tax assets and liabilities as an instrument for the attainment and arbitrage of regulatory capital levels by Brazilian financial institutions in the period from 2004 to 2009. Two hypotheses were developed: the managers of Brazilian financial institutions employ deferred taxes to a) comply with required regulatory capital limits and b) do so in a discretiona-ry manner as a method for regulatodiscretiona-ry capital arbitrage. The present study collected evidence through the analysis of annual accounting information from Brazilian financial institutions. The hypotheses were tested using multiple linear regression and panel data regression data analysis techniques. The results show that Brazilian financial institutions have used deferred taxes to support or attain the minimum capital levels required by the Basel Accord; however, evidence that the volume of regulatory capital directly influences the volume of de-ferred taxes was also found, contradicting the international literature, which indicates discretion in the use of dede-ferred taxes as a form of regulatory capital arbitrage.
Keywords: Deferred tax. Basel Accord. Financial Institution.
1 INTRODUCTION
The Basel Accord, first drafted in 1988 in the Interna-tional Convergence of Capital Measurement and Capital Standards (BIS, 1988) document, is one of many regula-tions that financial instituregula-tions are subject to. The Accord was first established by the G-10 countries (a group of ele-ven countries in which 85% of the world's economy is con-centrated, namely Germany, Belgium, Canada, the United States, France, Italy, Japan, Holland, the United Kingdom, Sweden and Switzerland); however, it is not solely restric-ted to these countries. Its objective was to define uniform rules for all banks to provide the financial system with more reliability.
The basic instrument employed in this Accord was the so-called regulatory capital or Basel Index (BI), which in-dicates the minimum amount of capital that the financial institution must hold. According to the directives of the Bank for International Settlements (BIS), this minimum amount of capital is calculated as an institution’s adjusted total equity, in accordance with the risk level of its asset structure. This index was set to 8% by the Accord, but the central bank of each country can establish a different requi-red value through specific regulations.
In Brazil, the Accord was implemented by the National Monetary Council (Conselho Monetário Nacional - CMN) through Resolution no. 2,099, on August 17th, 1994. The CMN then altered the required minimum amount of capi-tal to 10% through Resolution no. 2,399, on June 25th, 1997, and once more to 11% through Resolution no. 2,606, on May 27th, 1999, which is still the minimum required level. Therefore, the requirement in Brazil is that a financial ins-titution must have a minimum amount capital correspon-ding to 11% (instead of 8%) of what it lends. For example, for a loan of BRL 1,000.00, the financial institution must hold a minimum of BRL 110.00.
Despite the regulations that they are subject to, finan-cial institutions may make choices and select among alter-natives when presenting their financial reports, a practice known in the literature as earnings management. The most well-known definition is that of Healy and Wahlen (1999, p. 368): Earnings management "occurs when managers use judgment in financial reporting and in structuring tran-sactions to alter financial reports to either mislead some stakeholders about underlying economic performance of the company or to influence contractual outcomes that depend on reported accounting numbers." Although this view may associate earnings management with fraudulent or reckless practices, it must be adopted with caution, es-pecially when considering operating earnings management as part of the activities or economic context of the financial institution; - this is even more applicable during periods of crisis. This discussion, however, will not be included in the scope of this study.
Deferred taxes can therefore represent an opportunity for the earnings or regulatory capital of financial institu-tions to be managed. Regulatory capital arbitrage implies that managers of financial institutions can adjust their
ca-pital levels for regulatory purposes.
In Brazil, the CMN allowed deferred taxes to be inclu-ded as part of the regulatory capital of financial institutions, whereas in other countries, deferred taxes are not recogni-zed at all or have strict limitations imposed on them. When the moment for accounting recognition of the deferred tax arrives, the financial institution may try to improve its risk assessment and, thereby, the assessment of its risk-weighted assets and the net equity required to conform to the Basel Accord's requirements.
This may take place because a deferred tax asset con-sists basically of Corporate Income Taxes (Imposto de Renda das Pessoas Jurídicas - IRPJ) and Social Contribu-tions on Profit (Contribuição Social sobre o Lucro - CSSL) over deductible temporary differences and fiscal losses. In analyzing this matter in greater detail, it can be seen that for a financial institution, allowances for doubtful accounts are the main sources of deferred taxes and should therefore be linked directly to the operational management of this type of economic activity. Distinguishing what constitu-tes intentional earnings management and what represents management aimed at operations control is a difficult task. Therefore, because the allowance for doubtful accounts can represent a significant figure, depending on the size of the institution (and especially during a period of crisis), the analysis of the evolution of deferred taxes among Brazilian financial institutions can be interesting because it could create uncertainty about effective asset recovery.
Two studies in the international literature are directly aligned with the focus on regulatory capital management in financial institutions: Gee and Mano (2006) addressed issues related to the importance of deferred taxes for the maintenance of regulatory capital in Japan in the period from 2002 to 2004 through a case study of the five largest Japanese bank groups; and Skinner (2008) supplied empiri-cal evidence on the use of deferred taxes by Japanese banks as part of a strategy for regulatory capital attainment and the practice of regulatory capital arbitrage.
In this context, the present study seeks to answer the following question: Are deferred tax assets and lia-bilities used by Brazilian financial institutions as ins-truments for the attainment and arbitrage of regulatory capital levels?
implementation of the international standard for regula-tory capital adequacy.
This article contains five sections, including this intro-duction. Section 2 develops the hypotheses by reviewing the international and Brazilian literature referring to the role of deferred taxes as an instrument of earnings
mana-gement and regulatory capital adequacy; section 3 presents the study’s methodology, including descriptions of the sample collection, variables and data analysis techniques; and section 4 presents the conducted tests and results of this study. Finally, section 5 presents conclusions and sug-gestions for future research.
2 HYPOTHESES DEVELOPMENT
In this section, the hypotheses are developed by re-viewing both the international and Brazilian literature and illustrating aspects of the Basel Accords, regula-tory capital and the role of deferred taxes as an instru-ment for earnings manageinstru-ment and regulatory capital adequacy. The section closes by presenting the present study’s hypotheses.
2.1 The Basel Accord and Regulatory Capital.
The Basel Accord (known as Basel I) was implemen-ted by the CMN through Resolution no. 2,099, on August 17th, 1994. In Annex IV, article 1, this Resolution rules that financial institutions or institutions otherwise authorized to operate by the Brazilian Central Bank (Banco Central – Bacen), except credit cooperatives, must retain a level of adjusted total equity that is compatible with the risk levels of their asset structures. The required minimum equity va-lue is calculated according to the following formula:
Where:
RME: Required Minimum Equity as a function of the risk of credit operations;
Rwa: Risk-weighted assets, equivalent to 0.08 (eight hun-dredths), composed by weighting the following risks: a) Weighing factor 0% (Null Risk); b) Weighting Factor 20% (Reduced Risk 1); c) Weighting factor 50% (Reduced Risk 2); d) Weighing Factor 100% (Normal Risk).
This is because financial institutions carry out diffe-rent activities with diverging characteristics and associated risks, which reflect on different weighting factors.
According to Resolution no. 2,099, the following tax credits should be classified with a weighting factor of 20% (Reduced Risk 1):
Tax credits resulting from expenditures that were
◆
accounted for in the inancial period and that are deductible in subsequent inancial years – lapse in four years; and
1.8.8.25.00-2 – Tax Credits – Income Taxes and Social
◆
Contributions.
Resolution no. 2,099 also notes, in article 2, that com-pliance with standards for net capital and equity is an essential condition for the operation of financial institu-tions and instituinstitu-tions otherwise authorized to operate by Bacen. Should it observe that this condition has not been met, Bacen will call on the institution’s legal
representati-ves to inform them on the measures to be adopted to re-gularize the situation (paragraph 1). This Resolution, set December 31st, 1994, as the deadline for existing financial institutions to adapt their respective net equity values to the conditions set by it.
Resolutions no. 2,399, of June 25th, 1997, and no. 2,606, of May 27th, 1999, altered the minimum required capital level to 10% and 11%, respectively. According to the National Bank for Economic and Social Develo-pment (Banco Nacional de Desenvolvimento Econômi-co e Social – BNDES)1 (2007 apud Sobreira & Martins, 2011, p. 352), the raising of this percentage to above 8% follows the Basel Committee’s recommendation that developing countries, “where less developed banking systems operate, which are subject to shocks of higher intensity, should adopt higher coefficients – and risk-weighting factors for different asset classes.” Resolu-tion no. 2,606 further included other asset classes that could indicate the financial institution’s exposure, such as swap and gold operations.
Until this point, the CMN had not provided an ob-jective definition of net equity to be adopted to meet the Basel Accord’s requirements. Resolution no. 2,543, of August 26th, 1998, introduced a new concept of a mi-nimum amount of capital that is compatible with the risk level of credit operations. According to this Reso-lution, the Adjusted Total Equity (ATE) is now defined as the sum of Tiers I and II. The text underwent mo-difications, found in Resolution no. 2,802 of
Decem-ber 21st, 2000, which defined ATE as Reference Equity
(RE) and culminated in Resolution no. 2,837 of May 30th, 2001, according to which Tiers I and II consist of the following:
a) Tier I consists of net equity plus the accounts payable balance minus the accounts receivable balance, exclu-ding revaluation, contingency reserves and special in-come reserves related to undistributed mandatory di-vidends, and minus values referring to cumulative and redeemable preferred shares;
b) Tier II consists of reevaluation, contingency reserves and special income reserves related to undistributed mandatory dividends, cumulative and redeemable pre-ferred shares, subordinated debts and hybrid instru-ments for capital and debt.
Resolution no. 3,444 of February 28th, 2007, defined RE, whereas Resolution no. 3,490 of August 29th, 2007, defined Required Reference Equity (RRE). From these,
RME = 0.08 (Rwa) 1
BI = (RE x 100) / (RRE / 0.11) 2
as will be detailed in section 3.2, the Basel Index (BI) was defined as:
Where:
RE: Reference Equity, composed by adding Tiers I and II and deductions (Tier I + Tier II – RE Deductions),
RRE: Required Reference Equity.
Next, Brazil formally adhered to the procedures sugges-ted in the new Basel Accord (known as Basel II) by means of Communiqué no. 12,746 of December 9th, 2004, althou-gh the practical application of the new accord was enacted in Communiqué no. 16.137/2007. Because the implemen-tation timeline extends from 2008 to 2012, its effects could not yet be properly verified. Because of this, the implica-tions of the implementation process after this point will not be analyzed in the present study.
It can thus be ascertained that the Basel Accord has evol-ved to track changes in the context of financial institutions; adjustments were introduced according to assessments by regulatory bodies with the aim of preventing systemic cri-ses brought about by the instability of individual financial system participants and to prevent financial institutions from being exposed to certain risks.
2.1.1 Tax Credits and Regulatory Capital Manage-ment
According to articles 2 and 4 of Resolution no. 3,059 of December 20th, 2002, which rules on accounting recor-ds for the tax credits of financial institutions and institu-tions otherwise authorized to operate by Bacen, until this Resolution came into power, tax credits recorded with an expected realization exceeding 5 years should be excluded from Tier I when calculating RE, in accordance with article 1 of Resolution no. 2,837. For the exclusion of tax credits realizable in periods longer than 5 years, the following ti-meline should be followed: a) after January 1st, 2004, exclu-sion of 20%; b) after January 1st, 2005, exclusion of 40%; c) after January 1st, 2006, exclusion of 60%; d) after January 1st, 2007, exclusion of 80%, e) after January 1st, 2008, exclusion of 100%.
Moreover, it was determined that the total tax credits (except those provided in articles 2 and 4 of Resolution no. 3,059) should correspond to no more than 40% of the RE's Tier I, after the previously mentioned exclusions. Re-solution no. 3,355, from March 31st, 2006, in turn, altered paragraphs 1 and 5 of Resolution no. 3,059, although the standard’s essence was maintained.
Resolution no. 3,444 of February 28th, 2007, ruled that tax credits defined in the terms of articles 2 and 4 of Resolution no. 3,059 should be excluded from the RE's Tier I, but Resolution no. 3,655 from December 17th 2008 determined that the total tax credits (except those subjected to adjustment) should correspond, at most, to the following percentages of the RE's Tier I, according to the following timeline: a) after January 1st, 2009, 30% of the RE's Tier I; b) after January 1st, 2010, 20% of the RE's Tier I; c) after January 1st, 2011, 10% of the RE's Tier I.
Therefore, starting with Resolution no. 3,059, objecti-ve standards for the recognition and maintenance of tax credits as components of required minimum capital were established. The concern of regulatory bodies is centered on the expectation of generating future taxable income that guarantees the realization of these assets.
2.2 Regulatory Capital Management.
As previously mentioned, financial institutions may make choices or select between alternatives when presen-ting their financial reports, a practice known in the literatu-re as earnings management. In addition to the well-known definition of Healy and Wahlen (1999), other important references to this concept include Hepworth (1953), Gor-don (1964), Ronen and Sadan (1975), Beneish (2001) and Fields, Lys and Vincent (2001).
The following studies stand out among those that have examined the relationship between allowances for doub-tful accounts and earnings management in financial ins-titutions: Scheiner (1981), Bhat (1996), Robb (1998) and Rivard, Bland and Morris (2003).
Of the studies that have examined the relationship between allowances for doubtful accounts and earnin-gs management while also including regulatory capital management in financial institutions, the following are notable: Moyer (1990), Beatty, Chamberlain, and Ma-gliolo (1995), Collins, Shackelford and Wahlen (1995), Kim and Kross (1998), Ahmed, Takeda and Shawn (1999), Shrieves and Dahl (2003), Anandarajan, Hasan and McCarthy (2005), Agarwal, Chomsisengphet, Liu and Rhee (2007) and Perez, Salas-Fumá and Saurina (2008).
Nevertheless, these studies found contradictory results in the context of financial institutions. The following stu-dies have concluded that banks were actively involved in regulatory capital management: Moyer (1990), Beatty et al. (1995), Collins et al. (1995), Kim and Kross (1998), Ahmed et al. (1999), Shrieves and Dahl (2003) and Agarwal et al. (2007). In contrast, the studies of Anandarajan et al. (2005) and Perez et al. (2008) concluded no regulatory capital ma-nagement took place.
Among the Brazilian studies that have examined the relationship between allowances for doubtful accounts and earnings management in financial institutions, those by Wasserman (2004) and Santos (2007) are of particular interest.
Wasserman (2004) proposed a model for the alloca-tion of taxes among periods that could lead to a defer-red tax asset founded on economic precepts while also meeting the regulatory capital requirements, based on information on all parties in the National Financial Sys-tem (SisSys-tema Financeiro Nacional - SFN) in the period from 1990 to 2003.
conglomerates in the period from 2000 to 2005 and using the model proposed by Shrieves and Dahl (2003), the stu-dy found evidence that financial conglomerates did make use of the previously mentioned provisions (a) and (b) to smooth reported earnings, and only financial conglomera-tes with greater capital used provisions (b) to control regu-latory capital as well.
However because the focus of the present study is on analyzing whether financial institutions used discretion over deferred taxes to manage regulatory capital, two stu-dies in the international literature aligned with this propo-sition must be reviewed.
Gee and Mano (2006) addressed issues related to the importance of deferred taxes for the maintenance of regulatory capital in Japan. Through case studies of the five largest bank groups in Japan between 2002 and 2004, the authors concluded that these five groups would not have managed to operate internationally wi-thout deferred tax assets.
Skinner (2008) provides empirical evidence on the usage of deferred taxes by Japanese banks. This study was developed using a sample of 86 Japanese banks, ob-tained from Compustat, over the period from 1998 to 2003. The study can be divided into two hypotheses: the first is related to the usage of deferred taxes to sup-port or attain the required amount of minimum capital determined by the Basel Accord. The study’s conclu-sions show that, without including deferred taxes into Tier I of BI and without the government’s capital in-jections in the beginning of 1999, 12 of the 15 banks would not have met the minimum regulatory capital requirements (of these 15, 14 were classified as major Japanese banks).
Deferred taxes provide significant power to mana-gers because their realization depends on the manager’s assessment of the company’s capacity to generate suffi-cient levels of future taxable income (Miller and Skinner, 1998; Schrand and Wong, 2003; Dhaliwal, Gleason and Mills, 2004). Therefore, analyzing the evolution of de-ferred taxes in Brazilian financial institutions can be in-teresting because there is uncertainty about the effective
recoverability of assets. More specifically, it can be ob-served that the regulatory agent’s (CMN) concern is not restricted to absolute asset values, but is mostly related to the issue of subjectivity, which is inherent to decisions on whether to register the deferred tax, and the expecta-tion of credit realizaexpecta-tion, taking into account estimates of future taxable income.
Based on this referenced literature, the present study in-tends to test the following hypothesis (called the regulatory capital level hypothesis):
H1a: Managers of Brazilian financial institutions use deferred taxes to meet required regulatory capital levels.
Skinner (2008) has also provided empirical eviden-ce on use of deferred taxes to practieviden-ce regulatory capi-tal arbitrage. According to the author, regulatory capicapi-tal arbitrage occurs when managers “exploit the discretion available under banking regulations to report regula-tory capital levels that satisfy the necessary thresholds” (Skinner, 2008, p. 226).
His tests were designed to assess whether decisions related to deferred taxes were guided by incentives to increase regulatory capital levels in light of the scarcity of other sources of capital. This leads to the supposition that the net deferred taxes would be inversely related to the regulatory capital levels, i.e., that financial insti-tutions with weaker financial positions would register higher Net Deferred Taxes (NDT), when other factors remain unchanged.
Based on this second referenced research, the present study seeks to test the following hypothesis (called the re-gulatory capital arbitrage hypothesis):
H2a: Managers of Brazilian financial institutions use deferred taxes as an instrument for regulatory capital ar-bitrage.
This section has provided arguments and evidence that support the notion that deferred taxes might be used to re-ach the required regulatory capital levels and that mana-gers of financial institutions might practice regulatory ca-pital arbitrage. The following section describes the study’s methodology so that tests can be conducted to verify the study’s hypotheses.
3 STUDY METHODOLOGY
The study can be regarded as being empirical in nature and following a quantitative approach.
3.1 Sample Collection.
Samples were collected by accessing Bacen’s website (http://www.bcb.gov.br). Data were gathered according to the following procedure: a) Accessing the website’s home page; b) choosing option “Sistema Financeiro Nacional” [National Financial System]; c) choosing option “Informa-ções cadastrais e contábeis” [Registration and accounting information]; d) choosing option “Informações contábeis” [Accounting information]; e) choosing option “Informa-ções Financeiras Trimestrais (IFT)” [Quarterly Financial Information]. On this last page, it is possible to search by
< NOME [NAME]>, < TRIMESTRE [QUARTER]> and < ANO [YEAR]>. Next, explanatory notes on each financial institution were accessed. If the required information was not available through this path, the websites of the financial institutions were consulted, based on the Financial-Econo-mic Conglomerate (EC). If this information was unavaila-ble, the search was extended based on the Financial Con-glomerate (FC). If this information was unavailable, the search was extended based on the Financial Institution (FI) because it is understood that the institution in question is not part of any conglomerate.
re-sult, the final sample was composed of 45 institutions. The period of analysis was 6 years (from 2004 to 2009), which corresponds to the available period (for which it was possi-ble to obtain data using the procedure described above). A total of 1,080 data samples were obtained, i.e., 4 quarterly observations for each of the 45 financial institutions over a 6-year period. If a financial institution had been incorpo-rated or closed, whether information on the consolidation was available for the entire period of study was considered. Analysis of the Total Assets of these Brazilian financial ins-titutions shows that this is a concentrated sector because merely 10 institutions account for 90.37% of the market.
3.2 Description of the Study Variables.
The study used the following variables:
1) Net Equity (NE): net equity of the financial institu-tion;
2) Total Assets (TA): total assets of the financial institu-tion;
3) Deferred Tax Assets (DTA): deferred tax assets of the financial institution, referring to IRPJ and CSSL. There-fore, it does not include credits referring to other types of taxes;
4) Deferred Tax Liabilities (DTL): deferred tax liabilities of the financial institution;
5) Tax Credit Carry-forwards (TCC): tax credits that were not accounted for because they fail to meet the accoun-ting requirements set by the accounaccoun-ting standard; 6) Tax Loss (TL): the proportion of deferred tax assets
that can be attributed to tax losses and the negative tax base;
7) Loan Loss Provision (LLP): the proportion of deferred tax assets that can be attributed to the allowance for doubtful accounts;
8) Tier I: the Tier I as published by the financial institu-tion as component of its BI. In the present study, this variable was used as a proxy for regulatory capital; 9) Tier II: the Tier II as published by the financial
institu-tion as component of its BI;
10) RE deductions: reference equity deductions stipulated in the standard that should be considered when calcu-lating the BI;
11) Tier I and Tier II (RE): reference equity, the sum of Tiers I and II above;
12) RRE: Available only up to the third quarter of 2008 for most financial institutions, due to Circular no. 3,398 of July 23rd, 2008, which established procedures for the delivery of information related to the calculation of mi-nimum regulatory standards and limits;
13) Basel Index (BI): given by BI = (RE x 100) / (RRE / 0.11). This formula was applied to all financial institu-tions in the period from 2004 to 2009. The obtained va-lue can differ from that published by the financial insti-tution; therefore, this formula’s outcome was used for all financial institutions.
14) Return on Assets (ROA): the current quarter’s ROA, calculated as Earnings Before Income Taxes (EBIT)/To-tal Assets (TA) at the end of the period;
15) ROA (M): the mean ROA of the last 3 quarters, i.e., the mean value of ROA for the 3 quarters prior to a gi-ven quarter;
16) TL (3): the number of losses in the last 3 quarters. For this purpose, a value of 0 was assumed in the case of profits and a value of 1 in the case of losses;
17) Future ROA: the mean ROA for the coming quarters, i.e., the mean value of ROA for the 3 quarters following a given quarter;
18) Size: the logarithm of TA, used to linearize the beha-vior of the variable Size;
19) Dummy: a binary variable used to represent the crisis of 2008. It takes a value of 1 for the year 2008, and 0 otherwise.
The variables collected directly from Bacen's website are not available in a public access database or through a li-cense (as in the case, for example, of Economática), or even by means of a formal solicitation to Bacen. Therefore, these variables were collected manually, one at a time, through the website, following the procedure described above.
3.3 Data Analysis Techniques.
Next, for each of this study's hypotheses, the data analy-sis techniques that were found to be most appropriate for testing the study's objectives are detailed.
3.3.1 Hypothesis: Regulatory Capital Level.
In the hypothesis that deferred taxes are used by ma-nagers as a discretionary instrument to meet the required regulatory capital level, the inclusion of deferred taxes into regulatory capital would be inappropriate because the assets resulting from the recording of deferred tax assets might have questionable economic value2. Section 4.1 will therefore present results related to the impact of recogni-zing deferred tax assets as components of Tier I, i.e., Tier I has been calculated before DTA inclusion.
3.3.2 Hypothesis: Regulatory Capital Arbitrage. Aiming to examine whether the decisions of managers concerning deferred taxes are related to the regulatory ca-pital of their institutions, two techniques for data analysis were employed: multiple linear regression and panel data regression. The main reference for this section is Fávero, Belfiore, Silva and Chan (2009), along with the instructio-nal manual for SPSS® software.
These two statistical dependence techniques are consi-dered to be the most appropriate for the objective of this section, i.e., the identification of the variables that may in-fluence deferred taxes in Brazilian financial institutions.
With regard to multiple linear regression, the ob-jective was to ascertain which independent variables influence the dependent variables, i.e., which variables
influence the deferred taxes of Brazilian financial ins-titutions.
Multiple linear regression was applied using the SPSS® software application using a stepwise selection method. The dependent variables are DTA and TCC, and the inde-pendent variables are LLP, TL, Tier I, ROA (M), Size and Future ROA, described in section 3.2. The two dependent variables were used to assess how the independent varia-bles explain the values that were or were not activated in connection to future tax benefits.
Due to the economic crisis of 2008, a dummy variable was included for this year to verify whether this phenome-non had any effect on the dependent variable, DTA. Such an effect would be verified by means of the coefficient of determination (r²): if this value were to change significan-tly, it would mean that the variable has some effect on the independent variables and should be applied to the remai-ning variables, and vice versa.
Another regression excluded LLP and TL as indepen-dent variables because they are significant components of DTA. The aim of this was to verify whether such exclusion
would have any effect on the dependent variable DTA. If any observable effect is identified in the regression results for the variable DTA, the exclusion should be applied to the remaining variable, and vice versa.
In the case of data panel regression, the objective was to assess which dependent variables had a greater influence on deferred taxes, considering time and the individual cha-racteristics of Brazilian financial institutions.
Data panel regression was applied using the STATA® software application. The dependent variables are DTA and TCC, and the dependent variables are LLP, TL, Tier I, ROA (M), Size, and Future ROA (the same that were used for multiple linear regression).
To understand the foundations of data panel regression, Fávero et al. (2009) stress that the main database formats related to the usage of cross-sections and time series must first be understood. To these authors, data panel analysis (also known as cross-sections across time) consists of a mix of these two approaches (cross-sections and time series) and arose from the need to analyze databases with these characteristics.
4 TESTS AND RESULTS
This section presents the tests employed in this study and their results. The hypotheses are analyzed, detailing the result of each regression applied to the variables, se-eking to achieve the objectives set for them.
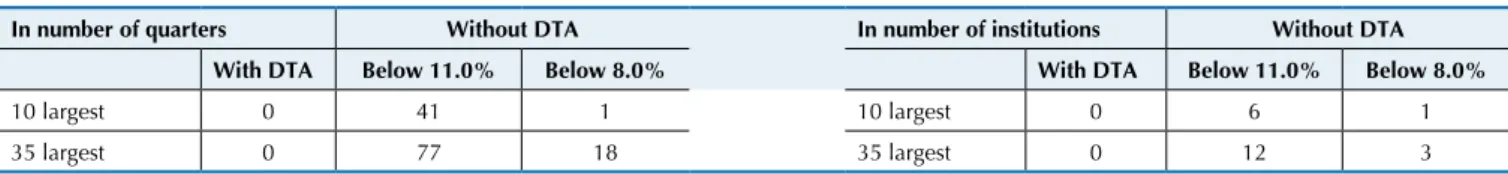
4.1 Hypothesis: Regulatory Capital Level.
To provide evidence on the effect of recognizing defer-red taxes as regulatory capital among Brazilian financial institutions, Tier I was calculated before and after DTA was included. Table 1 displays the results. With regard to the number of quarters, 41 of the 240 quarters in the sample
would have had Tier I capital of below 11%; considering the number of institutions, 6 of the 10 largest ones would have had Tier I capital of below 11%.
The results provide evidence that deferred taxes were used by Brazilian financial institutions to support or attain the minimum capital levels required by the Basel Accord, thus confirming the hypothesis. The non-conformity of an institution to the minimum required capital level exposes it to rigorous supervision by the Bacen; thus, the use of de-ferred taxes to meet the regulatory requirements may be of interest.
Table 1 Regulatory capital with and without deferred taxes
In number of quarters Without DTA In number of institutions Without DTA
With DTA Below 11.0% Below 8.0% With DTA Below 11.0% Below 8.0%
10 largest 0 41 1 10 largest 0 6 1
35 largest 0 77 18 35 largest 0 12 3
DTA = Differed Tax Assets
4.2 Hypothesis: Regulatory Capital Arbitrage.
This section provides evidence concerning the hy-pothesis of regulatory capital arbitrage by applying the multiple linear regression and data panel regression data analysis techniques.
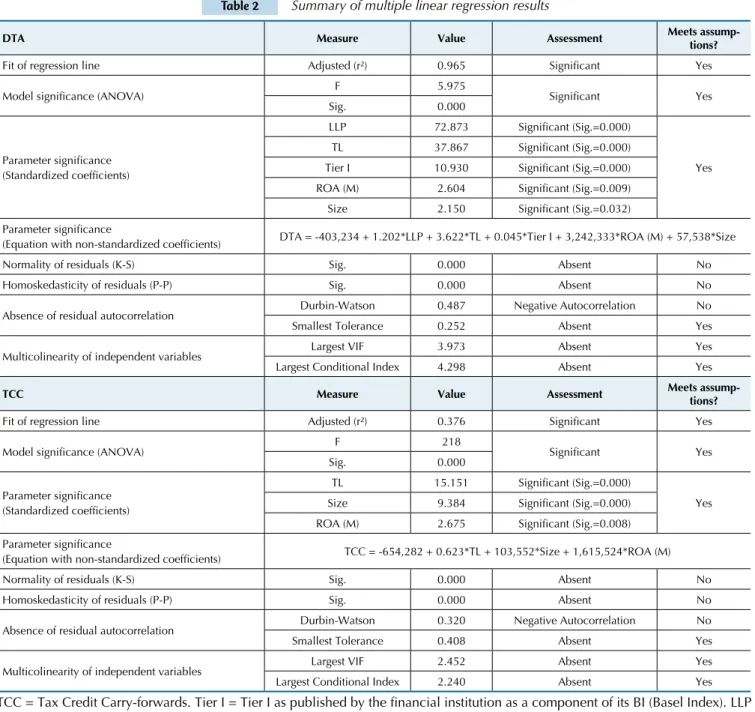
4.2.1 Application of Multiple Linear Regression. The first regression shows that all explanatory varia-bles (except Future ROA) are determinants of deferred tax assets, being responsible for an adjusted coefficient of determination (r²) of 0.965, which means that 96.5% of DTA variation is explained by variations in the inde-pendent variables contained in the model (LLP, TL, Tier I, ROA (M), Size).
The exclusion of the Future ROA variable was
unexpec-ted because, according to accounting standards, deferred tax assets can only be recognized if there is probable gene-ration of a future taxable income that is sufficiently large so that the tax credit can be used within the period in which compensation is allowed by fiscal regulation. It may be the case that the way in which Future ROA was measured does not correspond to this reality (it may be interesting to try to use another measure as a proxy for future profitability).
realistic from the point of view of the standard.
The fourth regression did not perform as well as the pre-vious ones: the adjusted coefficient of determination (r²) was 0.376. According to Skinner (2008), this result indica-tes that banks with relatively larger DTA due to allowances for doubtful accounts, larger past (and current) profitabili-ty and high expectation of future profitabiliprofitabili-ty tend to have lower TCC. These results are consistent with the idea that the higher the realization capacity of the DTA, the lower the TCC.
Table 2 summarizes the multiple linear regression re-sults. With regard to the assumptions of multiple linear
regressions: a) the normal distribution of residues was vio-lated because all the results obtained in the Kolmogorov-Smirnov test were different from zero, thus rejecting the null hypothesis; b) the absence of autocorrelation was vio-lated because the residues are correvio-lated to each other gi-ven that all regressions displayed negative autocorrelation, thus rejecting the null hypothesis; c) homoskedasticity was violated because all results obtained for Pesaran’s test were inferior to the 5% significance level, i.e., the residues are heteroskedastic, thus rejecting the null hypotheses; d) the absence of collinearity was not violated because there is no collinearity between the study variables.
Table 2 Summary of multiple linear regression results
DTA Measure Value Assessment Meets
assump-tions?
Fit of regression line Adjusted (r²) 0.965 Signiicant Yes
Model signiicance (ANOVA) F 5.975 Signiicant Yes
Sig. 0.000
Parameter signiicance (Standardized coeficients)
LLP 72.873 Signiicant (Sig.=0.000)
Yes
TL 37.867 Signiicant (Sig.=0.000)
Tier I 10.930 Signiicant (Sig.=0.000)
ROA (M) 2.604 Signiicant (Sig.=0.009)
Size 2.150 Signiicant (Sig.=0.032)
Parameter signiicance
(Equation with non-standardized coeficients) DTA = -403,234 + 1.202*LLP + 3.622*TL + 0.045*Tier I + 3,242,333*ROA (M) + 57,538*Size
Normality of residuals (K-S) Sig. 0.000 Absent No
Homoskedasticity of residuals (P-P) Sig. 0.000 Absent No
Absence of residual autocorrelation Durbin-Watson 0.487 Negative Autocorrelation No
Smallest Tolerance 0.252 Absent Yes
Multicolinearity of independent variables Largest VIF 3.973 Absent Yes
Largest Conditional Index 4.298 Absent Yes
TCC Measure Value Assessment Meets
assump-tions?
Fit of regression line Adjusted (r²) 0.376 Signiicant Yes
Model signiicance (ANOVA) F 218 Signiicant Yes
Sig. 0.000
Parameter signiicance (Standardized coeficients)
TL 15.151 Signiicant (Sig.=0.000)
Yes
Size 9.384 Signiicant (Sig.=0.000)
ROA (M) 2.675 Signiicant (Sig.=0.008) Parameter signiicance
(Equation with non-standardized coeficients) TCC = -654,282 + 0.623*TL + 103,552*Size + 1,615,524*ROA (M)
Normality of residuals (K-S) Sig. 0.000 Absent No
Homoskedasticity of residuals (P-P) Sig. 0.000 Absent No
Absence of residual autocorrelation Durbin-Watson 0.320 Negative Autocorrelation No
Smallest Tolerance 0.408 Absent Yes
Multicolinearity of independent variables Largest VIF 2.452 Absent Yes
Largest Conditional Index 2.240 Absent Yes
TCC = Tax Credit Carry-forwards. Tier I = Tier I as published by the inancial institution as a component of its BI (Basel Index). LLP = Loan Loss Provision. TF = Tax Loss. ROA (M) = mean Return on Assets of the last two quarters. Size = logarithm of Total Assets. DTA = Deferred Tax Assets.
According to the equations, the variable that most con-tributed to DTA was LLP, whereas TL was the one that most contributed to TCC.
The Tier I variable is positive and significant for DTA (value t = 10.93), which means that financial ins-titutions with strong financial positions tend to report
larger DTAs.
from each other, he used a dummy variable to differentiate regional banks (1) from the rest (0).
Despite of these differences, he showed that ROA (M) was the most important explanatory variable for DTA (the adjusted coefficient of determination (r²) for the regression was 0.849, negatively related to DTA), which was expected because financial institutions with lower past profitability and greater provisions for loan losses would naturally re-cognize larger DTA.
The author also showed that the most important varia-ble for TCC was ROA (M) (adjusted coefficient of determi-nation (r²) for the regression of 0.630, negatively related to TCC), which was expected because less profitable financial institutions should have larger TCC.
The fact that the studies performed by Skinner (2008) were based on Japanese banks limits the generalizability of the results because the hypotheses are tested based on ac-counting data that employ different principles, which can obviously lead to different results.
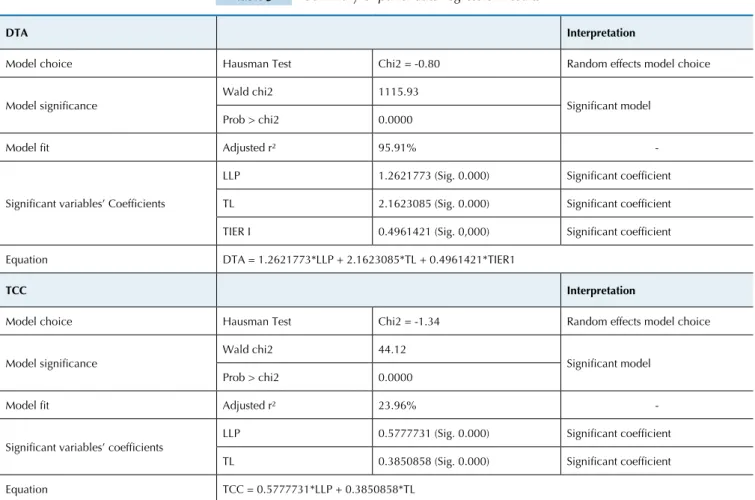
4.2.2 Application of Data Panel Regression.
The Hausman test was used to choose from the fixed and random effects models. The errors were not found to be significantly correlated to the independent varia-bles, which makes the random effects model preferable. It this case, variations in each financial institution's in-dividual characteristics are assumed to be random. The random effects model was chosen for the three explana-tory variables.
The Wald statistic indicates that the model is signifi-cant (Sig. below 5%). The goodness-of-fit of the model, represented by the overall r², represents the percentage of the variance of Y that can be explained by the variance of X. Finally, the variables considered to be significant by the model were added to the summary in Table 3. All variables are positive.
The application of data panels changes little in how the parameters and the model are interpreted compared to the multiple regression, but it increases accuracy when stu-dying several cross-sections (observations) over time. This explains why the values for the coefficient of determination (r²) obtained using data panel regression were lower than those obtained using multiple regressions.
The adjusted coefficient of determination (r²) for the variable DTA was 0.9591, meaning that 95.91% of the va-riance of variable Y can be explained by variations in X, adjusted by the number of cases and variables. The same variables as in the multiple linear regression model (LLP, TL and Tier I, represented in the equation) were found to be significant by this model.
The adjusted coefficient of determination (r2) for varia-ble TCC was 0.2396, meaning that 23.96% of the variance of variable Y is explained by variations in X, adjusted by the number of cases and variables. The variable TL was found to be significant by both statistical dependence techniques. Data panel regression also found LLP to be significant, while variables Size and ROA (M) were also significant in the multiple linear regression.
Table 3 Summary of panel data regression results
DTA Interpretation
Model choice Hausman Test Chi2 = -0.80 Random effects model choice
Model signiicance Wald chi2 1115.93 Signiicant model
Prob > chi2 0.0000
Model it Adjusted r² 95.91%
-Signiicant variables’ Coeficients
LLP 1.2621773 (Sig. 0.000) Signiicant coeficient
TL 2.1623085 (Sig. 0.000) Signiicant coeficient
TIER I 0.4961421 (Sig. 0,000) Signiicant coeficient
Equation DTA = 1.2621773*LLP + 2.1623085*TL + 0.4961421*TIER1
TCC Interpretation
Model choice Hausman Test Chi2 = -1.34 Random effects model choice
Model signiicance Wald chi2 44.12 Signiicant model
Prob > chi2 0.0000
Model it Adjusted r² 23.96%
-Signiicant variables’ coeficients LLP 0.5777731 (Sig. 0.000) Signiicant coeficient
TL 0.3850858 (Sig. 0.000) Signiicant coeficient
Equation TCC = 0.5777731*LLP + 0.3850858*TL
5 FINAL REMARKS
This study sought to provide evidence concerning the role of deferred tax assets and liabilities as instruments for Brazilian financial institutions to meet levels of re-gulatory capital and to arbitrate rere-gulatory capital in the period from 2004 to 2009. To meet the objectives of this study, two hypotheses were developed: a) regulatory ca-pital level hypothesis – managers of Brazilian financial institutions use deferred taxes to meet the required li-mits of regulatory capital, and b) capital arbitrage hypo-thesis – managers of Brazilian financial institutions use deferred tax discretionarily as instrument for regulatory capital arbitrage. The hypotheses were tested using the multiple linear regression and data panel regression data analysis techniques.
The regulatory capital level hypothesis was confir-med by means of tests that provided evidence that defer-red taxes were used by Brazilian financial institutions to support or attain the minimum levels of capital required by the Basel Accord.
The regulatory capital arbitrage hypothesis was also tes-ted by examining if deferred taxes are influenced not only by LLP values and tax losses but also by the levels of regu-latory capital required by the Basel Accord. However, there was evidence that managers have been realistic in recog-nizing deferred taxes, meaning that they are therefore not practicing regulatory capital arbitrage. The results show that financial institutions with stronger financial positions (larger Tier I) tend to report higher deferred tax assets. This result contradicts the international literature, according to which more deferred taxes are reported by institutions with
weaker financial positions, thus configuring itself as regu-latory capital arbitrage.
The usage of deferred taxes by financial institutions in the composition of their regulatory capital has been the subject of continuous scrutiny by Bacen. Therefore, althou-gh the analysis of the role of the regulatory agent was the focus of the present study, the function performed by Ba-cen of regulating and controlling the financial system must be stressed as an important variable within this context.
The study has limited itself to the chosen sample and period and, although the requirements to calculate the Ba-sel Index may differ from country to country, comparisons among countries may still be of interest for the discussion about regulatory capital standards. Another limitation is related to the choice of variables used in the study because these could have been calculated differently or an entirely different set of variables might have been defined. The fact that the studies performed by Skinner (2008) were based on Japanese banks limits the generalizability of the results because the hypotheses are tested based on accounting data based on different principles, which can obviously lead to different results.
One suggestion for future studies is to focus on how deferred taxes were established by regulators, rather than by accounting regulators, and how the time and manner in which deferred taxes have been adopted by Brazilian financial institutions might be consistent with the concept of regulatory tolerance. Another suggestion would be to use different variables to test the hypotheses contained in this study.
Agarwal, S., Chomsisengphet, S., Liu, C., & Rhee, G. (2007). Earnings management behaviors under diferent economic environments: evidence from Japanese banks. International Review of Economics and
Finance, 16 (3), 429-443.
Ahmed, A. S., Takeda, C., & Shawn, T. (1999, November). Bank loan loss provision: a reexamination of capital management, earnings management and signaling efects. Journal of Accounting and
Economics, 28 (1), 1-25.
Anandarajan, A., Hasan, I., & McCarthy, C. (2005). he use of loan loss provisions for earnings, capital management and signaling by
Australian banks. Bank of Finland Research. Working Paper Series, n.
23. Recuperado em 15 maio, 2011, de http://fordham.bepress.com. Banco Central do Brasil. Bacen. Recuperado em 12 fevereiro, 2012, de
http://www.bcb.gov.br.
Basel Committee on Banking Supervision. BCBS. (1988, July). International Convergence of Capital Measurement and Capital Standards. Bank for International Settlements (BIS). Recuperado em 11 maio, 2011, de http://www.bis.org.
Basel Committee on Banking Supervision. BCBS. (2009, August). History of the Basel Committee and its Membership. Bank for International Settlements (BIS). Recuperado em 11 maio, 2011, de http://www.bis. org.
Beatty, A., Chamberlain, S. L., & Magliolo, J. (1995). Managing inancial reports of commercial banks: the inluences of taxes, regulatory capital and earnings. Journal of Accounting Research, 33 (2), 231-261. Beneish, M. D. (2001). Earnings management: a perspective. Managerial
Finance, 27 (12), 3-17.
Bhat, V. N. (1996). Banks and income smoothing: an empirical analysis.
Applied Financial Economics, 6 (6), 505-510.
Blacconiere, W. G. (1991, March). Market reactions to accounting regulations in the savings and loan industry. Journal of Accounting and
Economics, 14 (1), 1-113.
Blacconiere, W. G., Bowen, R. M., Sefcik, S. A., & Stinson, C. H. (1991, June). Determinants of the use of regulatory accounting principles by savings and loans. Journal of Accounting and Economics, 14 (2), 167-201.
Circular n. 3.398, de 23 de julho de 2008 (2008). Estabelece procedimentos
para a remessa de informações relativas à apuração dos limites e padrões mínimos regulamentares que especiica. Banco Central do Brasil. Recuperado em 6 abril, 2012, de http://www.bcb.gov.br. Collins, J. H., Shackelford, D. A., & Wahlen, J. M. (1995). Bank diferences
in the coordination of regulatory capital, earnings, and taxes. Journal
of Accounting Research, 33 (2), 263-291.
Comunicado n. 12.746, de 09 de dezembro de 2004 (2004). Comunica os
procedimentos para a implementação da nova estrutura de capital – Basileia II. Banco Central do Brasil. Recuperado em 2 julho, 2011, de http://www.bcb.gov.br.
Comunicado n. 16.137, de 27 de setembro de 2007 (2007). Comunica os
procedimentos para a implementação da nova estrutura de capital – Basileia II. Banco Central do Brasil. Recuperado em 10 junho, 2012, de http://www.bcb.gov.br.
Dhaliwal, D. S., Gleason, C. A., & Mills, L. F. (2004, Summer). Last chance earnings management: using the tax expense to meet analysts’ forecasts. Contemporary Accounting Research, 21 (2), 431-459. Fávero, L. P., Beliore, P., Silva, F. L., & Chan, B. L. (2009). Análise de dados:
modelagem multivariada para tomada de decisões. Rio de Janeiro: Elsevier.
Fields, T., Lys, T. Z., & Vincent, L. (2001, September). Empirical research on accounting choice. Journal of Accounting and Economics, 31 (1-3), 255-307. Gee, M. A., & Mano, T. (2006). Accounting for deferred taxes in Japanese
banks and the consequences for their international operations.
Abacus, 42 (1), 1-21.
Gordon, M. J. (1964, April). Postulates, principles and research in accounting. he Accounting Review, 39 (2), 251-263.
Hair, J. F., Tatham, R. L., Anderson, R. E., & Black, W. (2005). Trad. A. S. Santana e A. Chaves Neto. Análise multivariada de dados. (5th ed.). Porto Alegre: Bookman.
Healy, P. M., & Wahlen, J. M. (1999). A review of the earnings management literature and its implications for standard setting.
Accounting Horizons, 13 (4), 365-383.
Hepworth, S. R. (1953). Periodic income smoothing. The Accounting
Review, 28 (1), 32-39.
Jones, D., & Mingo, J. (1998). Industry practices in credit risk modeling and internal capital allocations: implications for a models-based regulatory-capital standard. Economic Policy Review, Federal Reserve Bank of New York, 4 (3), 53-60.
Kane, E. J. (1988). Interaction of inancial and regulatory innovation.
American Economic Review, 78 (2), 328-34.
Kim, M., & Kross, W. (1998, February). he impact of the 1989 change in bank capital standards on loan loss provision and loan write-ofs.
Journal of Accounting and Economics, 25 (1), 69-99.
Lei n. 4.595, de 31 de dezembro de 1964 (1964). Dispõe sobre a política e
as instituições monetárias, bancárias e creditícias, cria o Conselho Monetário Nacional e dá outras providências. Brasília, DF. Recuperado em 7 junho, 2012, de http://www.planalto.gov.br.
Lei n. 6.024, de 13 de março de 1974 (1974). Dispõe sobre a intervenção
e a liquidação extrajudicial de instituições inanceiras, e dá outras providências. Brasília, DF. Recuperado em 9 junho, 2012, de http:// www.planalto.gov.br.
Lei n. 9.065, de 20 de junho de 1995 (1995). Dá nova redação a
dispositivos da Lei n. 8.981, de 20 de janeiro de 1995, que altera a legislação tributária federal, e dá outras providências. Brasília, DF. Recuperado em 8 junho, 2012, de http://www.planalto.gov.br.
Lei n. 9.430, de 27 de dezembro de 1996 (1996). Dispõe sobre a legislação
tributária federal, as contribuições para a seguridade social, o processo administrativo de consulta e dá outras providências. Brasília, DF. Recuperado em 19 outubro, 2011, de http://www.receita. fazenda.gov.br.
Miller, G. S., & Skinner, D. J. (1998). Determinants of the valuation allowance for deferred tax assets under SFAS n. 109. he Accounting
Review, 73 (2), 213-233.
Moyer, S. (1990). Capital adequacy ratio regulations and accounting choices in commercial banks. Journal of Accounting and Economics, 13 (2), 123-154.
Perez, D., Salas-Fumá, V., & Saurina, J. (2008). Earnings and capital management in alternative loan loss provision regulatory regimes.
European Accounting Review, 17 (3), 423-445.
Resolução CMN (Conselho Monetário Nacional) n. 2.099, de 17 de
agosto de 1994 (1994). Aprova regulamentos que dispõem sobre as
condições relativamente ao acesso ao Sistema Financeiro Nacional, aos valores mínimos de capital e patrimônio líquido ajustado, à instalação de dependências e à obrigatoriedade da manutenção de patrimônio líquido ajustado em valor compatível com o grau de risco das operações ativas das instituições inanceiras e demais instituições. Banco Central do Brasil. Recuperado em 27 março, 2011, de http:// www.bcb.gov.br.
Resolução CMN (Conselho Monetário Nacional) n. 2.212, de 16 de
novembro de 1995 (1995). Altera os dispositivos das Resoluções n.
2.099, de 17/08/94, e 2.122, de 30/11/94. Banco Central do Brasil. Recuperado em 26 maio, 2012, de http://www.bcb.gov.br.
Resolução CMN (Conselho Monetário Nacional) n. 2.399, de 25 de junho
de 1997 (1997). Altera a fórmula de cálculo do patrimônio líquido de
que trata o regulamento Anexo IV à Resolução n. 2.099, de 17/08/94. Banco Central do Brasil. Recuperado em 27 março, 2011, de http:// www.bcb.gov.br.
Resolução CMN (Conselho Monetário Nacional) n. 2.543, de 26 de agosto de 1998 (1998). Estabelece nova conceituação de capital mínimo compatível com o grau de risco das operações ativas das instituições inanceiras e demais instituições autorizadas a funcionar pelo Banco Central do Brasil. Recuperado em 26 maio, 2012, de http://www.bcb.gov.br.
Resolução CMN (Conselho Monetário Nacional) n. 2.606, de 27 de maio de 1999. (1999). Estabelece o limite total de exposição em ouro e ativos e passivos referenciados em variação cambial, em bases consolidadas, para as instituições inanceiras, demais instituições autorizadas a funcionar pelo Banco Central do Brasil e suas controladas diretas e
indiretas. Banco Central do Brasil. Recuperado em 8 junho, 2012, de http://www.bcb.gov.br.
Resolução CMN (Conselho Monetário Nacional) n. 2.802, de 21 de
dezembro de 2000 (2000). Deine o patrimônio de referência das
instituições inanceiras e demais instituições autorizadas a funcionar pelo Banco Central do Brasil. Banco Central do Brasil. Recuperado em 19 outubro, 2011, de http://www.bcb.gov.br.
Resolução CMN (Conselho Monetário Nacional) n. 2.837, de 30 de maio
de 2001 (2001). Deine o patrimônio de referência das instituições
inanceiras e demais instituições autorizadas a funcionar pelo Banco Central do Brasil. Banco Central do Brasil. Recuperado em 19 outubro, 2011, de http://www.bcb.gov.br.
Resolução CMN (Conselho Monetário Nacional) n. 3.059, de 20 de
dezembro de 2002 (2002). Dispõe sobre registro contábil de créditos
tributários das instituições inanceiras e demais instituições autorizadas a funcionar pelo Banco Central do Brasil. Banco Central do Brasil. Recuperado em 27 março, 2011, de http://www.bcb.gov.br.
Resolução CMN (Conselho Monetário Nacional) n. 3.355, de 31 de março
de 2006 (2006). Altera a Resolução n. 3.059, de 2002, que dispõe
sobre o registro contábil de créditos tributários das instituições inanceiras e demais instituições autorizadas a funcionar pelo Banco Central do Brasil. Banco Central do Brasil. Recuperado em 27 março, 2011, de http://www.bcb.gov.br.
Resolução CMN (Conselho Monetário Nacional) n. 3.444, de 28 de fevereiro
de 2007 (2007). Deine o Patrimônio de Referência (PR). Banco Central
do Brasil. Recuperado em 19 outubro, 2011, de http://www.bcb.gov.br.
Resolução CMN (Conselho Monetário Nacional) n. 3.490, de 29 de agosto
de 2007 (2007). Dispõe sobre a apuração do Patrimônio de Referência
Exigido (PRE). Banco Central do Brasil. Recuperado em 15 maio, 2011, de http://www.bcb.gov.br.
Resolução CMN (Conselho Monetário Nacional) n. 3.655, de 17 de
dezembro de 2008 (2008). Altera a Resolução n. 3.059, de 2002,
que dispõe sobre o registro contábil de créditos tributários das instituições inanceiras e demais instituições autorizadas a funcionar pelo Banco Central do Brasil. Banco Central do Brasil. Recuperado em 30 outubro, 2011, de http://www.bcb.gov.br.
Rivard, R. J., Bland, E., & Morris, G. B. H. (2003). Income smoothing behavior of U.S. banks under revised international capital requirements. IAER, 9 (4), 288-294.
Robb, S. W. G. (1998). he efect of analysts’ forecasts on earnings management in inancial institutions. Journal of Financial Research, 21 (3), 315-331.
Ronen, J., & Sadan, S. (1975, Spring). Classiicatory smoothing: alternative income models. Journal of Accounting Research, 13 (1), 133-149. Santos, E. C. (2007). Capital regulatório e gerenciamento de resultados nas
instituições brasileiras que atuam no Brasil. Dissertação de mestrado,
Fundação Instituto Capixaba de Pesquisas em Contabilidade, Economia e Finanças, FUCAPE, Vitória, ES, Brasil.
Scheiner, J. H. (1981). Income smoothing: an analysis in the banking industry. Journal of Bank Research, 12 (2), 119-123.
Scholes, M. S., Wilson, G. P., & Wolfson, M. A. (1990, Winter). Tax planning, regulatory capital. Planning, and inancial reporting strategy for commercial banks. Review of Financial Studies, 3 (4), 625-650.
Schrand, C. M., & Wong, M. H. F. (2003, Fall). Earnings management using the valuation allowance for deferred tax assets under SFAS n. 109. Contemporary Accounting Research, 20 (3), 579-611.
Shrieves, R. E., & Dahl, D. (2003, July). Discretionary accounting and the behavior of Japanese banks under inancial duress. Journal of Banking
and Finance, 27 (7), 1219-1243.
Skinner, D. J. (2008, Dec. 2008). he rise of deferred tax assets in Japan: the role of deferred tax accounting in the Japanese banking crisis.
Journal of Accounting and Economics, 46 (2), 218-239.
Sobreira, R., & Martins, N. M. (2011). Os Acordos de Basileia e bancos de desenvolvimento no Brasil: uma avaliação do BNDES e do BNB.
Revista de Administração Pública - RAP, 45 (2), 349-376.
Wasserman, C. (2004). O ativo iscal diferido no Sistema Financeiro
Nacional: análise e proposta de contabilização. Dissertação de