K
K
n
n
o
o
w
w
l
l
e
e
d
d
g
g
e
e
-
-
b
b
a
a
s
s
e
e
d
d
e
e
n
n
t
t
r
r
e
e
p
p
r
r
e
e
n
n
e
e
u
u
r
r
s
s
h
h
i
i
p
p
a
a
n
n
d
d
e
e
m
m
p
p
l
l
o
o
y
y
m
m
e
e
n
n
t
t
g
g
r
r
o
o
w
w
t
t
h
h
i
i
n
n
P
P
o
o
r
r
t
t
u
u
g
g
a
a
l
l
R
R
i
i
c
c
a
a
r
r
d
d
o
o
M
M
a
a
m
m
e
e
d
d
e
e
T
T
e
e
r
r
e
e
s
s
a
a
F
F
e
e
r
r
n
n
a
a
n
n
d
d
e
e
s
s
2
2
0
0
1
1
2
2
W
W
P
P
n
n
.
.
º
º
2
2
0
0
1
1
2
2
/
/
1
1
2
2
DOCUMENTO DE TRABALHO WORKING PAPER*DINÂMIA’CET – IUL and ISCTE – IUL. ** UECE.
Knowledge-based entrepreneurship and employment
growth in Portugal
Ricardo Mamede* Teresa Fernandes**
WP n.º 2012/12
1. INTRODUCTION ... 3
2. DATA AND DEFINITIONS ... 5
3. MAIN TRENDS IN EMPLOYMENT GROWTH ... 6
5. CONCLUSIONS ... 16
6. REFERENCES ... 17
2
DINÂMIA’CET – IUL, Centro de Estudos sobre a Mudança Socioeconómica e o TerritórioISCTE-IUL – Av. das Forças Armadas, 1649-026 Lisboa, PORTUGAL
Tel. 210464031 - Extensão 293100 E-mail: dinamia@iscte.pt www.dinamiacet.iscte.pt
K
K
n
n
o
o
w
w
l
l
e
e
d
d
g
g
e
e
-
-
b
b
a
a
s
s
e
e
d
d
e
e
n
n
t
t
r
r
e
e
p
p
r
r
e
e
n
n
e
e
u
u
r
r
s
s
h
h
i
i
p
p
a
a
n
n
d
d
e
e
m
m
p
p
l
l
o
o
y
y
m
m
e
e
n
n
t
t
g
g
r
r
o
o
w
w
t
t
h
h
i
i
n
n
P
P
o
o
r
r
t
t
u
u
g
g
a
a
l
l
11Abstract
In this paper we try to assess the direct impact of knowledge-based entrepreneurship (understood as the creation of new firms that intensively rely on more educated workers) on net changes in employment at both the economy and the industry levels. Based on a descriptive analysis, we show that new knowledge-based firms (KBF) differentiate themselves from other firms (new or not new) by having a positive direct contribution on net employment growth (whereas most groups of incumbents contribute negatively to changes in employment in subsequent years). Notwithstanding, new KBFs’ direct impact on net employment growth is rather small, for two reasons: first, although KBFs tend to add jobs to the existing ones in net terms, the number of additional jobs for each employee in the base year tends to be modest; secondly, the share of new KBFs in overall employment is marginal. These results show some variability across industries, as a result of both the knowledge-intensity and the rate of firm turbulence of each industry. In any case, only in a few industries can new KBF be said to make a difference in net employment growth (among which stand out some knowledge-intensive services).
1 This research was developed under AEGIS, a Collaborative Project co-funded by the European
Commission under Theme 8 “Socio-Economic Sciences and Humanities” of the 7th Framework Programme for Research and Technological Development (Project Number: 225134).
3
DINÂMIA’CET – IUL, Centro de Estudos sobre a Mudança Socioeconómica e o TerritórioISCTE-IUL – Av. das Forças Armadas, 1649-026 Lisboa, PORTUGAL
Tel. 210464031 - Extensão 293100 E-mail: dinamia@iscte.pt www.dinamiacet.iscte.pt
1. INTRODUCTION
In the last two decades the notion that the current economies are more dependent than ever on the production, distribution and use of knowledge has become widespread. The concept of ‘knowledge-based economy’ has been adopted by the OECD (1996) in order to describe economies which are essentially based on the production, distribution and use of knowledge (as reflected, for example, in the increasing importance of R&D or highly skilled labour for the economic performance of firms and countries). In line with that notion – and with the contributions of evolutionary theories of economic growth (e.g., Nelson and Winter, 1982; Nelson, 1996; Fagerberg, 1994) and of the so-called ‘new growth theory’ (e.g., Romer, 1986, 1990; Lucas, 1988) – investments in R&D and in human capital have become a central concern for policy makers all over the world.
However, the new knowledge and skills that result from such investments do not automatically translate into enhanced economic performance. As put by Carlsson et al. (2007), the effectiveness of the conversion of general knowledge into innovation and economic performance depends on the presence of a transformative mechanism fostering such conversion – such as entrepreneurship. These authors point to the increasing importance in recent decades of new ventures (in contrast with the central role of incumbents in previous periods) as a mechanism to transform investments in the creation of new knowledge into economic activity.
There are several reasons that may explain the increasing importance of new, and typically small, firms as mechanisms to transform general knowledge into innovations and economic performance, such as (Carree and Thurik, 2011): the emergence of new industries like software and biotechnology, in which small firms have a relative innovative advantage over their larger counterparts; the reduced importance of scale economies in many sectors associated with new technologies (especially ICT); the tendency of large firms to concentrate on their core competences; the increase in the demand for variety as a result of increasing incomes and wealth; or the increased share of services in employment (the average size of most services is relatively small).
In recent years, several studies tried to empirically assess the contribution of new ventures for innovation and employment generation (for a survey, see van Praag and Versloot 2007). The impact of new firms on employment growth is often analysed at the aggregate level, taking into account both direct and indirect effects. For example, Fritsch and Mueller (2004) suggest that the effects of new firm formation on regional employment occur with different time lags, in three stages: in the first stage there is a positive direct effect through the creation of additional
4
DINÂMIA’CET – IUL, Centro de Estudos sobre a Mudança Socioeconómica e o TerritórioISCTE-IUL – Av. das Forças Armadas, 1649-026 Lisboa, PORTUGAL
Tel. 210464031 - Extensão 293100 E-mail: dinamia@iscte.pt www.dinamiacet.iscte.pt
jobs by new ventures; in the second stage there are both direct and indirect, typically negative, effects, associated with the high failure rates of new ventures and with the displacement of inefficient incumbents by successful entrants; and, finally, in the third stage start-ups again contribute positively to employment, by the rapid growth of those new firms that survive, by the increased efficiency induced by intensified competition and process innovation, and due to enhanced market demand induced by product innovation.
Recent studies have also shown that new firms are not all alike, and their contribution to employment growth tends to vary according to certain characteristics – in particular to knowledge intensity. For example, in her study on German regions, Mueller (2007) finds that an increase in innovative start-up activity (understood as start-ups in industries considered as innovative) is more effective than an increase in general entrepreneurship for economic growth. More generally, it is a well known fact that the performance of new firms is highly asymmetric, with many entrants exiting the market short after their inception, and some of the survivors growing rapidly in their first years of activity (Geroski, 1995).
In this paper we analyse the relevance of knowledge (residing in more educated workers) as a source of asymmetric contributions to employment growth by new firms. In particular, we use descriptive methods to assess the direct contribution of what we call ‘knowledge-based entrepreneurship’ to the net employment growth.
The paper is organized as follows. In the next section we present the data and our definition of knowledge-based entrepreneurship. In section 3 we present the main trends in employment growth in Portugal, in order to contrast the general trends with the focus of our analysis. Section 4 is then dedicated to the analysis of the direct contribution of knowledge-based entrepreneurship to employment growth, including a brief discussion of industry specificities concerning this issue. Section 5 concludes.
5
DINÂMIA’CET – IUL, Centro de Estudos sobre a Mudança Socioeconómica e o TerritórioISCTE-IUL – Av. das Forças Armadas, 1649-026 Lisboa, PORTUGAL
Tel. 210464031 - Extensão 293100 E-mail: dinamia@iscte.pt www.dinamiacet.iscte.pt
2. DATA AND DEFINITIONS
The data used in this paper was obtained from the ‘Quadros de Pessoal’ database, which compiles information on workers and firms, collected on a yearly basis by the Portuguese Ministry of Social Solidarity (MSS). The survey is compulsory for all firms that employ paid labour in Portugal and includes questions related to the characteristics of both firms (e.g. total employment and industry classification) and their employees (e.g., educational background). Both firms and workers are identified by their social security numbers, which allows for longitudinal analyses. Our longitudinal data includes 288.451 distinct firms which were active between 1995 and 2008 in market oriented industries (see methodological annex for details)2.
A central concept in this paper is that of knowledge-based entrepreneurship. Neither the notion of entrepreneurship, nor that of ‘knowledge-baseness’ have an unequivocal definition in the literature. For example, whereas entrepreneurship is commonly associated with the role of individuals who perceive and create new economic opportunities through the start-up of new firms, it often comprises similar activities of individuals within existing organizations (the so-called corporate entrepreneurship). In the present context, we restrict our attention to the creation of new firms.
The concept of knowledge-based (or knowledge-intensive) firms is even less clearly defined in the literature. For example, for Ditillo (2004) knowledge-intensive firms are ‘firms that provide intangible solutions to customer problems by using mainly the knowledge of their individuals’, whereas Alvesson (2000) uses the same category referring to ‘companies where most work can be said to be of an intellectual nature and where well-educated, qualified employees form the major part of the workforce’. In a similar vein, Lee (1999) considers as knowledge-based firms ‘those staffed by a high proportion of highly qualified staff’. In line with these definitions, in this paper we classify firms as knowledge-based according to the educational background of the employees.
Thus, knowledge-based entrepreneurship is proxied by new knowledge-based firms (KBF), here defined as firms that are less than three years old and have a proportion of employees holding a university degree which is equal to or greater than the average of the corresponding industry (at three digit level of NACE 1.1).
6
DINÂMIA’CET – IUL, Centro de Estudos sobre a Mudança Socioeconómica e o TerritórioISCTE-IUL – Av. das Forças Armadas, 1649-026 Lisboa, PORTUGAL
Tel. 210464031 - Extensão 293100 E-mail: dinamia@iscte.pt www.dinamiacet.iscte.pt
3. MAIN TRENDS IN EMPLOYMENT GROWTH
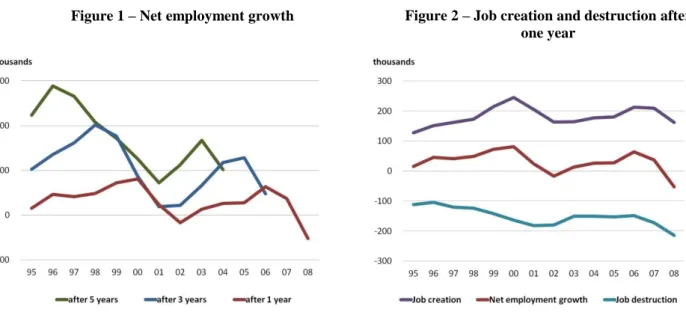
During the period under analysis (1995-2008), total employment in the industries included in our dataset has followed closely the aggregate evolution of the Portuguese economy. Yearly employment changes have been positive, except in 2002 and 2008, when the country has experienced negative changes in GDP. Changes in total employment at longer time spans have been persistently positive, although following similar patterns (Figure 1). Underneath these general patterns there was significant turbulence in terms of creation and destruction of jobs (Figure 2): between 100 and 200 thousand jobs were destroyed every year by firms that experienced a contraction in their total work force or exited the market (job destruction), while between 100 and 250 thousand jobs were created by firms that registered an expansion in the number of employees or entered the market (job creation
).
Note: in this and the following graphs the horizontal axes correspond to the base year of the processes under analysis.
It is worth noting that the distribution of net job changes at the firm level is rather asymmetric. The proportion of incumbent firms that contribute positively to net job growth varies between 20% and 30%, whereas almost half of the firms do not register any change in the number of employees from one year to the next (Figure 3a). At longer time spans, however, the number of stagnant firms strongly diminishes, even though the proportion of expanding firms does not deviate significantly from the 20%-30% interval (Figure 3b). In fact, considering net job changes after 5 years, we can see that nearly 3/5 of the firms are destroying jobs in net terms, either by reducing their size or exiting the market.
Figure 1 – Net employment growth Figure 2 – Job creation and destruction after one year
7
DINÂMIA’CET – IUL, Centro de Estudos sobre a Mudança Socioeconómica e o TerritórioISCTE-IUL – Av. das Forças Armadas, 1649-026 Lisboa, PORTUGAL
Tel. 210464031 - Extensão 293100 E-mail: dinamia@iscte.pt www.dinamiacet.iscte.pt
Figure 3 – Distribution of firms according to net change in employment a) After 1 year b) After 5 years
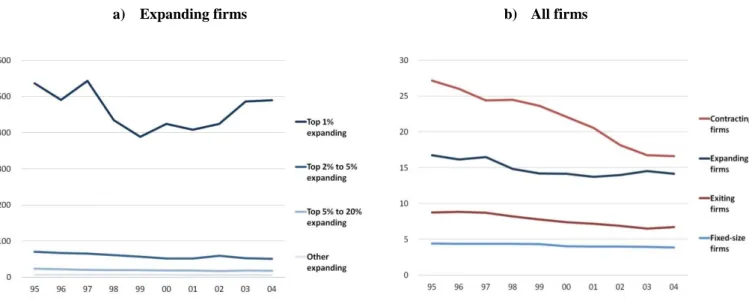
Positive changes in total employment are not solely explained by incumbent firms that experience net job growth (Figure 4). In fact, a substantial share of job creation is due to firms that are yet to be born: on average, about 2/5 of job creation after one year and 2/3 of job creation after five years are due to firms that were inexistent in the base year but which entered the market in the meantime. Although these figures look rather striking, one should keep in mind the fact that, contrarily to incumbents, firms that are yet to be born cannot destroy jobs, since the number of jobs in non-existing firms is, by definition, null; thus, their contribution to net job changes have zero as a lower bound. Figure 4 also shows that a substantial proportion of job creation by incumbent firms is concentrated in a small number of firms: nearly 1/3 of job creation after one year by incumbent firms (and 2/5 after five years) is explained by that 1% of firms that have grown the most in absolute terms.
Figure 4 – Net employment growth by growth group
8
DINÂMIA’CET – IUL, Centro de Estudos sobre a Mudança Socioeconómica e o TerritórioISCTE-IUL – Av. das Forças Armadas, 1649-026 Lisboa, PORTUGAL
Tel. 210464031 - Extensão 293100 E-mail: dinamia@iscte.pt www.dinamiacet.iscte.pt
Typically, the firms that expand the most in absolute terms are to be found among the largest firms in the economy (Figure 5a). Actually, given their weight in the economy, large and medium size firms are usually the biggest contributors among incumbent firms both to job creation and to job destruction. As Figure 5b shows, the average size of both contracting and expanding firms is much higher than the average size of either exiting or stagnant
firms.
Figure 5 – Average size of firms by growth group (after 5 years)
a) Expanding firms b) All firms
In every size group there are firms that grow, contract, exit or remain stagnant3. However, overall, every size group of incumbent firms tends to contribute negatively to net employment growth (Figure 6). In other words, within each size group of incumbent firms, the positive contribution to net employment changes by expanding firms is not enough to compensate for the job destruction by contracting and exiting firms. Thus, if one aggregates incumbent firms by size groups (instead of, for example, by growth groups, as was done in Figure 4), the only positive contributions to changes in net employment come from firms that are yet to be born.
3 In this paper, firms are classified in terms of size groups according to the number of people they employ.
Thus, the number of worker varies: from 1 to 9, in the case of very small (or micro) firms; from 10 to 49, in the case of small firms; from 50 to 249 in the case of medium-size firms; and from 250 onwards, in the case of large firms.
9
DINÂMIA’CET – IUL, Centro de Estudos sobre a Mudança Socioeconómica e o TerritórioISCTE-IUL – Av. das Forças Armadas, 1649-026 Lisboa, PORTUGAL
Tel. 210464031 - Extensão 293100 E-mail: dinamia@iscte.pt www.dinamiacet.iscte.pt
Figure 6 – Net employment growth by firm size group
a) After 1 year b) After 5 years
The distribution of incumbent firms’ contribution to (negative) net employment growth across firm size groups resembles to some extent the distribution of total employment in the base year, especially when we are considering net employment growth over longer periods (Figure 7). This, however, is less true for large firms: the contribution of these firms to the negative change in employment among incumbents is less pronounced than what would be expected on the basis of their weight in total employment.
Figure 7 – Contribution to negative changes in employment by incumbent firms’ size group (average 1995-2008)
In other words, among incumbents the largest firms are the ones that, on average, eliminate fewer jobs with relation to their share of employment. This does not mean, however, that the share of large firms in total employment has been growing over time: as we have seen before, a substantial contribution to net employment growth (actually, virtually all net employment growth if we aggregate incumbent firms in size groups) comes from firms that are yet to be born. Since the size of such firms is typically below the average firm size (see, e.g., Geroski,
10
DINÂMIA’CET – IUL, Centro de Estudos sobre a Mudança Socioeconómica e o TerritórioISCTE-IUL – Av. das Forças Armadas, 1649-026 Lisboa, PORTUGAL
Tel. 210464031 - Extensão 293100 E-mail: dinamia@iscte.pt www.dinamiacet.iscte.pt
1995), over the years the contribution of small and very small entrants to net employment growth more than compensates the negative employment change among incumbent firms of the same size groups. In fact, as shown in Figure 8, the share of small and very small firms in total employment has steadily increased over the period.
Figure 8 – Distribution of employment among firm size groups
Although entrants are responsible for a substantial share of net employment growth, such contribution typically does not last long. Figure 9 shows the contribution to net employment growth by firm age group4. We can see that the youngest firms do not give a consistent positive contribution to net employment growth. This reflects the well-known fact (see, for example, Geroski, 1995) that most new firms exit the market in their first years of activity.
4 In this paper, a firm is considered as: new, if it is in its first or second year of activity; young, if it is in its
third or ninth year of activity; and old, if it is ten years old or more.
Figure 9 – Net employment growth by firm age group
11
DINÂMIA’CET – IUL, Centro de Estudos sobre a Mudança Socioeconómica e o TerritórioISCTE-IUL – Av. das Forças Armadas, 1649-026 Lisboa, PORTUGAL
Tel. 210464031 - Extensão 293100 E-mail: dinamia@iscte.pt www.dinamiacet.iscte.pt
Nevertheless, Figure 10 shows that, for incumbent firms : (i) older firms contribute less than proportionally to both job creation and job destruction than younger firms; and (ii) older firms’ share of job creation is smaller than their share of job destruction, while the opposite happens for younger firms. Still, one should keep in mind that job destruction is typically higher than job creation for every age group of incumbent firms – and this accounts for the fact that the contribution to net employment growth is typically non-positive for all age groups of incumbent firms.
Figure 10 – Average contribution to job creation and job destruction by firm age group (1995-2008)
a) After 1 year
b) After 5 yearsThe results discussed in this section can be summarized as follows:
a) only a modest proportion of incumbent firms contribute positively to net job growth in subsequent years;
b) a substantial share of job creation is due to firms that are yet to be born;
c) every size group of incumbent firms tends to contribute negatively to net employment growth; d) on average, incumbent firms of smaller size groups contribute more than proportionally to
reductions in net employment;
e) since firms that are yet to be born are typically of smaller sizes, and given their substantial contribution to job creation, the share of small and very small firms in total employment has increased over the years;
f) on average, the contribution of younger age groups is typically non-positive and more than proportional to their weight in total employment; in other words, the positive impact on employment by firms that are yet to be born largely vanishes soon after they enter the market.
A central conclusion that seems to emerge from these results is that the growth in net employment is mainly due to the continuous entry of new firms, whose level of job creation in the short run more than compensates the negative changes in net employment of incumbent firms. The analysis conducted in this section, however, did not discriminate among firms within
12
DINÂMIA’CET – IUL, Centro de Estudos sobre a Mudança Socioeconómica e o TerritórioISCTE-IUL – Av. das Forças Armadas, 1649-026 Lisboa, PORTUGAL
Tel. 210464031 - Extensão 293100 E-mail: dinamia@iscte.pt www.dinamiacet.iscte.pt
each size and age group. In what follows, we analyze how this analysis changes when we consider differences among firms in relation to ‘knowledge-baseness’.
4. KBE AND TOTAL EMPLOYMENT GROWTH
In this paper we consider as being knowledge-based those firms that have a proportion of employees holding a university degree which is equal to or greater than the average of the corresponding industry (at NACE’s three digit level). As can be seen in Figure 11, the proportion of knowledge-based firms (KBF) and, to a lesser degree, their share in employment, have steadily increased over the period under analysis5. This is truth both for new KBF (that is, firms in their first or second year of activity) and for other KBF.
Figure 11 – The weight of knowledge-based firms in the total number of firms and workers
a) Firms b) Workers
In contrast with other analyses of the impact of start-ups on employment which classify new firms according to the characteristics of the corresponding industry (e.g., Mueller, 2007), using our definition it is possible to find knowledge-based firms in every industry (in essence, KBFs are the most intensive users of human capital in each industry). Thus, the distribution of KBFs across industries tends to reflect the distribution of total firms. To some extent, the same applies to new KBFs, although here one has to consider the variability of entry rates across industries.
5 Since we are using a definition of KBF which is relative to the industry average, this means that the right
tail of the distribution of knowledge intensity (as defined above) has become longer and thinner. In other words, there is a higher proportion of firms that differentiate from their industries’ average in terms of proportion of qualified workers.
13
DINÂMIA’CET – IUL, Centro de Estudos sobre a Mudança Socioeconómica e o TerritórioISCTE-IUL – Av. das Forças Armadas, 1649-026 Lisboa, PORTUGAL
Tel. 210464031 - Extensão 293100 E-mail: dinamia@iscte.pt www.dinamiacet.iscte.pt
Figure 12a displays the distribution of new KBFs and of total firms across six main sectors, which were classified according to the technology/knowledge intensity of manufacturing and services activities6. As one could expect on the basis of the distribution of total firms, the great majority of new KBF belong to non-knowledge-intensive services and construction activities. The share of this aggregate in the total of new KBFs is even slightly higher than its weight in total firms – which is due to the fact that those industries are subjected to high levels of firm turnover.
Figure 12a also shows that knowledge-intensive services and high-tech manufacturing industries are responsible for a higher than proportional share of new KBFs (with regard to their share in total firms), while the opposite applies to low and medium-low tech manufacturing. Two reasons seem to account for these facts. First, in more intensive industries the distribution of human capital intensity across firms is less asymmetric than in less intensive industries; in other words, whereas in non-knowledge intensive industries knowledge-intensive firms tend to be outliers in a distribution clearly biased towards low levels of human capital intensity at the firm level, in more knowledge-intensive industries the distribution of human capital intensity is less skewed (resulting in a greater proportion of firms being considered as KBF – see Figure 12b). Second, the rates of firm turnover tend to be higher in services activities (both knowledge-intensive and others), namely due to lower entry barriers (such as economies of scale) and in high-tech industries (namely due to greater technological opportunities).
6 We follow closely the aggregation used by Eurostat, with minor adaptations. In particular, we added
construction to the group of other services, see:
http://epp.eurostat.ec.europa.eu/cache/ITY_SDDS/Annexes/htec_esms_an3.pdf.
Figure 12 – Industry profile of new knowledge-based firms
14
DINÂMIA’CET – IUL, Centro de Estudos sobre a Mudança Socioeconómica e o TerritórioISCTE-IUL – Av. das Forças Armadas, 1649-026 Lisboa, PORTUGAL
Tel. 210464031 - Extensão 293100 E-mail: dinamia@iscte.pt www.dinamiacet.iscte.pt
One should note, however, that within each of the industry aggregates mentioned above there may be substantial differences among specific industries. Figure 13 lists the industries (at the two digit level of NACE 1.1) with the highest and the lowest percentages of workers employed by new KBFs. This confirms that new KBFs account for a smaller proportion of employment in industries which are characterized by significant economies of scale (which work as entry barriers).
Figure 13 – New knowledge-based firms’s workers as a percentage of industrys’ workers
a) Industries with the highest percentages b) Industries with the lowest percentages
Keeping in mind the distribution of new KBF across industries and the specificities of each industry, it is possible to show that new KBF differentiate themselves from other firms (new or not new) in terms of employment growth. Typically, the group of new KBF: (i) has a higher proportion of firms that expand in number of employees over the years; and (ii) has a lower proportion of firms that exit in the first years after entry (Figure 14).
Figure 14 - Distribution of firms according to net change in employment after 5 years (new firms) a) New knowledge-based firms b) Other new firms
Nevertheless, the positive contribution of new KBF to employment growth is rather modest in terms of its absolute impact on employment (Figure 15), namely in comparison with the impact of firms that are yet to be born. Figure 15 also suggests that older knowledge-based firms have typically a negative impact on employment, especially in longer time periods.
15
DINÂMIA’CET – IUL, Centro de Estudos sobre a Mudança Socioeconómica e o TerritórioISCTE-IUL – Av. das Forças Armadas, 1649-026 Lisboa, PORTUGAL
Tel. 210464031 - Extensão 293100 E-mail: dinamia@iscte.pt www.dinamiacet.iscte.pt
Figure 15 – Net employment growth by knowledge intensity and firm age After 1 year After 5 years
The contribution of new KBF varies considerably across industries. In Figure 16 we present the net number of jobs that were added by new KBF between 2003 and 2006 for each worker employed by those firms in 20037, aggregated by the industry groups that were used above and also for the whole set of industries in the dataset. There we can see that, on average, for each person employed by a new KBF in 2003, 0,01 jobs were added in 2006, confirming the modest impact of new KBFs on employment that we mentioned before. The proportion of additional jobs to existing ones is substantially higher in medium-low tech manufacturing industries and in knowledge-intensive services, than in low tech manufactures (where the direct impact of new KBF on employment is actually negative). Given the weight of new KBF in each industry aggregate (see Figure 12b), only in the case of knowledge-based services can new KBF be said to have played a non-negligible role in net employment growth during this period.
7 We have only considered this time period in order to avoid the complications associated with the
changes in industry classifications which occurred between in 2002-2003 and 2006-2007.
16
DINÂMIA’CET – IUL, Centro de Estudos sobre a Mudança Socioeconómica e o TerritórioISCTE-IUL – Av. das Forças Armadas, 1649-026 Lisboa, PORTUGAL
Tel. 210464031 - Extensão 293100 E-mail: dinamia@iscte.pt www.dinamiacet.iscte.pt
5. CONCLUSIONS
The last few decades have been characterized by an increased relevance of both knowledge (as a factor of production – OECD, 1996), and young and smaller firms (as transformative mechanisms – Carlsson et al., 2007) in economies around the world. In this paper we try to assess the direct impact of knowledge-based entrepreneurship (understood as the creation of new firms that intensively rely on more educated workers) on net changes in employment at both the economy and the industry levels.
We show that new knowledge-based firms (KBF) differentiate themselves from other incumbent firms (new or not new) by having a positive direct contribution on net employment growth (whereas most groups of incumbents contribute negatively to changes in employment in subsequent years). There are two main mechanisms underlying this distinctive feature of new KBF: on one hand, the proportion of new KBFs that expand in number of employees over the years is higher than that over other firms (including new ones); on the other hand, the incidence of failure is lower among new KBFs.
Notwithstanding this distinctive performance of new KBFs, their direct impact on net employment growth is rather small, for two reasons: first, although KBFs tend to add jobs to the existing ones in net terms, the number of additional jobs for each employer in the base year tends to be quite modest; secondly, the share of new KBFs in overall employment is marginal.
These results show some variability across industries, as a result of both the knowledge-intensity and the rate of turbulence of each industry. In any case, only in a few industries can new KBF be said to make a difference in net employment growth (among which stand out some knowledge-intensive services).
The results above mentioned were obtained using descriptive methods. Future work on this topic should complement such analysis with a multivariate framework.
17
DINÂMIA’CET – IUL, Centro de Estudos sobre a Mudança Socioeconómica e o TerritórioISCTE-IUL – Av. das Forças Armadas, 1649-026 Lisboa, PORTUGAL
Tel. 210464031 - Extensão 293100 E-mail: dinamia@iscte.pt www.dinamiacet.iscte.pt
6. REFERENCES
Alvesson, M. (2000), “Social identity and the problem of loyalty in knowledge-intensive companies”, Journal of Management Studies, 37 (8), 1101–1122.
Carlsson B.O.; Zoltan J.; Audretsch D.B.; Braunerhjelm P. (2007), “The Knowledge Filter, Entrepreneurship, and Economic Growth”, Jena Economic Research Paper No 2007-057. Carree, M.A.; Thurik, A.R. (2011), “The Impact of Entrepreneurship on Economic Growth”. In Z.J. Acs, D.B. Audretsch (eds.), Handbook of Entrepreneurship Research (2nd Edition), Ch. 20. New York: Springer Science+Business Media.
Ditillo, A. (2004), “Dealing with uncertainty in knowledge-intensive firms: the role of management control systems as knowledge integration mechanisms”, Accounting, Organizations and Society, 29, pp. 401-421.
Fagerber, J. (1994), “Technology and International Differences in Growth Rates”, Journal of Economic Literature 32(3), September, pp.1147-75.
Fritsch, M., & Mueller, P. (2004), “The effects of new business formation on regional development over time”, Regional Studies, 38, pp. 961–975.
Geroski, P. A. (1995), “What do we know about entry?”, International Journal of Industrial Organization, 13, pp. 421–440.
Lee, S.-H. (1999), “Taxonomy of HRM policies of knowledge-based firms: A resource-based explanation’, International Journal of Innovation Management, 3 (4), pp.379-395.
Lucas, R. E. (1988), “On the mechanics of economic development”, Journal of Monetary Economics, 22, pp.3–42.
Mueller, P. (2007), “Exploiting entrepreneurial opportunities: The impact of entrepreneurship on growth”, Small Business Economics, 28, pp.355–362.
Nelson, R.R. (1996) , The sources of economic growth, Cambridge, MA: Harvard University Press.
Nelson, R. R.; Winter, S. G. (1982), An evolutionary theory of economic change, Cambridge, MA: Belknap Press of Harvard University Press.
18
DINÂMIA’CET – IUL, Centro de Estudos sobre a Mudança Socioeconómica e o TerritórioISCTE-IUL – Av. das Forças Armadas, 1649-026 Lisboa, PORTUGAL
Tel. 210464031 - Extensão 293100 E-mail: dinamia@iscte.pt www.dinamiacet.iscte.pt
Romer, P. M. (1986), “Increasing return and long-run growth”, Journal of Political Economy, 94, p.p. 1002–1037.
Romer, P. M. (1990), “Endogenous technological change”, Journal of Political Economy, 98, p.p.71–101.
Van Praag, M.; Versloot, P. (2007), “What is the value of entrepreneurship? A review of recent research”, Small Business Economics, 29, p.p. 351–382.
19
DINÂMIA’CET – IUL, Centro de Estudos sobre a Mudança Socioeconómica e o TerritórioISCTE-IUL – Av. das Forças Armadas, 1649-026 Lisboa, PORTUGAL
Tel. 210464031 - Extensão 293100 E-mail: dinamia@iscte.pt www.dinamiacet.iscte.pt
7. METHODOLOGICAL ANNEX
The source of the data used for this study is the ‘Quadros de Pessoal’ (QP henceforth) database, which compiles information on workers (employers and employees) and firms, collected on a yearly basis by the Portuguese Ministry of Social Solidarity. The survey that supports this database is conducted every year and is compulsory for all firms that employ paid labour in Portugal. Both firms and workers are identified by their social security numbers, which allows for longitudinal analyses. This feature of the QP database makes it an extremely valuable source of data for conducting analysis of both industry and labour market dynamics. However, some data cleansing and methodological decisions taken to be made in order to prepare the data for analysis. In what follows we summarize the main steps which were taken in the preparation of the data for the purpose of this study.
1. Data on workers’ characteristics were not collected in 2001, and this constitutes a problem since we use information on workers’ skills to classify firms in terms of ‘knowledge-baseness’. To account for this limitation, the gaps in 2001 were filled with average values of previous and subsequent years (when available).
2. As a general rule, the first year a firm was registered in QP is considered the year of entry. However, it may be the case that a change in legal status leads to a new registry in QP, even though the new administrative entity is not functionally distinct from the old one. To avoid introducing false information about job destruction and job creation in the database, we compared the year of the first registry with the year of constitution as reported directly by the firms – only accepting the former one as the valid entry date when it does not differ from the latter by more than two years. When this is not the case, the firms were re-classified as ‘old firms’ in the corresponding year.
3. The longitudinal data on firms has registration gaps. This may be due to some kind of registration error, or to firms’ irregular reporting. We decided to exclude from the database firms with gaps, after checking this would not introduce any significant bias in the analysis.
4. As mentioned above, the annual reporting is compulsory for all firms employing paid labour. However, for very small family businesses or single-person firms it is rather arbitrary to register or not some of the family members, or the single person, as an employee. Thus, we decided to exclude from the analysis all the firms that never had more than one employee over time.
5. We decided to focus the analysis on essentially market-oriented manufacturing industries and services (excluding, therefore, agriculture, fisheries, and social and personal services).
20
DINÂMIA’CET – IUL, Centro de Estudos sobre a Mudança Socioeconómica e o TerritórioISCTE-IUL – Av. das Forças Armadas, 1649-026 Lisboa, PORTUGAL
Tel. 210464031 - Extensão 293100 E-mail: dinamia@iscte.pt www.dinamiacet.iscte.pt
Furthermore, we have excluded industries for which the total number of employees declared by firms in QP over the years differs substantially from the main official source (i.e., the National Institute of Statistics). The excluded industries are (using NACE Rev.1.1 at two or three digits levels): 01 and 02 - Agriculture, hunting and forestry; 05 - Fishing; 10 to 14 - Mining and quarrying; 23 - Manufacture of coke, refined petroleum products and nuclear fuel; 27 and 28 - Manufacture of basic metals and fabricated metal products; 29 - Manufacture of machinery and equipment n.e.c.; 30 - Manufacture of office machinery and computers; 35 - Manufacture of other transport equipment; 40 and 41 - Electricity, gas and water supply; 50 - Sale, maintenance and repair of motor vehicles and motorcycles; retail sale of automotive fuel; 51 - Wholesale trade and commission trade, except of motor vehicles and motorcycles; 70 - Real estate activities; 71 - Renting of machinery and equipment without operator and of personal and household goods; 745 - Labour recruitment and provision of personnel; 75 - Public administration and defence; compulsory social security; 80 - Education services; 85 - Health and social work; 90 to 93 Other community, social and personal service activities; 95 to 97 - Activities of households; 99 - Extra-territorial organizations and bodies.