QTL affecting body weight in a candidate region of cattle chromosome 5
Mariana B.B. Machado
1, Maurício M. Alencar
2, Andréa P. Pereira
1, Henrique N. Oliveira
3,
Eduardo Casas
4, Luis L. Coutinho
5and Luciana C.A. Regitano
21
Universidade Federal de São Carlos, Departamento de Genética e Evolução, São Carlos, SP, Brasil.
2
Embrapa Pecuária Sudeste, São Carlos, SP, Brasil.
3
Universidade Estadual de São Paulo, Departamento de Reprodução e Nutrição Animal,
Botucatu, SP, Brasil.
4
U.S. Meat Animal Research Center, ARS, USDA, Clay Center, NE, USA.
5
Universidade de São Paulo, Departamento de Produção Animal, Piracicaba, SP, Brasil.
Abstract
The objective of this work was to identify QTLs for liveweight in a candidate region of bovine chromosome 5. Half-sib families from two lines, one traditional and the other new, of Canchim beef cattle (5/8 Charolais + 3/8 Zebu) were genotyped for four microsatellite markers, including the microsatellite in the IGF-1 (insulin-like growth factor-1) promoter region. Significant differences in allele distribution between the two lines were found for three markers. Interval mapping analyses in this region indicated the presence of a QTL controlling birth weight (p < 0.05) and of a QTL influencing breeding value for yearling weight (p < 0.01) in the newer line of the breed. The previously identified interaction between the IGF-1 genotype and genetic group strengthens the hypothesis of a linked QTL rather than an IGF-1 effect on growth traits in the Canchim cattle.
Key words:QTL, growth traits, microsatellite, bovine.
Received: November 7, 2002; Accepted: May 30, 2003.
Introduction
Crosses between cattle breeds exploit
complementarity and the benefits of heterosis to allow the formation of new breeds with suitable traits for a particular environment. In Brazil, the Canchim breed combines the precocity and productivity of Charolais beef cattle with the rusticity and adaptability to the tropics of Zebu cattle, and has been used for meat production since its formation in the 1950s. This breed is an important alternative for low-to-moderate input beef cattle production systems in the trop-ics.
Liveweight at different ages is a good selection crite-rion for growth in beef cattle. A set of loci with small indi-vidual effects known as quantitative traits loci, or QTLs, control these traits and may have pleiotropic effects on the variation in carcass composition and meat quality that can-not be measured before slaughter of the animal. The recent development of polymorphic markers and bovine linkage maps (Bishop et al., 1994; Barendse et al., 1994, 1997;
Kappeset al., 1997) has made the detection of QTLs that
affect commercially relevant traits possible. The combined use of marker-QTL linkage and breeding values can signif-icantly increase the efficiency of animal selection, and thereby increase the genetic progress in a given period of time.
Bovine chromosome 5 harbors QTLs that influence milk production (Kalm et al., 1998), reproductivon (Kirkpatricket al.,2000; Kappeset al.,2000; Lienet al.,
2000) and growth and carcass traits (Moodyet al.,1996; Daviset al.,1998; Stone et al.,1999; Casaset al.,2000, 2002; Pereira, 2002; Liet al., 2002). The location of some of these QTLs approaches the position of the IGF-1 (insu-lin-like growth factor) gene and, since IGF-1 plays a funda-mental role in regulation growth and development, this gene is considered a strong candidate for the QTL effect. However, several other genes known to affect tissue growth and differentiation lie near the same region and could also be considered potential candidates.
In this work, we used interval mapping in a region of chromosome 5 to demonstrate the presence of QTLs that control liveweight in Canchim beef cattle.
www.sbg.org.br
Send correspondence to Luciana Correia de Almeida Regitano. Embrapa Pecuária Sudeste, Caixa Postal 339, 13560-970 São Carlos, SP, Brazil. E-mail: [email protected].
Material and Methods
Animals
Paternal half-sib families from two Canchim lines were analyzed. The traditional line was formed through al-ternate crosses of Charolais with Guzerat, Nellore and Indubrazil (Bos indicus) breeds, mainly the latter one.
These crosses were started in 1940. The first Canchim (5/8 Charolais + 3/8 Zebu; 62.5% Charolais + 37.5% Zebu) calves, the result of mating two 5/8 Charolais + 3/8 Zebu animals, were born in 1953. This line has been maintained as a closed line since its formation. Fifteen paternal half-sib families (307 offspring) of this line constituted genetic group 1 (GG1) in this study. In 1986, a new Canchim line was started by mating Canchim bulls to Nellore cows, then inseminating the crossbred Canchim-Nellore cows with se-men from Charolais bulls, followed by mating of the 1/2 Charolais + 1/4 Canchim + 1/4 Nellore animals amongst themselves to produce Canchim animals that were approxi-mately 65.7% Charolais + 34.3% Nellore. Ten sire proge-nies (378 animals) of this new Canchim line constituted the genetic group 2 (GG2) in this study. All of the animals be-longed to the Canchim herd at the Embrapa Southeastern Cattle Research Center in São Carlos, SP, and were kept in pasture with mineral supplementation.
Phenotypic measurements
Records of birth (BW), weaning (WW) and yearling (YW) weight, as well as their respective breeding values, were analyzed. Prior to statistical analysis, weaning and yearling weights were adjusted to 240 and 365 days of age using the average daily gains from birth to weaning and from weaning to yearling, respectively. Breeding values for birth, weaning and yearling weights were obtained by the derivative-free restricted maximum likelihood method, us-ing an animal model that included the fixed effects of con-temporary group (year of birth, season of birth, sex of calf) and the random additive direct effect, the additive maternal effect, and the maternal permanent environmental effect. All measurements were supplied by the Canchim breeding program of the Embrapa Southeastern Cattle Research Center.
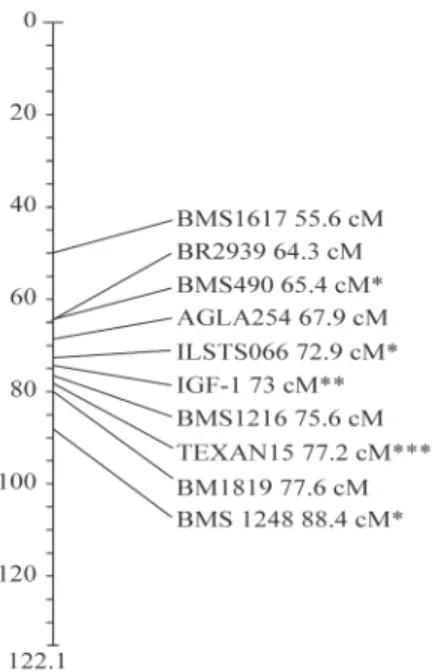
DNA extraction and heterozygosity of the sires: Sire DNA was extracted from semen as described by Regitano (2001). DNA was amplified for ten microsatellite loci on bovine chromosome 5 adjacent to the IGF-1 gene. The microsatellites tested and their position in the map are shown in Figure 1. The primers,amplification conditions
and other marker information were obtained from the website http://marc.usda.gov, with the exception of micro-satellite TEXAN15, which was described in Burnset al.
(1995). The amplified products were separated by electro-phoresis in 8% non-denaturing polyacrylamide gels at 45 W for 3 or 4 h, depending on the expected allele sizes. The gels were silver stained (Cominciniet al.,1995), and
the allele sizes were estimated by comparison to a 10 bp ladder of molecular weight markers. Microsatellite loci that did not show a satisfactory pattern of amplification or which were uninformative for too many sires were ex-cluded from the analyses. The remaining microsatellite loci (ILST066, IGF-1, TEXAN15, and BMS1248) were used for the analysis.
DNA extraction and progeny genotyping
Progeny DNA was extracted from blood samples as described in Regitano (2001). Microsatellitelociwere
am-plified from 100 ng of DNA in a reaction volume of 12.5µL
containing 50 mM KCl, 1.5 mM MgCl2, 10 mM Tris-HCl
pH 8.4, 0.2µM of each dNTP, 0.5 units ofTaqDNA
poly-merase and 0.4µM of each primer for ILSTS066, IGF-1
and TEXAN15, and 0.2µM of each primer for BMS1248.
rescence DNA Sequencer (A.L.F., Amersham Biosci-ences). The results were analyzed using the software Allele Locator (Amersham- Biosciences). Allele sizes were calcu-lated using 50-to 500-base-pair external standards and a 100-base-pair internal standard. Microsatellite IGF-1 was analyzed by electrophoresis in 8% non-denaturing polyacrylamide gels at 45 W for 4 h and 30 min and silver stained.
Statistical analyses
Allele frequencies and variances:Allele frequencies
were calculated for the entire sample and for each genetic group, according to Weir (1996), and were compared using a probability test for contingency tables (Raymond and Rousset, 1995a). The equilibrium probability associated to the genotypic frequencies observed was obtained by an ex-act test for the null hypothesis (H0) of random union of
ga-metes (Guo and Thompson, 1992) using the software Genepop (Raymond and Rousset, 1995b). Heterozygosity coefficients were estimated for each marker in the entire sample and in each genetic group. Average coefficients were calculated for each sample in order to assess their ge-netic variability.
Interval mapping:These analyses were done with the
software QTL express through the site http://qtl.cap.ed. ac.uk/ (Seatonet al., 2001), using the interval mapping for
multiple markers in half-sib families, as described by Knott
et al.(1996). A regression model included phenotypic data
and the conditional probability of inheriting the gamete from the sire. The effects of sex, month and year of birth were included in the model for the analysis of birth, wean-ing and yearlwean-ing weight. The age of the cow at calvwean-ing was included as a covariate. These effects were not considered when analyzing breeding values for the traits. An F test ra-tio was calculated to test the presence of a QTL at 1 cM in-tervals. Significance thresholds were obtained through the permutation test (Churchill and Doerge, 1994). The empiri-cal confidence interval for the QTL location was estimated by a bootstrap procedure (Visscheret al., 1996).
Results
Genotypic analysis of sires
This analysis was done to select markers adjacent to the IGF-1 gene that were informative in the largest number of sires, that did not yield spurious bands, and that allowed an appropriate coverage of the chromosomal segment. Microsatellites ILSTS066, TEXAN15, BMS1248 and the microsatellite in the IGF-1 promoter region (Kirkpatrick, 1992) were selected among the markers tested (Figure 1), and the analysis was limited to an interval of 15.5 cM.
Population parameters
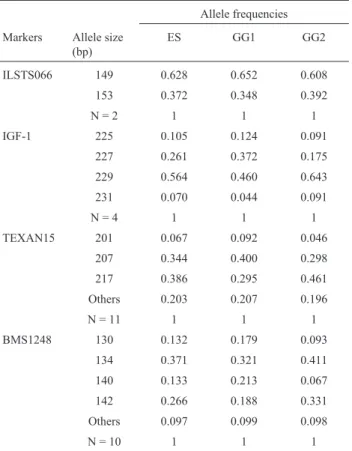
Table 1 shows the allele frequencies for micro-satellites ILSTS066, IGF-1, TEXAN15 and BMS1248 in the entire sample and for the genetic groups. Two alleles of
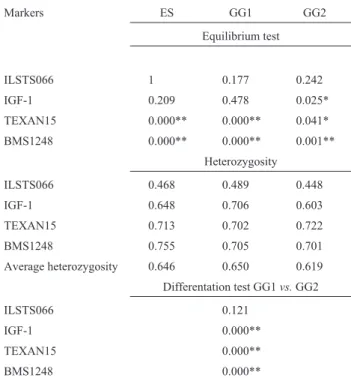
the microsatellite ILSTS066, four alleles of IGF-1 and ten alleles of the microsatellite BMS1248 were detected in both genetic groups. Ten alleles of the microsatellite TEXAN15 were detected in genetic group 1 and 11 in ge-netic group 2. The p-values for the equilibrium test and heterozygosity coefficients for the entire sample and within the genetic groups, the average heterozygosity of thelociin
each sample and the p-values for the comparison of allele frequencies between genetic groups are given in Table 2. The allele frequency distribution for the marker ILSTS066 did not differ significantly between the genetic groups, whereas IGF-1, TEXAN15 and BMS1248 loci showed highly significant differences in allele distribution. As ex-pected, the heterozygosity value for ILSTS066 was lower than for IGF-1, TEXAN15 and BMS1248, which are multiallelic loci. The distribution of the genotypic frequen-cies for the ILSTS066 locus showed that the samples stud-ied were in Hardy-Weinberg equilibrium. However, genotypic disequilibrium was verified for the markers IGF-1, TEXAN15 and BMS1248.
QTL mapping
Although previous work suggested an effect of IGF-1 polymorphism on birth and yearling weight in this sample (Pereira, 2002), interval analysis of the complete data set Table 1 - Allele frequencies for ILSTS066, IGF-1, TEXAN15 and BMS1248 in the entire sample and within genetic groups.
Allele frequencies
Markers Allele size (bp)
ES GG1 GG2
ILSTS066 149 0.628 0.652 0.608
153 0.372 0.348 0.392
N = 2 1 1 1
IGF-1 225 0.105 0.124 0.091
227 0.261 0.372 0.175
229 0.564 0.460 0.643
231 0.070 0.044 0.091
N = 4 1 1 1
TEXAN15 201 0.067 0.092 0.046
207 0.344 0.400 0.298
217 0.386 0.295 0.461
Others 0.203 0.207 0.196
N = 11 1 1 1
BMS1248 130 0.132 0.179 0.093
134 0.371 0.321 0.411
140 0.133 0.213 0.067
142 0.266 0.188 0.331
Others 0.097 0.099 0.098
N = 10 1 1 1
did not indicate the presence of a QTL for these traits. Since significant differences in the effect of IGF-1 on growth traits in the two Canchim genetic groups were reported by Pereira (2002), a second interval analysis was done within each genetic group. This analysis detected the presence of a QTL affecting birth weight (p < 0.05) and a QTL control-ling yearcontrol-ling weight in genetic group 2, but not in group 1. The interval analyzed included 15.5 cM, which contained the markers ILSTS066, TEXAN15, BMS1248 and the microsatellite on the IGF-1 gene. The maximum F-statistic value was detected at 82.9 cM, between markers TEXAN15 and BMS1248 (Figure 2). A QTL influencing the breeding value for yearling weight (p < 0.01) was de-tected at 72.9 cM over the ILSTS066 locus (Figure 3). The empirical confidence interval for the location of QTLs was 15 cM. No QTLs were detected for weaning or yearling weight, or for the breeding values for birth and weaning weights.
Discussion
Population parameters
Allele frequency distributions for TEXAN15 and BMS1248 differed significantly among the genetic groups. These differences may have resulted from a combination of factors such as selection pressure, different frequencies in the founder animals and random genetic drift. In the case of
the Canchim lines, the crosses used for their formation can explain the differences in genetic composition. Genetic group 1 (GG1) was formed in the 1950s by crosses between Charolais and a pool ofBos indicusbreeds, and has been maintained closed since then. Genetic group 2 (GG2) was formed through crosses between Canchim, Nellore and Charolais in the 1980s in a system proposed to obtain Canchim. During the 30 years between the production of GG1 and GG2, Nellore, Charolais and Canchim breeds were intensively selected and improved by breeders. Thus, variations in the founder genetic composition could ac-count for the differences seen among the genetic groups. Differences in genetic composition among lines are impor-tant for QTL detection studies, since a QTL influencing a Figure 2- F-statistic profile for body weight in the analyzed interval of
15.5 cM. The upper horizontal line represents a significance level of 0.01 and the lower represents a significance level of 0.05 (F-statistic = 2.25 at 82.9 cM). Arrowheads under the X-axis indicate the relative position of the markers on the chromosome, beginning at the centromeric extremity. From left to right: ILSTS066 (72.9 cM), IGF-1 (73 cM), TEXAN15 (77.2cM) and BMS1248 (88.4cM).
Table 2- P-values for the equilibrium test, heterozygosity coefficients for the entire sample and within genetic groups, average heterozygosity for the loci in each sample, and P-values for differentiation test between genetic groups.
Markers ES GG1 GG2
Equilibrium test
ILSTS066 1 0.177 0.242
IGF-1 0.209 0.478 0.025*
TEXAN15 0.000** 0.000** 0.041*
BMS1248 0.000** 0.000** 0.001**
Heterozygosity
ILSTS066 0.468 0.489 0.448
IGF-1 0.648 0.706 0.603
TEXAN15 0.713 0.702 0.722
BMS1248 0.755 0.705 0.701
Average heterozygosity 0.646 0.650 0.619
Differentation test GG1vs.GG2
ILSTS066 0.121
IGF-1 0.000**
TEXAN15 0.000**
BMS1248 0.000**
ES, entire sample; GG1, genetic group 1; GG2, genetic group 2; *p < 0.05 and **p < 0.01.
characteristic in a certain population can have a different effect in another, because of epistatic interactions of QTL with the genetic background, or even no effect at all, de-pending on the presence of segregation at the QTL.
The observed average heterozygosities were greater than those reported by Tambasco (1998) for Nellore cattle and by Tambasco-Studart (2001) for Simmental cattle, thus reflecting greater genetic variability in synthetic breeds compared to pure ones. The mean heterozygosity values observed by Regitano (1997) in successive generations of the Canchim breed, using only microsatellite markers, were close to the those obtained here, indicating that despite the selection practiced across generations the genetic variabil-ity of the breed was maintained.
The genotypic disequilibrium observed for loci
IGF-1, TEXAN15 and BMS1248 could have resulted from several events such as drift, the presence of null alleles, or linkage of these markers to QTLs under selection pressure. Marker TEXAN15 is located at 4.2 cM of candidate gene IGF-1 and marker BMS1248 at 15.4 cM. QTLs influencing growth and other traits have been reported in this interval (Moodyet al.,1996; Daviset al.,1998; Stoneet al.,1999;
Casaset al.,2000; Pereira, 2002). Deviations in the allelic
frequencies of microsatellite TEXAN15 were reported in a Nellore population selected for weight, suggesting its asso-ciation with a QTL affecting this trait (Merzelet al.,1998).
The distortion seen in the genotypic distribution of these three markers in the present work provides further evidence for the presence of a QTL in this chromosomal region. A strongest disequilibrium was found for the locus BMS1248, which agrees with the results for the QTL map-ping of body weight discussed below.
QTL Mapping
The interval mapping results provided significant evi-dence for a QTL affecting birth weight at approximately 82.9 cM from the most centromeric marker, a distance of 9.9 cM from the IGF-1 locus (73 cM). Another QTL affect-ing breedaffect-ing value for yearlaffect-ing weight mapped at 72.9 cM over ILSTS066 locus, a distance of 0.1 cM from the IGF-1 locus. In the latter case, the curve shape suggested a QTL location beyond the interval analyzed, towards the centromeric end. This QTL was therefore not considered significant and needs to be investigated further.
The effect of this chromosome 5 region on growth and carcass traits have been reported. A QTL for birth weight was detected in the 70 to 110 cM interval by Davis
et al.(1998) in a crossbred population. QTLs controlling
carcass traits were found by Stone et al. (1999) in Bos taurusxBos indicusprogenies and by Casaset al. (2000) in
families segregating alternative forms of the myostatin gene. Casaset al. (2002) found significant QTLs for birth
weight, muscular development and a suggestive QTL for marbling in crossbred progeny. Liet al. (2002) detected
QTLs for birth weight at 20 to 30 cM and 65 to 75 cM inter-vals in aBos taurusbreed. An association between IGF-1
and weights was detected by Moodyet al.(1996) in
Here-ford cattle and by Pereira (2002) for birth weight and year-ling weight in the same Canchim samples investigated here. An association between IGF-1 and growth was reported in swine by Casas-Carrilloet al.(1997) and in mice by Horvat
and Medrano (1995). This region of BTA5 is syntenic to a region of mouse chromosome 10 that contains the IGF-1 gene and the high growth (hg) locus, where a deletion
causes the high growth phenotype. However, this deletion does not include the IGF-1 gene (Horvat and Medrano, 1995). According to Horvat and Medrano (2001), the mo-lecular cause of overgrowth in mice is lack of the suppres-sor of cytokine signaling 2 (Socs2), mapped to the hg
region. A Socs2 deficiency affects growth prenatally and postnatally, most likely by deregulating the GH/IGF1 axis. QTLs controlling early and late growth in mice were de-tected by Cheverud (2002) with the late growth region in-cluding the IGF-1 gene. According to Casaset al.(2000),
further studies are needed to determine whether the same gene or genes are involved in the expression of these traits in other species.
Acknowledgments
The authors thank Andrea S. de Barros for technical support in the laboratory. This work was supported by FAPESP and Embrapa. M.B.B. Machado was the recipient of a scholarship from CNPq.
References
Barendse W, Armitage SM, Kossarek LM, Shalom A, Kirkpatrick BW, Ryan AM, Clayton Det al.(1994) A genetic linkage
map of the bovine genome. Nat Genet 6:227-235.
Barendse W, Vaiman D, Kemp SJ, Sugimoto Y, Armitage SM, Williams JL, Sun HSet al.(1997) A medim-density genetic linkage map of the bovine genome. Mamm Genome 8:29-36.
Bishop MD, Kappes SM, Keele JW, Stone RT, Sunden SLF, Hawkins GA, Solinas Toldo, S.et al.(1994) A genetic
link-age map for cattle. Genetics 136:619-639.
Burns BM, Taylor JF, Herring KL, Herring GAD, Holder MT, Collins JS, Guerra TMet al.(1995) Bovine microsatellite dinucleotide repeat polymorphisms at the TEXAN11, TEXAN12, TEXAN13, TEXAN14 and TEXAN15 loci. Anim Genet 26:201-202.
Casas E, Keele JW, Shackelford SD, Stone RT and Koohmaraie M (2002) Quantitative trait loci for birth weight, longissimus muscle area, and marbling on bovine chromo-some 5. 28thInternational Conference on Animal Genetics,
Guttingen, Germany. Abstracts, International Society for Animal Genetics, p 163.
Casas E, Shackelford SD, Keele JW, Stone RT, Kappes SM and Koohmaraie M (2000) Quantitative trait loci affecting growth and carcass composition of cattle segregating alter-nate forms of myostatin. J Anim Sci 78:560-569.
Casas-Carrillo EP, Prill-Adams, A, Price SG, Clutter AC and Kirkpatrick B (1997) Relationship of growth hormone and insulin-like growth factor-1 genotypes with growth and car-cass traits in swine. Anim Genet 28:88-93.
Cheverud JM (2002) Quantitative trait loci affecting postnatal growth in mice. Proceedings 7thWorld Congress on
Genet-ics Applied to Livestock Production, Montpellier, France. Papers on CD-ROM. Session 15 on Developmental Genet-ics N 15-01.
Churchill GA and Doerge RW (1994) Empirical threshold values for quantitative trait mapping. Genetics 138:963-971. Comincini S, Leone P and Redaelli L (1995) Characterization of
bovine microsatellites by silver staining. J Anim Breed Genet 112:415-420.
Davis SK, Hetzel DJS, Corbet NJ, Scacheri S, Lowden S, Renaud J, Mayne Cet al.(1998) The mapping of quantitative trait loci for birth weight in a tropical beef herd. Proceedings 6th
World Congress on Genetics Applied to Livestock Produc-tion, Armidale, Australia. Papers 26:441-444.
Guo SW and Thompson EA (1992) Permorming the Exact Test of Hardy-Weinberg Proportion for Multiple Alleles. Biometrics 48:361-372.
Horvat S and Medrano F (1995) Interval mapping of high growth (hg), a major locus that increases weight gain in mice. Ge-netics 139:1737-1748.
Horvat S and Medrano F (2001) Lack of Socs2 expression causes the high-growth phenotype in mice. Genomics 72:209-212.
Casas E, Shackelford SD, Keele JW, Stone RT, Kappes SM and Koohmaraie M (2000) Quantitative trait loci affecting growth and carcass composition of cattle segregating alter-nate forms of myostatin. J Anim Sci 78:560-569.
Kalm E, Reinsch N, Xu N, Thomsen H, Looft C, Grupe S, Brockmann G, Kuehn Cet al.(1998) Mapping quantitative
trait loci on cattle chromosome 2, 5, 10, 16, 18 and 23. Anim Genet 29 (suppl.1):62.
Kappes SM, Bennett JW, Echternkamp SE, Gregory KE and Thallman RM (2000) Initial results of genomic scans for ovulation rate in a cattle population selected for increased twinning rate. J Anim Sci 78:3053-3059.
Kappes SM, Keele JW, Stone RT, McGraw RA, Sonstegard TS, Smith TP, Lopez-Corrales NL, Beattie CW (1997) A sec-ond-generation linkage map of the bovine genome. Genome Res 7:235-249.
Kirkpatrick BW (1992) Identification of a conserved micro-satellite site in the porcine and bovine insulin-like growth factor-I gene 5’ flank. Anim Genet 23:543-548.
Kirkpatrick, BW, Becky MB and Gregory KE (2000) Mapping quantitative trait loci for bovine ovulation rate. Mamm Ge-nome 11:136-139.
Knott SA, Elsen JM and Haley CS (1996) Methods for multi-ple-marker mapping of quantitative trait loci in half-sib pop-ulations. Theor Appl Genet 93:71-80.
Lander ES and Kruglyak L (1995) Genetic dissection of complex traits: guidelines for interpreting and reporting linkage re-sults. Nat Genet 11:241-247.
Li C, Basarab J, Snelling WM, Benkel B, Murdoch B, Kneelan J, Hansen C and Moore SS (2002) Identical by descent haplo-type sharing analysis: application in fine mapping of QTLs for birth weight in commercial lines ofBos taurus.
Proceed-ings 7thWorld Congress on Genetics Applied to Livestock
Production, Montpellier, France. Papers1 CD-ROM. Ses-sion 2 on Breeding ruminants for meat production. N 02-12. Lien S, Karlsen A, Klemetsdal G, Vage DI, Olsaker I, Kungland
H, Aasland Met al.(2000) A primary screen of the bovine
genome for quantitative trait loci affecting twinning rate. Mamm Genome 11:877-882.
Martinez ML (2001) Métodos estatísticos para a detecção de locos de características quantitativas. In: Regitano LCA and Cou-tinho LL (eds) Biologia Molecular Aplicada à Produção An-imal. Embrapa Informação Tecnológica, Brasília, pp 79-102.
Merzel M, Etchegaray MAL, Silva NA, Packer IU, Razook AG, Figueiredo, LA, Vencovsky R and Coutinho LL (1998) Changes in allelic frequency of eight microsatellites in a Nellore herd selected for weight gain. Anais do 44o
Congres-so Nacional de Genética. Sociedade Brasileira de Genética, Águas de Lindóia, SP, Brasil, 1998, p 91.
Moody DE, Pomp D, Newman S and McNeil MD (1996) Charac-terization of DNA polymorphisms in three populations of Hereford cattle and their associations with growth and ma-ternal EPD in line 1 Herefords. J Anim Sci 74:1784-1793. Pereira AP (2002) Avaliação da influência dos genótipos de GH e
IGF-1 no desempenho de bovinos da raça Canchim. MSc Dissertation, Universidade Federal de São Carlos, São Car-los, SP.
Raymond M and Rousset F (1995b) GENEPOP (version 1.2): a population genetics software for exact tests and ecumenicism. J Heredity 86:248-249, July 1995.
Regitano LCA (1997) Polimorfismo molecular em gerações de bovinos da raça Canchim. PhD Thesis, Escola Superior de Agricultura “Luiz de Queiroz”, Universidade de São Paulo, Piracicaba, SP.
Regitano LCA (2001) Extração de DNA para aplicação em reação de cadeia da polimerase. In: Regitano LCA and Coutinho LL (eds) Biologia Molecular Aplicada à Produção Animal. Embrapa Informação Tecnológica, Brasília, pp 179-186. Seaton G, Haley CS, Knott SA, Kearsey M and Visscher PM
(2001) QTL express: http://qtl.cap.ed.ac.uk.
Stone RT, Keele JW, Shackelford SD, Kappes SM and Koohmaraie M (1999) A primary screen of the bovine ge-nome for quantitative trait loci affecting carcass and growth traits. J Anim Sci 77:1379-1384.
Tambasco DD (1998) Similaridade genética multilocos entre parentais de bovinos e correlação com peso ao nascimento da progênie. MSc Dissertation, Universidade Federal de São Carlos, São Carlos, SP.
Tambasco-Studart MT (2001) Caracterização molecular de bovi-nos da raça Simmental com base em microssatélites e RFLPs. MSc Disertation, Universidade Federal de São Carlos. São Carlos, SP.
Visscher PM, Thompson R and Haley CS (1996) Confidence in-tervals in QTL mapping by bootstrapping. Genetics 143:1013-1020.
Weir BS (1996) Genetic Data Analysis: Methods for Discrete Population Genetic Data. 2nd ed. Sinauer Associates, Sunderland, MA 445 pp.