Executive Board
Alberto Sayão Ian Schumann Martins
Pontifical Catholic University of Rio de Janeiro, Brazil Federal University of Rio de Janeiro, Brazil
Jorge Almeida e Sousa João Maranha
University of Coimbra, Portugal LNEC, Portugal
Associate Editors
H. Einstein E. Maranha das Neves Harry G. Poulos
MIT, USA Lisbon Technical University, Portugal University of Sidney, Australia
John A. Hudson Nielen van der Merve Niek Rengers
Imperial College, UK University of Pretoria, South Africa ITC, The Netherlands
Kenji Ishihara Paul Marinos Fumio Tatsuoka
University of Tokyo, Japan NTUA, Greece Tokyo University of Science, Japan
Michele Jamiolkowski James K. Mitchell Luiz González de Vallejo
Studio Geotecnico Italiano, Italy Virginia Tech., USA UCM, Spain
Willy A. Lacerda Lars Persson Roger Frank
COPPE/UFRJ, Brazil SGU, Sweden ENPC-Cermes, France
Editorial Board Members
Roberto F. Azevedo Orencio Monje Vilar R. Jonathan Fannin
Federal University of Viçosa, Brazil University of São Paulo at São Carlos, Brazil University of British Columbia, Canada
Milton Kanji Maria Eugenia Boscov Laura Caldeira
University of São Paulo, Brazil University of São Paulo, Brazil LNEC, Portugal
Antonio M.S. Oliveira Vinod Garga António S. Cardoso
University of Guarulhos, Brazil University of Ottawa, Canada University of Porto, Portugal
Omar Y. Bitar Richard J. Bathurst José D. Rodrigues
IPT, Brazil Royal Military College of Canada Consultant, Portugal
Lázaro V. Zuquette Robert Mair António G. Coelho
University of São Paulo, Brazil University of Cambridge, UK Consultant, Portugal
Fabio Taioli Serge Leroueil Luís R. Sousa
University of São Paulo, Brazil University of Laval, Canada University of Porto, Portugal
Tarcisio Celestino Mario Manassero Rui M. Correia
University of São Paulo-SC, Brazil Politécnico di Torino, Italy LNEC, Portugal
Roberto Q. Coutinho Luis Valenzuela João Marcelino
Federal Univ. of Pernambuco, Brazil Consultant, Chile LNEC, Portugal
Nilo C. Consoli Jorge G. Zornberg António C. Mineiro
Federal Univ. Rio Grande do Sul, Brazil University of Texas/Austin, USA University of Lisbon, Portugal
Sandro S. Sandroni Andrew Whittle António P. Cunha
Consultant, Brazil MIT, USA LNEC, Portugal New
Sérgio A.B. Fontoura Pierre Bérest António G. Correia
Pontifical Catholic University, Brazil LCPC, France University of Minho, Portugal
Ennio M. Palmeira Peter Kaiser Carlos D. Gama
University of Brasilia, Brazil Laurentian University, Canada Lisbon Technical University, Portugal
Luciano Décourt He Manchao José V. Lemos
Consultant, Brazil CUMT, China LNEC, Portugal
Faiçal Massad Teruo Nakai Nuno Grossmann
University of São Paulo, Brazil Nagoya Inst. Technology, Japan LNEC, Portugal
Marcus Pacheco Claudio Olalla Luís L. Lemos
University of the State of Rio de Janeiro, Brazil CEDEX, Spain University of Coimbra, Portugal
Paulo Maia Frederick Baynes Ricardo Oliveira
University of Northern Rio de Janeiro, Brazil Baynes Geologic Ltd., Australia COBA, Portugal
Renato Cunha R. Kerry Rowe
University of Brasília, Brazil Queen’s University, Canada
Editor Waldemar Coelho Hachich -
University of São Paulo, BrazilCo-editor Manuel Matos Fernandes -
University of Porto, PortugalSpecial Issue: In Situ Testing for Ground Characterization
Guest-editors: Roberto Quental Coutinho -
Universidade Federal de Pernambuco, BrazilSoils and Rocks 1978, 1 (1, 2) 1979, 1 (3), 2 (1,2) 1980-1983, 3-6 (1, 2, 3) 1984, 7 (single number) 1985-1987, 8-10 (1, 2, 3) 1988-1990, 11-13 (single number) 1991-1992, 14-15 (1, 2) 1993, 16 (1, 2, 3, 4) 1994-2010, 17-33 (1, 2, 3) 2011, 34 (1, 2, 3, 4) 2012-2013, 35-36 (1, 2, 3) 2014, 37 (1, 2, 3) ISSN 1980-9743 CDU 624.131.1
nal, with the name “Solos e Rochas”, was first published in 1978 by the Graduate School of Engineering, Federal University of Rio de Janeiro (COPPE-UFRJ). In 1980 it became the official magazine of the Brazilian Association for Soil Mechanics and Geotechnical Engi-neering (ABMS), acquiring the national character that had been the intention of its founders. In 1986 it also became the official Journal of the Brazilian Association for Engineering Geology and the Environment (ABGE) and in 1999 became the Latin American Geotechnical Journal, following the support of Latin-American representatives gathered for the Pan-American Conference of Guadalajara (1996). In 2007 the journal acquired the status of an international journal under the name of Soils and Rocks, published by the Brazilian Association for Soil Mechanics and Geotechnical Engineering (ABMS), Brazilian Association for Engineering Geology and the Environment (ABGE) and Portuguese Geotechnical Society (SPG). In 2010, ABGE decided to publish its own journal and left the partnership.
ARTICLES
Examination of the Potential of the Seismic Dilatometer (SDMT) to Estimate In Situ Stiffness Decay Curves in Various Soil Types
S. Amoroso, P. Monaco, B.M. Lehane, D. Marchetti 177
An Approach to Derive Strength Parameters of Residual Soils from DMT Results
N. Cruz, C. Rodrigues, A. Viana da Fonseca 195
A View of Pressuremeter Testing in North America
J. Benoît, J.A. Howie 211
Penetration Rate Ef on Cone Resistance: Insights From Calibration Chamber and Field Testing
R. Salgado, M. Prezzi 233
Energy Measurement in the Brazilian SPT System
C.M. Santana, F.A.B. Danziger, B.R. Danziger 243
Geotechnical Characterization of Suape Soft Clays, Brazil
R.Q. Coutinho, M.I.M.C.V. Bello 257
On the Characterization and Classification of Bauxite Tailings
F. Schnaid, H.P. Nierwinski, J. Bedin, E. Odebrecht 277
SOILS and ROCKS
An International Journal of Geotechnical and Geoenvironmental Engineering
Publication of
ABMS - Brazilian Association for Soil Mechanics and Geotechnical Engineering
SPG - Portuguese Geotechnical Society
Volume 37, N. 3, September-December 2014
Soils and Rocks
(SDMT) to Estimate In Situ Stiffness Decay Curves
in Various Soil Types
S. Amoroso, P. Monaco, B.M. Lehane, D. Marchetti
Abstract. This paper illustrates the use of the seismic dilatometer (SDMT) to assess the decay of in-situ stiffness with
strain level in different soil types. The approach adopted in this study relies on the ability of the SDMT to provide routinely at each test depth both a small strain stiffness (G0from VS) and a working strain stiffness (constrained modulus MDMT
derived from the usual DMT interpretation). At various test sites, working strain DMT moduli are compared with reference stiffness decay curves back-figured from (i) the behavior observed under a full-scale test embankment (at Treporti) or footings (in Texas), (ii) from laboratory tests (at L’Aquila, Fucino plain and Po plain) and (iii) various combinations of in-situ and laboratory testing techniques (Western Australia). Typical ranges of the shear strainsgDMTassociated with working strain DMT moduli are inferred to assist construction of stiffness - strain decay curves for different soil types.
Keywords: seismic dilatometer, in situ stiffness decay curves, working strain stiffness, small strain stiffness.
1. Introduction
Methods for deriving stiffness decay curves (G-g curves or similar, G = shear modulus,g = shear strain) from in situ tests have been proposed by various Authors e.g. Robertson & Ferrera (1993) and Fahey (1998) used the un-load-reload (u-r) cycles from self-boring pressuremeter tests; Mayne et al. (1999) and Marchetti et al. (2008) em-ployed the SDMT; Elhakim & Mayne (2003) and Mayne (2003) adopted the seismic cone tests (SCPTs) while Lehane & Fahey (2004) combined the SCPT and DMT.
The seismic dilatometer (SDMT) is the combination of the flat dilatometer (DMT) with an add-on seismic mod-ule for the measurement of the shear wave velocity VS. The
approach adopted in this study relies on the ability of the SDMT to provide routinely, at each test depth, both the stiffness at small strains (the small strain shear modulus G0
obtained from the shear wave velocity VSas G0=r VS
2 ) and the stiffness at operative strains (as represented by the con-strained modulus MDMTobtained by the usual DMT
interpre-tation). The potential for these two stiffness values to provide guidance when selecting the G-g curve of a soil ele-ment is examined.
2. Flat Dilatometer Test (DMT)
The flat dilatometer, introduced by Marchetti (1980), consists of a steel blade having a thin, expandable, circular steel membrane mounted on one face. When at rest, the membrane is flush with the surrounding flat surface of the blade. The blade is connected, by an electro-pneumatic
tube running through the insertion rods, to a control unit on the surface (Figs. 1a and 1b). The control unit is equipped with pressure gauges, an audio-visual signal, a valve for regulating gas pressure (provided by a tank) and vent valves. The blade is advanced into the ground using com-mon field equipment, i.e. penetrometers normally used for the cone penetration test (CPT) or drill rigs.
The test starts by inserting the dilatometer into the ground. When the blade has advanced to the desired test depth, the penetration is stopped. The operator inflates the membrane and takes, in about 30 sec, two readings: the A pressure, required to just begin to move the membrane (“lift-off” pressure), and the B pressure, required to expand the membrane center of 1.1 mm against the soil. A third reading C (“closing pressure”) can also optionally be taken by slowly deflating the membrane soon after B is reached. The blade is then advanced to the next test depth, with a depth increment of typically 20 cm.
The interpretation proceeds as follows. First the field readings are used to derive the DMT intermediate parame-ters material index ID, horizontal stress index KD,
dilato-meter modulus ED. Then ID, KD, EDare used, by means of
commonly used correlations, to estimate the constrained modulus M, the undrained shear strength su, the in situ earth
pressure coefficient K0(clays), the overconsolidation ratio OCR (clays), the friction anglej’ (sands), the bulk unit weightg. Consolidation and permeability coefficients may be estimated by performing dissipation tests. The
Sara Amoroso, Researcher, Department of Seismology and Tectonophysics, Istituto Nazionale di Geofisica e Vulcanologia, Italy. e-mail: [email protected]. Paola Monaco, Assistant Professor, Department of Civil, Architectural and Environmental Engineering, University of L’Aquila, Italy. e-mail: [email protected]. Barry M. Lehane, Winthrop Professor, School of Civil, Environmental and Mining Engineering, University of Western Australia, Western Australia. e-mail: [email protected].
Diego Marchetti, Engineer, Studio Prof. Marchetti, Italy. e-mail: [email protected].
C-reading, in sand, approximately equals the equilibrium pore pressure.
More detailed information on the DMT equipment, test procedure and all the interpretation formulae may be found in the comprehensive report by ISSMGE Technical Committee TC16 (Marchetti et al., 2001).
3. Seismic Dilatometer Test (SDMT)
The seismic dilatometer (SDMT) is a combination of the mechanical flat dilatometer (DMT) with an add-on seis-mic module for measuring the shear wave velocity VS. First
introduced by Hepton (1988), the SDMT was subsequently improved at Georgia Tech, Atlanta, USA (Martin & Mayne, 1997, 1998; Mayne et al., 1999). A new SDMT system (Figs. 1b and 1c) has been more recently developed in Italy (Marchetti et al., 2008).
The seismic module (Fig. 1b) is a cylindrical element placed above the DMT blade, equipped with two receivers spaced at 0.50 m. The shear wave source, located at ground surface, is an automatic hammer or a pendulum hammer (» 10 kg) which hits horizontally a steel rectangular plate pressed vertically against the soil (by the weight of the truck) and oriented with its long axis parallel to the axis of the receivers, so that they can offer the highest sensitivity to the generated shear wave. When a shear wave is generated at the surface (Fig. 1c), it reaches first the upper receiver, then, after a delay, the lower receiver. The seismograms ac-quired by the two receivers, amplified and digitized at depth, are transmitted to a PC at the surface, which deter-mines the delay. VSis obtained as the ratio between the
dif-ference in distance between the source and the two receiv-ers (S2- S1) and the delay of the arrival of the impulse from
the first to the second receiver (Dt).
The determination of the delay from SDMT seis-mograms, normally obtained using a cross-correlation al-gorithm rather than relying on the first arrival time or specific single points in the seismogram, is generally well
conditioned. The true-interval test configuration with two receivers avoids possible inaccuracy in the determination of the “zero time” at the hammer impact, sometimes ob-served in the pseudo-interval one-receiver configuration. Moreover, the couple of seismograms recorded by the two receivers at a given test depth corresponds to the same ham-mer blow and not to different blows in sequence, which are not necessarily identical. Hence the repeatability of VS
mea-surements is considerably improved (observed VS
repeat-ability» 1%, i.e. a few m/s). VSmeasurements are taken
every 0.50 m of depth (while the mechanical DMT readings are taken every 0.20 m). Validations of VSmeasurements by
SDMT by comparison with VSmeasured by other in situ
seismic tests at various research sites are reported by Mar-chetti et al. (2008).
4.Tentative Method for Deriving in situ G-
g
Decay Curves from SDMT
Marchetti et al. (2008) first proposed the possible use of the SDMT for deriving in situ elemental soil stiffness variations with strain level (G-g curves or similar). Such curves could be tentatively constructed by fitting “refer-ence typical-shape” laboratory G-g curves through two points, both obtained by SDMT: (1) the initial small strain modulus G0(obtained as G0 = r VS
2
), and (2) a working strain modulus GDMT.
To locate the second point on the G-g curve it is nec-essary to know, at least approximately, the elemental shear strain corresponding to GDMT. Indications by Mayne (2001)
locate the DMT moduli at an intermediate level of strain (g » 0.05-0.1%) along the G-g curve. Similarly Ishihara (2001) classified the DMT within the group of methods of measurement of soil deformation characteristics involving an intermediate level of strain (0.01-1%). The above quali-tative indications are investigated in this paper.
Figure 1 - (a) Schematic layout of the flat dilatometer test. (b) Seismic dilatometer equipment. (c) Schematic layout of the seismic dilatometer test (Marchetti et al., 2001; Marchetti et al., 2008).
As suggested by Marchetti et al. (2008), a working strain shear modulus GDMTcan be derived from the
con-strained modulus MDMTprovided by the usual DMT
inter-pretation (Marchetti, 1980, Marchetti et al., 2001). As a first approximation, by referring to linear elasticity:
GDMT = - MDMT -1 2 2 1 n n ( ) (1)
wheren = Poisson’s ratio. E.g. assuming a typical drained n of 0.2 (noting that MDMTis a drained modulus), the working strain shear modulus may be obtained from Eq. 1 as GDMT= 0.375 MDMT. It should be noted that correlations
be-tween the DMT parameters (EDand KD) and MDMTproposed
by Marchetti (1980) are based on the assumption that MDMT
represents a reasonable estimate of the “operative” or drained working strain modulus (i.e. the modulus that, when introduced into the linear elasticity formulae, pro-vides realistic estimates of the settlement of a shallow foun-dation under working loads). This assumption is supported by the good agreement observed in a large number of well documented comparisons between measured and DMT-predicted settlements or moduli (see Monaco et al., 2006; Marchetti et al., 2008).
The use of the SDMT to assess the in situ decay of stiffness at various test sites is explored in the following sections using data obtained in different soil types and where both SDMT data and “reference” stiffness decay curves were available. Such stiffness decay curves were: (a) back-figured from the observed behavior under a full-scale test embankment (Treporti) or footings (Texas), (b) obtained by laboratory tests (L’Aquila, Fucino plain, Po plain), or (c) reconstructed by the combined use of different in situ/laboratory techniques (Western Australia). The pro-cedure adopted in all cases is as follows, and is shown sche-matically on Fig. 2:
1) Using SDMT data obtained at the same depth of each available reference stiffness decay curve, a working strain modulus GDMT(or EDMT) is derived from MDMTand
normalized by its small strain value G0(or E0) derived
from VS.
2) The GDMT/G0(or EDMT/E0) horizontal ordinate line is
super-imposed to the same-depth experimental stiffness de-cay curve, in such a way that the data point ordinate matches the curve;
3) The “intersection” of the GDMT/G0(or EDMT/E0) horizontal
ordinate line with the stiffness decay curve provides a shear strain value referred to here asgDMT.
5. Stiffness Decay by SDMT at Various Test
Sites
5.1. Treporti, Venice (Italy)
A full-scale vertically-walled cylindrical test em-bankment (40 m diameter, 6.7 m height, applied load 106 kPa) was constructed at the site of Treporti, Venice (It-aly) where ground conditions are typical of the highly het-erogeneous, predominantly silty deposits of the Venice lagoon. Pore pressures, surface settlements, horizontal movements and vertical displacements were monitored continuously and at various depths; see Simonini (2006). The Treporti test site was investigated extensively by means of piezocone tests (Gottardi & Tonni, 2004), flat dilatometer tests (Marchetti et al., 2004), seismic piezo-cone tests and seismic dilatometer tests (McGillivray & Mayne, 2004), continuous coring boreholes and high qual-ity laboratory tests (Simonini et al., 2006). Significant re-sults of the experimental program at Treporti have already been published by various research groups.
Figure 3 shows the profiles of the DMT parameters at Treporti, namely the material index ID, the constrained
modulus MDMT, the undrained shear strength suand the
hori-zontal stress index KDfrom DMT 14 at the centre of the
em-bankment, as well as the profiles of VS obtained from
SDMT 14 (McGillivray & Mayne, 2004), before starting the construction of the embankment (2002).
The Treporti embankment research has provided a unique opportunity to investigate the decay of soil stiffness in situ (Monaco et al., 2014). Besides the moduli at the end of construction, moduli were also back-calculated in the el-ements on the centerline from local vertical strainsev mea-sured during construction, under each load increment (from small to working strains). The stiffness considered in this section is the Young’s modulus E.
In situ secant Young’s moduli E were back-calculated at the mid-height of each 1 m soil layer as E = (Dsv- 2n Dsr)/ev, assuming vertical and radial stress incrementsDsv andDsr according to the theory of elasticity,evobtained from extensometer data at the centre of the embankment under each load increment during construction (Marchetti et al., 2006). Figure 4a shows the moduli corresponding to the first construction step (H = 0.5 m), to half-bank (H = 3.5 m) and to the construction end (H = 6.7 m). In the same figure, the small strain modulus E0, derived from VS Figure 2 - Procedure to derive in situ G-g decay curves from
measured by SDMT, and the modulus EDMTderived from MDMTare shown for comparative purposes, assuming
elas-ticity theory and a Poisson’s ration = 0.15 for both cases (hence EDMT= 0.95 MDMT). Figure 4a shows the progressive
reduction of the back-calculated moduli E under increasing load. Such reduction should reflect the combined effects of the increase in stiffness with stress level and the reduction in stiffness with strain level.
In order to separate the two effects, the dependence of E on current stress level was taken into account, as a first approximation, by use of the Janbu’s relation:
E K p p E a v a n = æ ¢ è ç ö ø ÷ s (2)
where KE= modulus number, pa= reference atmospheric
pressure (100 kPa),s’v= current vertical effective stress, and n = exponent, generally varying between 0.5 to 1 and assumed here to equal 0.5, following the observations of Cola & Simonini (2002). The variation of the modulus number KEin Eq. 2 corresponding to E back-calculated
un-der each load increment is represented in Fig. 4b, which even more clearly shows the decay of stiffness, normalized for the effect of stress level, with increasing strain.
Figure 3 - Profiles of soil parameters from DMT 14 at the bank center (Marchetti et al., 2004) and VS profiles from SDMT 14
(McGillivray & Mayne, 2004) before embankment construction.
Figure 4 - Variation of (a) secant Young’s modulus E, and (b) corresponding modulus number KE(Eq. 2), back-calculated from localev
In situ decay curves of soil stiffness with strain level (Fig. 5) were reconstructed from the back-calculated moduli at the mid-height of each 1 m soil layer. To account for the effect of varying stress level, such in situ curves are expressed in terms of variation of the ratio KE/KE0, where KE
and KE0are respectively the modulus number
correspond-ing to E back-calculated for each load increment and to the initial modulus E0(KE0is obtained by Eq. 2 for E = E0and
s’v=s’v0). The two sets of curves in Fig. 5 are representa-tive of two distinct soil layers: (a) the sand layer between 2 to 8 m depth, and (b) the low plasticity (plasticity index PI = 8-12%, Simonini et al., 2006) silt layer between 8 to 20 m depth (which contributed most of the observed settle-ment). Note that the initial part of the curves in Fig. 5 at small strains is missing, since the extensometers did not provide reliable measurements ofevless than about 0.01-0.5%.
At Treporti test site, using SDMT results obtained at the depth of each back-figured in situ stiffness decay curve in Fig. 5, Young’s moduli EDMTwere derived from MDMT
us-ing elasticity theory and normalized by their small strain values E0derived from VS. The EDMTmoduli were derived
from the constrained moduli MDMT, using the theory of
elas-ticity, by Eq. 3: EDMT =MDMT + -( )( ) ( ) 1 1 2 1 n n n (3) assumingn = 0.15, hence EDMT= 0.95 MDMT.
The dots in Fig. 5 are the intersection between the in situ decay curve at a given depth and the horizontal line having as ordinate the ratio KE/KE0corresponding to EDMT/E0
at the same depth. Such “intersections” provided the values of the associated abscissas, i.e. the vertical strainsevin this case. The rectangular shaded areas in Figs. 5a and 5b de-note, for each soil layer, the range of values of the ratio KE/KE0corresponding to EDMT/E0and the associated range of
vertical strains:ev» 0.01 to 0.1% in sand, » 0.3 to 1% in silt (Monaco et al., 2014).
Hence, the ratio GDMT/G0was calculated by using the
theory of elasticity (Eq. 4), while the corresponding shear strain gDMT was obtained by Eqs. 5, 6, as introduced by
Atkinson (2000): GDMT = EDMT + 2 1( n) (4) assumingn = 0.15, hence GDMT= 0.43 EDMT. es = +(1 n e) v (5) gDMT = es 3 2 (6)
wherees= shear strain for the individual soil elements.
The values of the normalized working strain shear modulus GDMT/G0range from 0.18 to 0.24 in sand and 0.02 to
0.12 in silt, while the range of values of the shear straingDMT
are 0.02% to 0.14% in sand, 0.50% to 1.65% in silt.
5.2. Texas A&M University National Geotechnical Ex-perimentation Site (U.S.A.)
In 1994 a Spread Footing Prediction Symposium was conducted at the Texas A&M University National technical Experimentation Site, as part of the ASCE Geo-technical Specialty Conference Settlement ’94. Five square footings, ranging in size from 1 to 3 m, were constructed and tested to obtain the complete load-settlement curves (Gibbens & Briaud, 1994a). The test site, composed of me-dium dense silty fine sand, was extensively investigated by several in situ tests (SPT, CPTU, DMT, borehole pres-suremeter, Cross-Hole, borehole shear test and step blade test). Laboratory triaxial and resonant column tests were executed on reconstituted samples (Gibbens & Briaud, 1994b). Figure 6 plots the DMT profiles (DMT 1, DMT 2),
Figure 5 - Curves of decay of soil stiffness with vertical strain back-calculated from localevmeasurements (curves labeled “In situ curves”) in the sand layer 2 to 8 m depth (box a) and in the silt
layer 8 to 20 m depth (box b). The dots are the intersection be-tween the curve at a given depth and the horizontal line having as ordinate the ratio KE/KE0 corresponding to EDMT/E0 at the same
depth. Such “intersections” provided the values of the associated abscissasev(Monaco et al., 2014, with permission from ASCE).
in terms of the material index ID, the constrained modulus M, the friction anglej’ and the horizontal stress index KD.
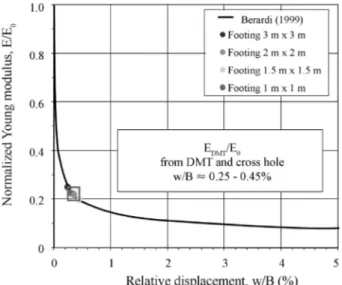
Figure 7 shows the in situ stiffness decay curve recon-structed by Berardi (1999) based on the observed perfor-mance of the footings. The Young’s modulus E was back-figured from the observed load-settlement curves by use of a non linear iterative approach. The influence of current stress level was considered “implicit” in the E values deter-mined over a limited influence depth, assumed within B and 2B (B = footing width). In Fig. 7 the decay of E, normalized to its initial value E0, is plotted as a function of the relative
displacement w/B% (footing settlement w/ width B). From the results of two DMTs executed at the Texas A&M University test site, Young’s moduli EDMT(average
values over an influence depth assumed within B and 2B) were derived from MDMTby Eq. 3, assumingn = 0.2. The
ini-tial values of E0over the same depth interval were derived
from VSmeasured by Cross-Hole via elasticity theory (for
n = 0.2). In Fig. 7 the data points corresponding to EDMT/E0
for each footing size (3 m, 2 m, 1.5 m and 1 m) are superim-posed to the E/E0 - w/B curve reconstructed by Berardi
(1999). The “intersection” of the DMT data points with the
observed in situ decay curve indicates that the moduli esti-mated from DMT are located in a range of relative displace-ment w/B» 0.25 to 0.45%.
Hence, the ratio GDMT/G0was calculated by using the
theory of elasticity (Eq. 4), while the corresponding shear strain gDMT was obtained by Eqs. 6, 7, as introduced by
Atkinson (2000): ev w B » 3 (7)
The values of the normalized working strain shear modulus GDMT/G0 range from 0.20% to 0.25%, while the
range of values of the shear straingDMTare 0.02 to 0.14% in
sand, 0.13 to 0.23% in silt.
5.3. L’Aquila (Italy)
Following the destructive April 6, 2009 earthquake (moment magnitude Mw= 6.3), the area of L’Aquila was
ex-tensively investigated by a variety of geotechnical and geo-physical testing techniques, involving several working groups. Soon after the earthquake site investigations, in-cluding Down-Hole, surface wave tests and SDMT, were concentrated at a number of sites selected for the construc-tion of new temporary houses for the homeless people (C.A.S.E. Project). Advanced cyclic/dynamic laboratory tests, including resonant column/torsional shear tests (RC-CTS) and double sample direct simple shear tests (DSDSS), were carried out on undisturbed samples from several C.A.S.E. sites, in medium- to fine-grained soils, by a network of Italian soil dynamics laboratories. Details and data are reported in Monaco et al. (2012); Santucci de Magistris et al. (2013); Monaco et al. (2013). The availabil-ity of both SDMT and laboratory test results at three C.A.S.E. sites (Cese di Preturo, Pianola, Roio Piano) per-mitted some calibration of empirical estimates of non-linear parameters from SDMT (Amoroso et al., 2012).
Coupled data from SDMT and resonant column/tor-sional shear tests were also obtained from an extensive geotechnical investigation performed in the Southern part of the city centre of L’Aquila for the reconstruction of sev-eral damaged buildings (Totani et al., 2012; Amoroso et al., 2015).
Figure 6 - DMT profiles at Texas A&M University National Geotechnical Experimentation Site (after Gibbens & Briaud, 1994b).
Figure 7 - Stiffness decay curve at Texas A&M University Na-tional Geotechnical Experimentation Site (Berardi, 1999) and su-perimposed EDMT/E0data points (Amoroso et al., 2012).
Table 1 reports the values of the shear wave velocity VSmeasured by SDMT, the small strain shear modulus G0 in situ obtained from VS, the constrained modulus MDMT
ob-tained from the SDMT at the depth of the samples tested in the laboratory, the working strain shear modulus GDMT
cal-culated using Eq. 1, assumingn = 0.2, and the plasticity index PI. The values of the normalized working strain shear modulus GDMT/G0, also reported in Table 1, result
0.10 to 0.23 in silt and clay, 0.37 in silty sand. Figure 8 plots the SDMT profiles, in terms of the material index ID,
the constrained modulus M, the undrained shear strength
su, the horizontal stress index KDand the shear wave
veloc-ity VSat the four mentioned sites. In Fig. 9 each GDMT/G0
data point (grey symbols) is superimposed on the corre-sponding same-depth laboratory G/G0curve (RC tests by
University of Napoli Federico II, DSDSS tests by Univer-sity of Roma La Sapienza). The range of values of the shear straingDMT resulting from the “intersection” of the GDMT/G0data points with the laboratory curves
(rectangu-lar areas in Fig. 9) aregDMT= 0.24 to 0.52% in silt and clay,
gDMT = 0.16% in silty sand; these are also reported in
Table 1.
5.4. Fucino plain (Italy)
In 1986 a comprehensive investigation, involving static and dynamic loading effects, was carried out in the na-tional research site of Fucino, Italy (Burghignoli et al., 1991). In situ tests (SPT, CPT, DMT, self-boring pres-sumeter, vane test, Down-Hole, Cross-Hole, Spectral
Analy-sis of Surface Waves) and laboratory tests (static and dynamic) were carried out to investigate the homogeneous lacustrine clay deposit to a depth of 40 m. Resonant col-umn/torsional shear tests (RC-CTS) were executed on twelve undisturbed samples recovered from depths ranging between 3 and 37 m (effective vertical stress between 30 and 250 kPa). Although the data points pertain to a wide range of consolidation stresses, the results define, within a narrow band, the strong dependence of the stiffness on the strain level (Burghignoli et al., 1991). In 2004 the same site in the Fucino plain was investigated by seismic dilatometer (Mar-chetti et al., 2008) and the results are illustrated in Fig. 10.
Table 2 reports the values of the shear wave velocity VSmeasured by SDMT, the small strain shear modulus G0 in situ obtained from VS, the constrained modulus MDMT
ob-tained by SDMT at the depth of the samples tested in the laboratory, the working strain shear modulus GDMT
calcu-lated by Eq. 1, assumingn = 0.2, and the plasticity index PI. The values of the normalized working strain shear modulus GDMT/G0, also reported in Table 2, result 0.04 to 0.13 in clay.
In Fig. 11 each GDMT/G0data point (grey symbols) is
super-imposed on the corresponding same-depth laboratory G/G0
curve (RC tests). The range of values of the shear straingDMT
resulting from the “intersection” of the GDMT/G0data points
with the laboratory curves (rectangular areas in Fig. 11) are gDMT = 1.10 to 1.70% in clay; these are also reported in
Table 2.
Table 1 - L’Aquila - Values of GDMT/G0obtained from SDMT and corresponding shear straingDMTdetermined from the intersection with
the G/G0-g laboratory curves (after Amoroso et al., 2012).
Test site Sample Depth
(m) Soil type VS(m/s) G0 (MPa) MDMT (MPa) n GDMT (MPa) GDMT/G0 gDMT(%) PI (%)
Cese di Preturo S3-C1 4.0-4.8 Silty clay 261 133 67 0.2 25 0.19 0.24 37
Cese di Preturo S3-C3 17.5-18.0 Clayey silt 274 149 39 0.2 15 0.1 0.48 37
Pianola S1-C1 6.0-6.5 Silty sand 303 195 193 0.2 72 0.37 0.16 31
Roio Piano S3-C2 7.0-7.5 Clayey silt 233 105 64 0.2 24 0.23 0.46 19
L’Aquila S1-C1 3.5-4.0 Clayey-sandy silt 344 232 97 0.2 36 0.16 0.52 31
Table 2 - Fucino plain - Values of GDMT/G0obtained from SDMT and corresponding shear straingDMTdetermined from the intersection
with the G/G0-g laboratory curves.
Test site Sample Depth (m)
Soil type VS(m/s) G0(MPa) MDMT
(MPa) n GDMT (MPa) GDMT/G0 gDMT(%) PI (%) Telespazio - 5.0 Clay 70 14.7 1.4 0.2 0.5 0.04 1.70 30-70 Telespazio - 10.0 Clay 101 15.7 1.8 0.2 0.7 0.04 1.70 30-70 Telespazio - 15.0 Clay 98 17.7 2.2 0.2 0.8 0.05 1.60 30-70 Telespazio - 20.0 Clay 124 16.7 4 0.2 1.5 0.09 1.40 30-70 Telespazio - 25.0 Clay 156 16.7 5.6 0.2 2.1 0.13 1.10 30-70 Telespazio - 30.0 Clay 183 17.7 5.9 0.2 2.2 0.13 1.10 30-70
Figure 9 - Laboratory G/G0-g curves and superimposed GDMT/G0
5.5. Po plain (Italy)
The seismic sequence which affected northern Italy in May 2012, in particular the two main shocks that occurred on May 20, 2012 (Mw= 5.8) and May 29, 2012 (Mw= 5.6),
induced several cases of liquefaction and related ground deformations.
An extensive site investigation program was subse-quently planned by the “Liquefaction Working Group” promoted by the Emilia Romagna regional government and by the national Department of Civil Protection, in addition to the existing soil investigation data base, to characterize the soils and to define the input data necessary for site seis-mic response analyses and for assessment of liquefaction hazard (Regione Emilia Romagna - Liquefaction Working Group, 2012). The available results of this investigation programme, illustrated in various reports and papers (e.g. Facciorusso et al., 2012, Fioravante et al., 2013), include borehole logs, results of piezocone/seismic piezocone pen-etration tests (CPTU/SCPTU) and laboratory tests on sam-ples, including resonant column/torsional shear tests
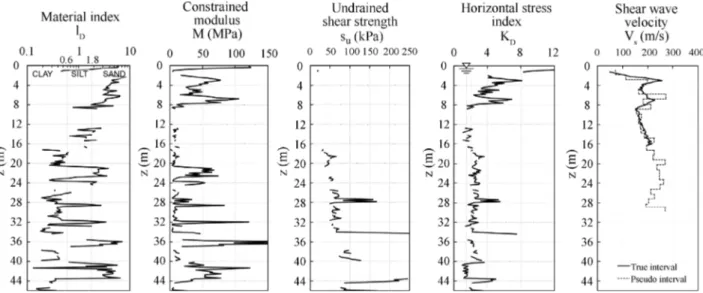
(RC-CTS). An additional investigation involving seismic dilatometer (SDMTs), as illustrated in Fig. 12, as well as resonant column tests (RC) was carried out by the Working Group S2-UR4 (2013) and focused only on the area of San Carlo; see also Romeo et al. (2015). The town of San Carlo was constructed above the abandoned channel of the Reno River, and sand is the prevailing lithology in the band near this paleo-channel. Part of the town was built on the ancient banks of the Reno River.
The availability of results from both SDMT and labo-ratory resonant column (RC) tests on undisturbed samples taken in nearby boreholes in the area of San Carlo permitted some calibration of empirical estimates of non-linear pa-rameters from SDMT.
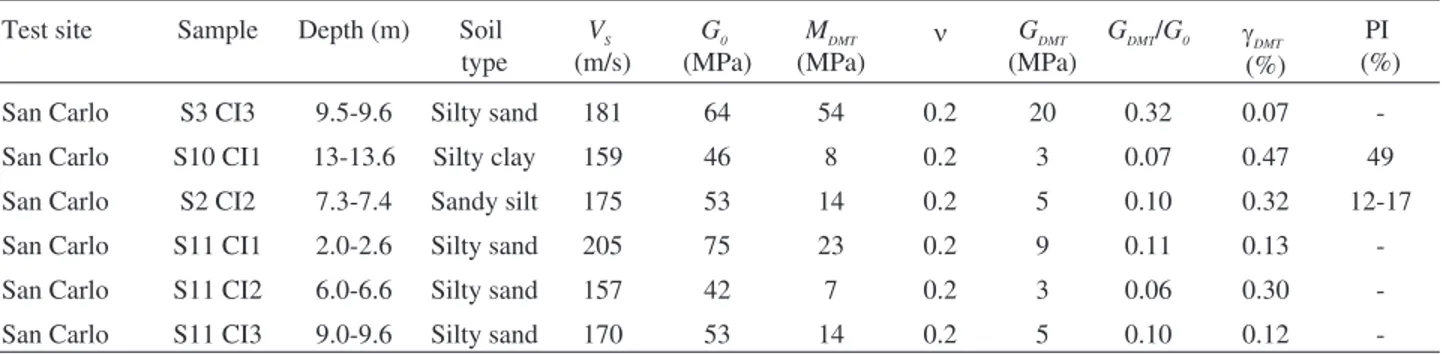
Table 3 reports the values of the shear wave velocity VSmeasured by SDMT, the small strain shear modulus G0 in situ obtained from VS, the constrained modulus MDMT
ob-tained from SDMTs performed at the depth of the samples tested in the laboratory, the working strain shear modulus GDMTcalculated by Eq. 1, assumingn = 0.2, and the
plastic-ity index PI. The values of the normalized working strain shear modulus GDMT/G0range from 0.07 to 0.10 in silt and
clay, and 0.06 to 0.32 in silty sand; see Table 3. In Fig. 13 each GDMT/G0data point (black and grey symbols) is
super-imposed on the corresponding same-depth laboratory G/G0
curve (RC tests). The range of values of the shear straingDMT
resulting from the “intersection” of the GDMT/G0data points
with the laboratory curves (rectangular areas in Fig. 13) are gDMT= 0.32% to 0.47% in silt and clay,gDMT= 0.07 to 0.30%
in silty sand; see Table 3.
5.6. Western Australia
The G/G0-g decay curves presented in this section
were obtained at five different test sites in Western Austra-lia (Shenton Park, Ledge Point, Perth CBD, East Perth, Margaret River). Such curves were constructed based on the results of several in situ tests, including flat/seismic dilatometer tests (DMT/SDMT), seismic cone penetration tests (SCPT), self-boring pressuremeter tests (SBP) and
Figure 10 - SDMT profiles at Fucino plain (Marchetti et al., 2008).
Figure 11 - Laboratory G/G0-g curve (Burghignoli et al., 1991)
laboratory triaxial tests. Details can be found in Amoroso (2011), Fahey et al. (2003, 2007), Lehane et al. (2007), Lehane (2010), Lehane & Fahey (2004), Schneider et al. (2008), Schneider & Lehane (2010).
Figure 14 shows the SDMT profiles, in terms of the material index ID, the constrained modulus MDMT, the
in-ferred friction anglej’ or the undrained shear strength su,
the horizontal stress index KDand the shear wave velocity VSat the three mentioned sites.
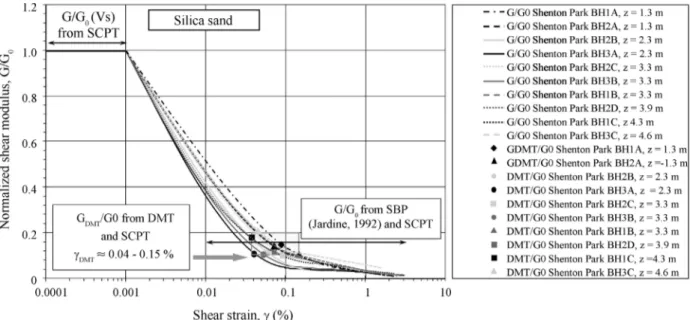
The in situ normalized G/G0-g decay curves shown in
Fig. 15 (Shenton Park, silica sand), Fig. 16 (Ledge Point, calcareous sand) and Fig. 17 (Perth CBD, alluvial silty clay) were reconstructed by combining the information re-sulting from SCPT and SBP. In particular:
• the initial part of the curves (g £ 0.001%) was character-ized by the small strain shear modulus G0obtained from VSmeasured by SCPT (no SDMT data were available at
these sites);
• the non-linear G/G0-g decay at medium to large shear
strains (g ³ 0.01%) was estimated based on SBP data, ac-cording to the procedure proposed by Jardine (1992); • the central part of the curves (0.001% >g > 0.01%) was
defined by simply connecting the initial part obtained from SCPT (G0) and the final part obtained from SBP.
The working strain shear modulus GDMTwas
calcu-lated from MDMTobtained by DMT at the same depths of the
SCPT and SBP data used to define the G/G0-g curve, by use
of Eq. 1, assumingn = 0.2 in sand in silty clay. The values
Figure 12 - SDMT profiles at Po plain (Working Group S2-UR4, 2013).
Table 3 - Po plain - Values of GDMT/G0obtained from SDMT and corresponding shear straingDMTdetermined from the intersection with
the G/G0-g laboratory curves (after Working Group S2-UR4, 2013).
Test site Sample Depth (m) Soil type VS (m/s) G0 (MPa) MDMT (MPa) n GDMT (MPa) GDMT/G0 g DMT (%) PI (%)
San Carlo S3 CI3 9.5-9.6 Silty sand 181 64 54 0.2 20 0.32 0.07
-San Carlo S10 CI1 13-13.6 Silty clay 159 46 8 0.2 3 0.07 0.47 49
San Carlo S2 CI2 7.3-7.4 Sandy silt 175 53 14 0.2 5 0.10 0.32 12-17
San Carlo S11 CI1 2.0-2.6 Silty sand 205 75 23 0.2 9 0.11 0.13
-San Carlo S11 CI2 6.0-6.6 Silty sand 157 42 7 0.2 3 0.06 0.30
-San Carlo S11 CI3 9.0-9.6 Silty sand 170 53 14 0.2 5 0.10 0.12
-Figure 13 - Laboratory G/G0-g curves (after Fioravante et al.,
of GDMT/G0range from 0.10 to 0.20 in silica sand, 0.08 to
0.31 in calcareous sand, 0.09 to 0.30 in silty clay; see Table 4. The black and grey symbols in Figs. 15, 16 and 17 repre-sent the position of the GDMT/G0data points on the
corre-sponding in situ reference G/G0-g decay curves. The range
of values of the shear straingDMTresulting from the
“inter-section” with the in situ G/G0-g curves (rectangular shaded
areas in Figs. 15, 16 and 17), also reported in Table 4, are gDMT= 0.04-0.15% in sand andgDMT= 0.23-1.50% in silty
clay.
The G/G0-g decay curves shown in Fig. 18 (East
Perth, soft clay) and Fig. 19 (Margaret River, silty clay) were reconstructed by combining the information resulting
Figure 14 - DMT profiles and VSprofiles at different sites in Western Australia: (a) Shenton Park, (b) Ledge Point, (c) Perth CBD, (d)
from in situ SDMT and laboratory triaxial tests. In this case:
• the initial part of the curves (g £ 0.001%) was character-ized by G0derived from VSmeasured by SDMT;
• the non-linear G/G0-g decay at medium to large shear
strains (g ³ 0.1% at Margaret River, g ³ 0.5% at East Perth) was estimated from triaxial tests according to Atkinson (2000);
• the central part of the curves (0.001% >g > 0.5% at East Perth, 0.001% >g > 0.1% at Margaret River) was defined by simply connecting the initial part obtained from SDMT (G0) and the final part obtained from triaxial tests.
The working strain shear modulus GDMTwas
calcu-lated from MDMTobtained by SDMT at the same depths of
the samples tested in the laboratory by use of Eq. 1, assum-ingn = 0.2 at both sites. The values of GDMT/G0vary from
0.04 in soft clay to 0.07 in silty clay; see Table 4. The values of the shear straingDMTresulting from the “intersection” of
the GDMT/G0 data points with the reconstructed reference G/G0-g decay curves (dot symbols in Figs. 18 and 19) are
5.5% in soft clay and vary from 0.23% to 1.50% in silty clay; see Table 4.
6. Discussion
6.1. Summary of results at various test sites
Over the past decades, numerous studies have been conducted regarding the dynamic soil properties and the
Figure 15 - In situ G/G0-g decay curves and superimposed GDMT/G0data points at Shenton Park (silica sand), Western Australia
(Amo-roso et al., 2012).
Figure 16 - In situ G/G0-g decay curves and superimposed GDMT/G0
data points at Ledge Point (calcareous sand), Western Australia (Amoroso et al., 2012).
Figure 17 - In situ G/G0-g decay curves and superimposed GDMT/G0
data points at Perth CBD (silty clay), Western Australia (after Amoroso et al., 2012).
Figure 18 - In situ G/G0-g decay curves and superimposed GDMT/G0
data points at East Perth (soft clay), Western Australia (Amoroso
et al., 2012).
Figure 19 - In situ G/G0-g decay curves and superimposed GDMT/G0
data points at Margaret River (silty clay), Western Australia (Amoroso et al., 2012).
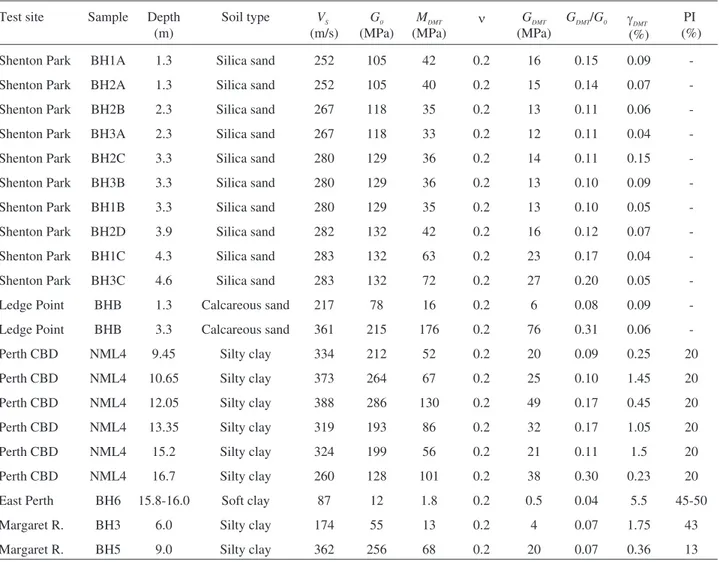
Table 4 - Western Australia - Values of GDMT/G0obtained from SDMT (or DMT + SCPT) and corresponding shear straingDMTdetermined
from the intersection with the G/G0-g reference curves at five test sites (Amoroso et al., 2012).
Test site Sample Depth (m) Soil type VS (m/s) G0 (MPa) MDMT (MPa) n GDMT (MPa) GDMT/G0 gDMT (%) PI (%)
Shenton Park BH1A 1.3 Silica sand 252 105 42 0.2 16 0.15 0.09
-Shenton Park BH2A 1.3 Silica sand 252 105 40 0.2 15 0.14 0.07
-Shenton Park BH2B 2.3 Silica sand 267 118 35 0.2 13 0.11 0.06
-Shenton Park BH3A 2.3 Silica sand 267 118 33 0.2 12 0.11 0.04
-Shenton Park BH2C 3.3 Silica sand 280 129 36 0.2 14 0.11 0.15
-Shenton Park BH3B 3.3 Silica sand 280 129 36 0.2 13 0.10 0.09
-Shenton Park BH1B 3.3 Silica sand 280 129 35 0.2 13 0.10 0.05
-Shenton Park BH2D 3.9 Silica sand 282 132 42 0.2 16 0.12 0.07
-Shenton Park BH1C 4.3 Silica sand 283 132 63 0.2 23 0.17 0.04
-Shenton Park BH3C 4.6 Silica sand 283 132 72 0.2 27 0.20 0.05
-Ledge Point BHB 1.3 Calcareous sand 217 78 16 0.2 6 0.08 0.09
-Ledge Point BHB 3.3 Calcareous sand 361 215 176 0.2 76 0.31 0.06
-Perth CBD NML4 9.45 Silty clay 334 212 52 0.2 20 0.09 0.25 20
Perth CBD NML4 10.65 Silty clay 373 264 67 0.2 25 0.10 1.45 20
Perth CBD NML4 12.05 Silty clay 388 286 130 0.2 49 0.17 0.45 20
Perth CBD NML4 13.35 Silty clay 319 193 86 0.2 32 0.17 1.05 20
Perth CBD NML4 15.2 Silty clay 324 199 56 0.2 21 0.11 1.5 20
Perth CBD NML4 16.7 Silty clay 260 128 101 0.2 38 0.30 0.23 20
East Perth BH6 15.8-16.0 Soft clay 87 12 1.8 0.2 0.5 0.04 5.5 45-50
Margaret R. BH3 6.0 Silty clay 174 55 13 0.2 4 0.07 1.75 43
parameters affecting them, such as the mean effective con-fining pressure, the soil type and the plasticity. Various in-vestigators have proposed non linear curves for sands (for example Darendeli, 2001; Seed et al., 1986; Iwasaki et al., 1978; Kokusho, 1980), clays and silts with different plas-ticity (for example Darendeli 2001; Vucetic & Dobry, 1991; Sun et al., 1988). Figure 20 summarizes the upper and lower ranges of these typical curves, obtained for dif-ferent values of the mean effective confining pressure,
as-sumed between 25 and 1600 kPa, and a plasticity index PI ranging between 0% and 100%. Figure 20 shows that the curves proposed by Darendeli (2001) including all the other reference curves.
Figure 21 depicts the possible use of the SDMT for calibrating the selection of in situ G/G0-g decay curves
in various soil types. The results obtained at all the test sites previously described were superimposed on the Darendeli (2001) G/G0-g stiffness decay curves. The
rectangular shaded areas in Fig. 21 represent the range of values of the normalized working strain shear modu-lus GDMT/G0determined in different soil types (sand, silt
and clay) and the corresponding shear straingDMT
deter-mined by the “intersection” procedure. Based on the available information, the “typical range” of shear strain associated to the working strain moduli GDMTcan
be approximately assumed as: gDMT » 0.01-0.45% in
sand,gDMT» 0.1-1.9% in silt and clay. In soft clay the
values ofgDMT> 2% (not shown in Fig. 21) are too high to
attempt an interpolation using a reference stiffness de-cay curve.
These observations are in agreement with prelimi-nary literature indications (Mayne, 2001; Ishihara, 2001). Moreover, the calculated values of the ratio GDMT/G0
-which could be regarded as the shear modulus decay fac-tor at working strains - are in line with the trends observed by Marchetti et al. (2008), who investigated the experi-mental interrelationship between small strain and work-ing strain stiffness uswork-ing SDMT in sand, silt and clay. In particular, the diagrams of the ratio GDMT/G0vs. the DMT
horizontal stress index KD(related to OCR) constructed by
Marchetti et al. (2008) using the SDMT results at 34 dif-ferent sites, in a variety of soil types, indicated that the G decay in sands is more significant at lower strains than in silts and clays, and that the decay curves in silts and clays are very similar.
Figure 20 - Reference G/G0-g decay curves: (a) sands, (b) silts and
clays with plasticity index PI = 0-50%, (c) silts and clays with plasticity index PI = 50-100%.
Figure 21 - Possible use of the SDMT for calibrating the selection of in situ G/G0-g decay curves in various soil types.
6.2. Proposed numerical G-g decay curves from SDMT
Several authors (Hardin & Drnevich, 1972; Bellotti et al., 1989; Byrne et al., 1990; Fahey & Carter, 1993; Fahey, 1998) introduced a hyperbolic model to represent the non-linear stress-strain behaviour of soil in pressuremeter tests. In this respect, the SDMT experimental data deter-mined at all the investigated test sites (Fig. 22) were used to assist the construction of a hyperbolic stress-strain equation (Eq. 8): G G G GDMT DMT 0 0 1 1 1 = +æ -è çç öø÷÷g g (8)
Thus, the ratio GDMT/G0obtained from SDMT and the
estimated shear straingDMTwere used to plot the
correspond-ing hyperbolic curve at each test site. In the examples shown in Fig. 23a (Shenton Park, sand) and 23b (Roio Pi-ano, clayey silt), the curves obtained from SDMT, using Eq. 8 and the coupled values of GDMT/G0-gDMTintroduced in
the tables (thick black lines in Figs. 23a and b), evidently provide a reasonable fit to the “measured” stiffness decay curves.
The estimatedgDMTvalues for each case history
exam-ined are plotted on Fig. 23. It is apparent thatgDMTvalues in
clays are higher than those in sands; this trend is in keeping with that seen on Fig. 20. Combined with a measured GDMT/G0value from the SDMT, Fig. 23 can be used in
com-bination with Eq. 8 to provide a first order estimate of a given soil’s elemental G vsg curve. It is noted that
hyper-Figure 23 - Comparison between hyperbolic and “measured” stiffness decay curves at Shenton Park (a) and Roio Piano (b).
Figure 22 - SDMT experimental data used to assist the construc-tion of a hyperbolic equaconstruc-tion.
bolic G vsg curves have been seen to be particularly rele-vant for dynamic/cyclic applications.
7. Conclusions
The results presented in this paper support the possi-ble use of the SDMT to assess the decay of in situ stiffness with strain level and to address the selection of elemental G-g curves in various soil types. This potential stems from the ability of the SDMT to provide routinely, at each test depth, both a small strain stiffness (G0from VS) and a work-ing strain stiffness GDMT(derived via standard DMT
corre-lations). “Reference typical-shape” laboratory G-g curves may be tentatively fitted through these two stiffness values. A significant premise of this approach is that, to locate the second point on the G-g curve, it is necessary to know (at least approximately) the shear straingDMTcorresponding to working strain modulus GDMT.
Typical ranges ofgDMTin different soil types have been
inferred from the “intersection” of the SDMT data points with same-depth reference stiffness decay curves - back-figured from the observed field behavior under full-scale loading, or obtained by cyclic/dynamic laboratory tests or reconstructed by the combined use of different in situ/labo-ratory techniques - at various test sites.
Based on the available information,gDMTis typically
about 0.1% in sand, about 0.5 to 1.0% in silt and clay and greater than 2% in soft clay. The proposed hyperbolic rela-tionship, together with an estimate ofgDMTfrom Fig. 21, can
provide a useful first order estimate of a soil’s G-g degrada-tion curve.
Acknowledgments
Special thanks to Prof. Silvano Marchetti for provid-ing the initial ideas for this study, and for his precious and continuous suggestions to support this research. Special thanks also to Prof. Martin Fahey for offering his knowl-edge and experience to critically approach the present study.
References
Amoroso, S. (2011) G-g decay curves by seismic dilato-meter (SDMT). PhD Dissertation, Department of Struc-tural, Water and Soil Engineering, University of L’Aquila, L’Aquila, 480 p.
Amoroso, S.; Monaco, P. & Marchetti, D. (2012) Use of the Seismic Dilatometer (SDMT) to estimate in situ G-g de-cay curves in various soil types. Coutinho, R. & Mayne, P.W. (eds) Proc. 4th Int. Conf. on Geotechnical and Geophysical Site Characterization, ISC’4, Porto de Ga-linhas, Brazil, v. 1, p. 489-497.
Amoroso, S.; Totani, F.; Totani, G. & Monaco, P. (2015) Local seismic response in the Southern part of the his-toric centre of L’Aquila. Engineering Geology for Soci-ety and Territory - Urban Geology, Sustainable
Plan-ning and Landscape Exploitation, Springer Interna-tional Publishing, v. 5:XVIII, p. 1097-1100.
Atkinson, J.H. (2000) Non-linear soil stiffness in routine design. Géotechnique, v. 50:5, p. 487-508.
Bellotti, R.; Ghionna, V.; Jamiolkowski, M.; Robertson, P.K. & Peterson, R.W. (1989) Interpretation of moduli from self-boring pressumeter tests in sand. Géotechni-que, v. 39, p. 269-292.
Berardi, R. (1999) Non linear elastic approaches in founda-tion design. Jamiolkowski, M.; Lancellotta R. & Lo Presti D.C.F. (eds) Pre-Failure Deformation Character-istics in Geomaterials. Balkema, Rotterdam, p. 733-739.
Burghignoli, A.; Cavalera, L.; Chieppa, V.; Jamiolkowski, M.; Mancuso, C.; Marchetti, S.; Pane, V.; Paoliani, P.; Silvestri, F.; Vinale, F. & Vittori, E. (1991) Geotechni-cal characterization of Fucino clay. Proc. X ECSMFE, Firenze, v. 1, p. 27-40.
Byrne, P.M.; Salgado, F.M. & Howie, J.A. (1990) Rela-tionship between the unload shear modulus from pres-sumeter tests and the maximum shear modulus for sands. Proc. 3rd International Symposium on Pressu-meters, ISP3, Oxford, p. 231-241.
Cola, S. & Simonini, P. (2002) Mechanical behaviour of silty soils of the Venice lagoon as a function of their grading properties. Can. Geotech. J., v. 39:4, p. 879-893.
Darendeli, M.B. (2001) Development of a New Family of Normalized Modulus Reduction and Material Damping Curves. PhD Dissertation, University of Texas. Elhakim, A.F. & Mayne, P.W. (2003) Derived
stress-strain-strength of clays from seismic cone tests. Proc. 3rd Int. Symp. Deform. Charact. Geomaterials, Lyon, v. 1, p. 81-87.
Facciorusso, J.; Madiai, C. & Vannucchi, G. (2012) Ris-posta sismica locale e pericolosità sismica di liquefa-zione a San Carlo e Mirabello (FE). University of
Flor-ence, 3 October 2012 (in Italian),
http://ambiente.regione.emilia-romagna.it/geologia/te mi/sismica/liquefazione-gruppo-di-lavoro/RAPPORT O_RSL_LIQ_ott_2012_UNIFI.pdf/at_download/ file/RAPPORTO_RSL_LIQ_ott_2012_UNIFI.pdf. Fahey, M. & Carter, J.P. (1993) A finite element study of
the pressuremeter test in sand using a non-linear elastic plastic model. Can. Geotech. J., v. 30, p. 348-362. Fahey, M. (1998) Deformation and in situ stress
measure-ment. Robertson P.K. & Mayne P.W. (eds) Proc. 1st Int. Conf. on Site Characterization, Atlanta, v. 1, p. 49-68. Fahey, M.; Lehane, B.M. & Stewart, D. (2003) Soil
stiff-ness for shallow foundation design in the Perth CBD. Australian Geomechanics, v. 38:3, p. 61-90.
Fahey M.; Schneider, J.A. & Lehane, B.M. (2007) Self-boring pressuremeter testing in Spearwood dune sands. Australian Geomechanics, v. 42:4, p. 57-71.
Fioravante, V.; Giretti, D.; Abate, G.; Aversa, S.; Boldini, D.; Capilleri, P.P.; Cavallaro, A.; Chamlagain, D.; Crespellani, T.; Dezi, F.; Facciorusso, J.; Ghinelli, A.; Grasso, S.; Lanzo, G.; Madiai, C.; Massimino, M.R.; Maugeri, M.; Pagliaroli, A.; Rainieri, C.; Tropeano, G.; Santucci De Magistris, F.; Sica, S.;Silvestri, F. & Van-nucchi, G. (2013) Earthquake geotechnical engineering aspects of the 2012 Emilia-Romagna earthquake (Italy). Proc. 7th Int. Conf. on Case Histories in Geotechnical Engineering, Chicago, Paper No. EQ-5.
Gibbens, R.M. & Briaud, J.L. (1994a) Test and prediction results for five large spread footings on sand. Geotech-nical Special Publication, ASCE, v. 41, p. 92-128. Gibbens, R.M. & Briaud, J.L. (1994b) Data and prediction
request for the spread footing prediction event (at the occasion of the ASCE Spec. Conf. Settlement ‘94). Geotechnical Special Publication, ASCE, v. 41, p. 11-85.
Gottardi, G. & Tonni, L. (2004) A comparative study of piezocone tests on the silty soils of the Venice lagoon (Treporti Test Site). Viana da Fonseca A. & Mayne P.W. (eds) Proc. 2nd International Conference on Site Characterization, Porto, v. 2, p. 1643-1649.
Hardin, B. O. & Drnevich, V. P. (1972) Shear modulus and damping in soils: design equations and curves. J. Soil Mech. and Found. Div., ASCE, v. 98:SM7, p. 667-692. Hepton, P. (1988) Shear wave velocity measurements
dur-ing penetration testdur-ing. Proc. Penetration Testdur-ing in the UK, ICE, p. 275-278.
Ishihara, K. (2001) Estimate of relative density from in-situ penetration tests. Rahardjo P.P. & Lunne T. (eds). Proc. Int. Conf. on In Situ Measurement of Soil Properties and Case Histories, Bali, p. 17-26.
Iwasaki, T.; Tatsuoka, F. & Takagi, Y. (1978) Shear moduli of sands under cyclic torsional shear loading. Soils and Foundations, v. 18:1, p. 39-56.
Jardine, R.J. (1992) Non-linear stiffness parameters from undrained pressuremeter tests. Can. Geotech. J., v. 29:3, p. 436-447.
Kokusho, T. (1980) Cyclic triaxial test of dynamic soil properties for wide strain range. Soils and Foundations, v. 20:2, p. 45-60.
Lehane, B.M. & Fahey, M. (2004) Using SCPT and DMT data for settlement prediction in sand. Viana da Fonseca A. & Mayne P.W. (eds) Proc. 2nd Int. Conf. on Site Characterization, Porto, v. 2, p. 1673-1679.
Lehane, B.M.; Mathew, G. & Stewart, D. (2007) A labora-tory investigation of the upper horizons of the Perth/Guildford formation in Perth CBD. Australian Geomechanics, v. 42:3, p. 87-100.
Lehane, B.M. (2010) Shallow foundation performance in a calcareous sand. Proc 2nd Int. Symposium on Frontiers in Offshore Geotechnics, ISFOG-2, Perth, p. 427-432. Marchetti, S. (1980) In Situ Tests by Flat Dilatometer. J.
Geotech. Engrg. Div., ASCE, v. 106:GT3, p. 299-321.
Marchetti, S.; Monaco, P.; Totani, G. & Calabrese, M. (2001) The Flat Dilatometer Test (DMT) in Soil Inves-tigations - A Report by the ISSMGE Committee TC16. Proc. 2nd Int. Conf. on the Flat Dilatometer, Washing-ton D.C., p. 7-48.
Marchetti, S.; Monaco, P.; Calabrese, M. & Totani, G. (2004) DMT-predicted vs measured settlements under a full-scale instrumented embankment at Treporti (Ven-ice, Italy). Viana da Fonseca A. & Mayne P.W. (eds) Proc. 2nd Int. Conf. on Site Characterization, Porto, v. 2, p. 1511-1518.
Marchetti, S.; Monaco, P.; Calabrese, M. & Totani, G. (2006) Comparison of moduli determined by DMT and backfigured from local strain measurements under a 40 m diameter circular test load in the Venice area. Failmezger R.A. & Anderson J.B. (eds) Proc. 2nd Int. Conf. on the Flat Dilatometer, Washington D.C., p. 220-230.
Marchetti, S.; Monaco, P.; Totani, G. & Marchetti, D. (2008) In Situ tests by seismic dilatometer (SDMT). Laier, J.E.; Crapps D.K. & Hussein M.H. (eds) From Research to Practice in Geotechnical Engineering. Geo-technical Special Publication, ASCE, v. 180, p. 292-311.
Martin, G.K. & Mayne, P.W. (1997) Seismic flat dilato-meter tests in Connecticut Valley Varved clay. Geo-tech. Testing J., ASTM, v. 20:3, p. 357-361.
Martin, G.K. & Mayne, P.W. (1998) Seismic flat dila-tometer in Piedmont residual soils. Robertson P.K. & Mayne P.W. (eds) Proc. 1st Int. Conf. on Site Charac-terization, Atlanta, v. 2, p. 837-843.
Mayne, P.W.; Schneider, J.A. & Martin, G.K. (1999) Small- and large-strain soil properties from seismic flat dilatometer tests. Jamiolkowski, M.; Lancellotta R. & Lo Presti D.C.F. (eds) Pre-failure Deformation Charac-teristics in Geomaterials. Balkema, Rotterdam, p. 419-427.
Mayne, P.W. (2001) Stress-strain-strength-flow parame-ters from enhanced in-situ tests. Rahardjo P.P. & Lunne T. (eds), Proc. Int. Conf. on In Situ Measurement of Soil Properties and Case Histories, Bali, p. 27-47.
Mayne, P.W. (2003) Class “A” footing response prediction from seismic cone tests. Proc. 3rd Int. Symp. Deform. Charact. Geomaterials, Lyon, v. 1, p. 883-888. McGillivray, A. & Mayne, P.W. (2004) Seismic piezocone
and seismic flat dilatometer tests at Treporti. Viana da Fonseca A. & Mayne P.W. (eds) Proc. 2nd Int. Conf. on Site Characterization, Porto, v. 2, p. 1695-1700. Monaco, P.; Totani, G. & Calabrese, M. (2006)
DMT-predicted vs observed settlements: a review of the avail-able experience. Failmezger R.A. & Anderson J.B. (eds) Proc. 2nd Int. Conf. on the Flat Dilatometer, Washington D.C., p. 244-252.
Monaco, P.; Totani, G.; Barla, G.; Cavallaro, A.; Costanzo, A.; D’Onofrio, A.; Evangelista, L.; Foti, S.; Grasso, S.;
Lanzo, G.; Madiai, C.; Maraschini, M.; Marchetti, S.; Maugeri, M.; Pagliaroli, A.; Pallara, O.; Penna, A.; Saccenti, A.; Santucci de Magistris, F.; Scasserra, G.; Silvestri, F.; Simonelli, A.L.; Simoni, G.; Tommasi, P.; Vannucchi, G. & Verrucci, L. (2012) Geotechnical as-pects of the L’Aquila earthquake. Sakr M.A. & Ansal A. (eds) Special Topics in Advances in Earthquake Geotechnical Engineering, Chapter 1. Springer Sci-ence+Business Media B.V.
Monaco, P.; Totani, G.; Amoroso, S.; Totani, F. & Mar-chetti, D. (2013) Site characterization by seismic dila-tometer (SDMT) in the city of L’Aquila. Rivista Ita-liana di Geotecnica, v. XLVII:3, p. 8-22.
Monaco P.; Amoroso S.; Marchetti S.; Marchetti D.; Totani G.; Cola S. & Simonini P. (2014) Overconsolidation and Stiffness of Venice Lagoon Sands and Silts from SDMT and CPTU. J. Geotech. Geoenviron. Eng., ASCE, v. 140:1, p. 215-227.
Regione Emilia Romagna - Liquefaction Working Group (2012) Primo rapporto sugli effetti della liquefazione osservati a S. Carlo, frazione di S. Agostino (Provincia
di Ferrara). 25 June 2012 (in Italian),
http://ambiente.regione.emilia-romagna.it/geologia/te mi/sismica/liquefazione-gruppo-di-lavoro/rapporto_sa ncarlo.pdf/at_download/file/rapporto_sancarlo.pdf. Robertson, P.K. & Ferrera, R.S. (1993) Seismic and
pres-suremeter testing to determine soil modulus. Predictive soil mechanics, Wroth Memorial Symposium, p. 562-580.
Romeo, R. W.; Amoroso, S.; Facciorusso, J.; Lenti, L.; Madiai, C.; Martino, S.; Monaco, P.; Rinaldis, D. & Totani, F. (2015) Soil liquefaction during the Emilia, 2012 seismic sequence: investigation and analysis. En-gineering Geology for Society and Territory - Urban Geology, Sustainable Planning and Landscape Exploi-tation, Springer International Publishing, v. 5:XVIII, p. 1107-1110.
Santucci de Magistris, F.; d’Onofrio, A.; Evangelista, L.; Foti, S.; Maraschini, M.; Monaco, P.; Amoroso, S.; Totani, G.; Lanzo G.; Pagliaroli, A.; Madiai, C.; Si-moni, G. & Silvestri, F. (2013) Geotechnical character-ization of the Aterno valley for site response analyses. Rivista Italiana di Geotecnica, v. XLVII:3, p. 23-43.
Schneider, J.A.; Fahey, M. & Lehane, B.M. (2008) Charac-terization of an unsaturated sand deposit by in situ test-ing. Proc. 3rd Int. Conf. on Site Characterization, p. 633-638.
Schneider, J.A. & Lehane, B.M. (2010) Evaluation of cone penetration test data from a calcareous sand dune. Proc. 2nd Int. Symp. on Penetration Testing, Huntington Beach, CA.
Seed, H.B.; Wong, R.T.; Idriss, I.M. & Tokimatsu, K. (1986) Moduli and damping factors for dynamic analy-ses of cohesionless soils. Journal of the Soil Mechanics and Foundations Division, ASCE, v. 112:SM11, p. 1016-1032.
Simonini, P. (2004) Characterization of the Venice lagoon silts from in-situ tests and the performance of a test em-bankment. Viana da Fonseca A. & Mayne P.W. (eds) Proc. 2nd Int. Conf. on Site Characterization, Porto, v. 1, p. 187-207.
Simonini, P.; Ricceri, G. & Cola, S. (2006) Geotechnical characterization and properties of the Venice lagoon heterogeneous silts. Proc. 2nd Int Workshop on Charac-terization and Engineering Properties of Natural Soils, Singapore, v. 4, p. 2289-2328.
Sun, J.I.; Golesorkhi, R. & Seed H.B. (1988) Dynamic Moduli and Damping Ratio for Cohesive Soils. Report, UCB/EERC-88/15, University of California at Berkley, 48 p.
Totani, G.; Totani, F.; Monaco, P.; Tallini, M.; Del Mo-naco, F. & Zia, G. (2012) Site investigations and geo-technical problems in the Southern part of the historic centre of L’Aquila. Maugeri M. & Soccodato C. (eds) Proc. 2nd Int. Conf. on Performance-Based Design in Earthquake Geotechnical Engineering, Taormina, Italy, Paper No. 2.13, p. 315-328 (CD-ROM).
Vucetic, M. & Dobry, R. (1991) Effect of soil plasticityon cyclic response. Journal of Geotechnical Engineering, ASCE, v. 120:7, p. 585-594.
Working Group S2-UR4 (2013) Analysis of the liquefac-tion phenomena in the area of San Carlo by seismic dilatometer (SDMT). Project S2-2012 INGV-DPC, De-liverable D8.1 - Annex 3, Rev. 1.1, Sept. 2013 https://docs.google.com/file/d/0B60wsWaPpDL4RV Mzb01ETU8zT2s/edit?usp=sharing.
of Residual Soils from DMT Results
N. Cruz, C. Rodrigues, A. Viana da Fonseca
Abstract. Residual soils show a specific mechanical behaviour classified as non-conventional when compared with
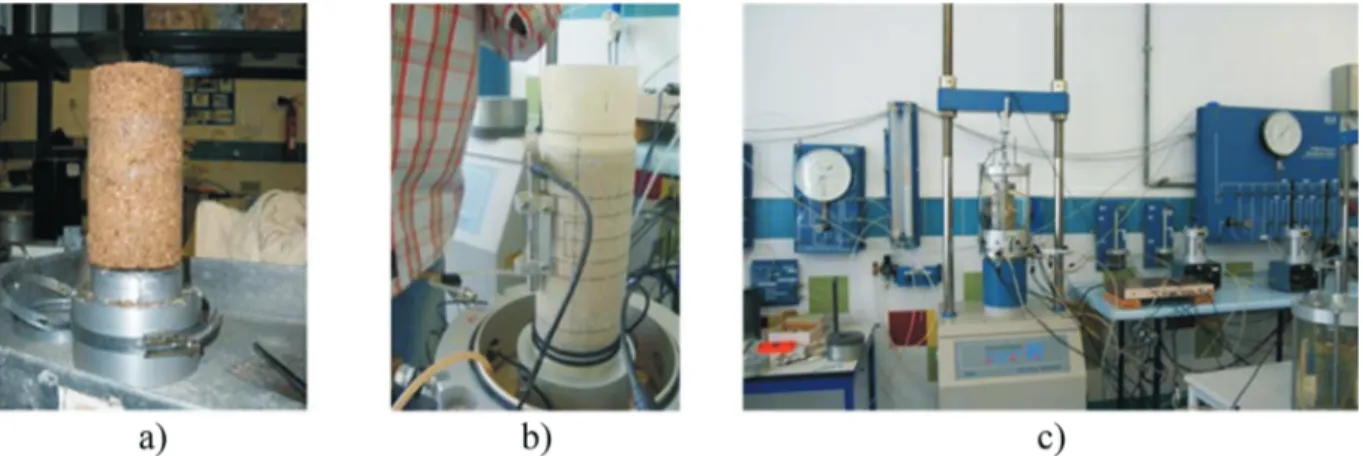
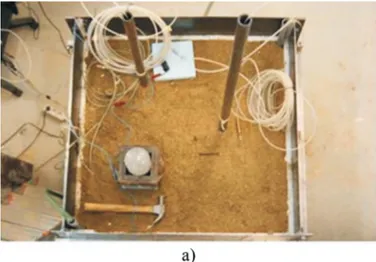
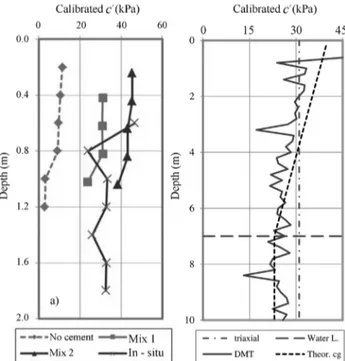
sedi-mentary transported soils, since the presence of a cemented matrix plays an important role on their strength and stiffness. Moreover, suction is frequent in natural profiles, which in residual soils creates several problems on the interpretation of in-situ test results. These two factors, cementation and suction, are contributing simultaneously as structuring factors. Cor-relations to deduce strength parameters in Portuguese granitic residual soils by Marchetti Dilatometer were previously es-tablished under a data base obtained in careful triaxial testing programs executed on “undisturbed” samples. However, the reference results were affected by sampling disturbance and space variability, and therefore somehow deviated from in-situ conditions. To solve these problems, a large calibration box was constructed to work with artificially cemented soils where DMT blades could be pre-installed and pushed-in. Water level, suction and seismic velocities were monitored dur-ing the experiment and a triaxial program was established in parallel on the same artificially cemented mixtures. As a re-sult, specific correlations to derive the cohesion intercept value and the angle of shearing resistance in saturated and unsaturated conditions were developed and subsequently tested in a well characterized experimental site. Herein, the re-sults of that experimental framework are presented and discussed.
Keywords: residual soils, Portuguese granitic formations, cohesion intercept, angle of shearing resistance, suction, in-situ
characterization, DMT.
1. Introduction
Residual soils strength characterization is not an easy task to estimate from in situ tests, due to its cohesive-frictional nature (Viana da Fonseca & Coutinho, 2008). Having two components - friction and cohesion - a strength will have to be evaluated from laboratory triaxial tests over undisturbed samples, since the evaluation of strength through in situ tests is usually conveyed under pure fric-tional granular soils, under the bias of angle of shearing re-sistance (frictional and dilatant components) or under Tresca type shear strength when geomaterials are analysed in total stresses, as it is the case of undrained shear strength in clayey soils, or the maximum total shear strength in very hard soils and soft rocks. This will be approximate to the concept of “cohesive” soils, where the strength is mostly a property explicitly non-frictional.
In the case of residual soils, cohesive strength is re-lated with the inter-particular bonding inherited from the parent rock that provided the cemented structure and with the contribution of suction, when this is present. On the other hand, the angle of shearing resistance comprises two portions, as stated above. One is related with the pure fric-tion that is mobilized during the relative movement be-tween the particles. The other concerning the resistance that is mobilized during this relative movement, required to de-stroy the natural inter-particular cementation and its spatial
organization, that is, its fabric. It should be stressed that due to the usually low void ratio of these materials typically there is an increase in volume (positive dilatancy) during shear.
The most straightforward way to characterize this type of strength is through triaxial tests, but the process has to face the important disadvantage related with sampling disturbance (Ferreira et al., 2011), where the partial loss of cementation structure is mostly unavoidable. The referred sampling disturbance and the discontinuous information re-lated to laboratory tests leave an important role to in-situ tests on residual soil characterization for routine analysis, especially those that induce small disturbance during in-stallation and allow the direct estimation of stress-strain re-sponse (Viana da Fonseca et al., 2011), such as pressu-remeters (self-boring pressuremeter, SBPT, in a first degree and, as a fair compromise, Ménard pressuremeter, PMT) and dilatometers (such as Marchetti Flat Dilatometer, DMT). Seismic tests may give relevant interpretation when associated to the more simple tools (seismic dilatometer SDMT, seismic piezocone SCPTu), as they give a refer-ence value of the small strain shear modulus (G0=r.Vs
2 ). Some important works modelling in-situ tests in residual soils have been undergoing, such as the new cavity expan-sion model that incorporates the effects of structure and its degradation (Mantaras & Schnaid, 2002; Schnaid &
Man-Nuno Bravo de Faria Cruz, PhD, Department of Geology and Geotechnics, MOTA-ENGIL / University of Aveiro, Vila Nova de Gaia, Portugal. e-mail: [email protected]. Carlos Manuel Gonçalves Rodrigues, PhD, Coordinator Professor, Department of Civil Engineering, Polytechnic Institute of Guarda, Guarda, Portugal. e-mail: [email protected]. António Joaquim Pereira Viana da Fonseca, PhD, Associate Professor, Department of Civil Engineering, University of Porto, Porto, Portugal. e-mail: [email protected]. Submitted on March 20, 2014; Final Acceptance on December 15, 2014; Discussion open until April 30, 2015.