R E S E A R C H A R T I C L E
Open Access
Hepatocyte growth factor signalizes peritoneal
membrane failure in peritoneal dialysis
Ana Paula Bernardo
1,3,4*, José C Oliveira
2, Olívia Santos
1, Maria J Carvalho
1, António Cabrita
1and Anabela Rodrigues
1,3Abstract
Background: Hepatocyte growth factor (HGF) counteracts peritoneal fibrosis in animal models and in-vitro studies, but no study explored effluent HGF in peritoneal dialysis (PD) patients with ultrafiltration failure (UFF). Our aim was to assess the relationship between effluent HGF with UF profile, free water transport (FWT) and small-solute transport.
Methods: We performed 4-hour, 3.86% PET with additional UF measurement at 60 minutes in 68 PD patients. MTACcreatinine,FWT, small-pore ultrafiltration, and effluent HGF were quantified.
Results: Effluent HGF negatively correlated with UF (r =−0.80, p = 0.009) and FWT (r = −0.69, p = 0.04). Patients with UFF had higher dialysate HGF (103 pg/mL vs 77 pg/mL, p = 0.018) and, although not statistically significant, those with FWT compromise had also higher dialysate HGF compared with subgroup of UFF without FWT compromise (104 pg/mL vs 88 pg/mL, p = 0.08). FWT≤ 45% without clinical UFF was documented in some patients who also had increased effluent HGF.
Conclusions: Dialysate HGF concentration is significantly higher among patients with UFF, specially, if FWT is impaired, being a sign of peritoneal membrane deterioration.
Keywords: Hepatocyte growth factor, Peritoneal membrane, Ultrafiltration failure, Water transport
Background
Ultrafiltration failure (UFF) is still a challenging complica-tion of peritoneal dialysis and its prevalence increases with time on PD [1-3]. In long-term patients, UFF is more se-vere and often associated with free water transport (FWT) compromise [4-6]. The two-in-one peritoneal equilibra-tion test allows simultaneous quantificaequilibra-tion of FWT and small pore ultrafiltration, being a simple method for timely detection of membrane failure, as we previously reported [7]. Since it is known that increased submesothelial fibro-sis is an early and progressive lesion ultimately associated with UFF [8], the search for an effluent marker related to membrane fibrosis process and exhibiting a good correl-ation with ultrafiltrcorrel-ation and FWT would be clinically im-portant. Such a marker could timely detect peritoneal membrane failure. Besides it should be desirable that such
marker could signalize peritoneal membrane deterioration even before clinically relevant UFF.
Hepatocyte growth factor (HGF) is known to play a crucial role in the repairing process of tissues and pre-venting organ fibrosis [9-12]. Yu et al. demonstrated, for the first time, that human peritoneal mesothelial cells constitutively synthesized HGF [13], and that treatment of human peritoneal mesothelial cells with HGF blocks high glucose-induced epithelial-to-mesenchymal transi-tion (EMT). More recently, Ueno T, et al. showed that HGF secreted by mesenchymal stem cells was implicated in the inhibition of the transforming growth factor β1 signaling and ameliorated peritoneal fibrosis in an ex-vivo study [12]. It is thus relevant to increase the know-ledge on HGF clinical value, in patients under PD, as it may possibly point to new diagnostic opportunities and therapeutic avenues. Therefore clinical investigation under this subject is mostly important and needed.
Impaired FWT is assumed to indicate a more severe functional and structural membrane lesion due to aquaporin disfunction or interstitial changes [6,14-16], * Correspondence:[email protected]
1Nephrology Department, St. António Hospital - Oporto Hospital Center,
Oporto, Portugal
3UMIB/ICBAS/UP, Oporto, Portugal
Full list of author information is available at the end of the article
© 2014 Bernardo et al.; licensee BioMed Central. This is an Open Access article distributed under the terms of the Creative Commons Attribution License (http://creativecommons.org/licenses/by/4.0), which permits unrestricted use, distribution, and reproduction in any medium, provided the original work is properly credited. The Creative Commons Public Domain Dedication waiver (http://creativecommons.org/publicdomain/zero/1.0/) applies to the data made available in this article, unless otherwise stated.
but there are no clinical studies exploring the associa-tions between effluent HGF, ultrafiltration failure, FWT and small-solute transport. For that reason, we per-formed a clinical investigation in order to assess, in a prevalent PD population, the relation between dialysate HGF and the ultrafiltration profile, FWT quantification, and small-solute transport.
Methods
Patients and procedures
This cross sectional study enrolled 68 patients of our Unit. All the patients performed a 4-hour, 3.86% glucose modified peritoneal equilibration test (PET) with total temporary drainage at 60 minutes [“Two-in-one” proto-col, as published before [7]]. This protocol allows free water transport quantification, beyond a simple calcula-tion of sodium sieving [7]. None of the patients had peritonitis during the study or the preceding 6 weeks. During the procedure, we used PD solutions low in glu-cose degradation products, according to the individual patient’s prescription. The volume of dialysis solution was determined by weight, without flushing the system and before filling the peritoneum. Blood and dialysate samples (each approximately 10 mL) were taken at in-stillation of the dialysate and after 60 and 240 minutes. At 60 minutes, we performed an additional measure-ment of UF by total drainage of the peritoneal cavity. This drained volume was weighed and then immediately reinfused. Finally, after 240 minutes, the peritoneal cav-ity was drained and the volume obtained was weighed.
PETs with an ultrafiltered volume≤ 400 mL/4 h were
considered to represent ultrafiltration failure (UFF). All patients provided written informed consent for participation, and the study was approved by the Ethics
Committee of St. António Hospital – Oporto Hospital
Center.
Measurements
Creatinine and sodium were measured both in plasma and dialysate. For creatinine, the Jaffé compensated method was used. The dialysate creatinine concentration was cor-rected for interference by glucose according to our labora-tory standards. Sodium was measured using indirect ion-selective electrodes. Effluent samples taken at 4 hour were
immediately stored at −70°C, until they were used to
measure HGF, VEGF and CA125. Effluent CA125 was de-termined with an electrochemiluminescence method on an automated analyzer (COBAS e-411, Roche Diagnostics GmbH). Effluent HGF and VEGF levels were determined by ELISA technique according to the manufacturer’s instructions (IBL – Immuno-Biological Laboratories Co. Ltd). The intra and inter-assay variations were 8,8%% and 10,0%, respectively for HGF and 5,9%, and 9,4% for VEGF. The sensitivity was 11 pg/mL for HGF and 1 pg/mL for
VEGF. Both the assays are considered highly specific for the cytokines, and no significant cross-reactivity was observed.
Calculations
Patients were characterized by peritoneal transport status as described by Twardowski et al. [17]. The MTACcreatinine
was calculated by the simplified Garred model [18]. FWT and UF through the small pores (SPUF) at 60 mi-nutes were calculated as we previously described [7]. Using a simple algorithm, we also performed a correction for FWT as described by Venturoli and Rippe [19].
Statistical analysis
Except for time on PD, HGF, HGF/CA125 and VEGF/ CA125, all variables had normal distribution. Results are expressed as mean ± SD or as median and interquartile range.
Pearson correlation analysis was used in order to ex-plore possible relations between HGF (with logarithmic transformation) and ultrafiltration profile, FWT and small-solute transport.
For comparison of small solute transport, water trans-port pathways and effluent markers between patients with and without ultrafiltration failure, Mann–Whitney U test was used.
In order to study our patients ultrafiltration failure profile we made a comparison of small solute transport, water transport pathways and effluent markers between patients with FWT≤ 45% and D/PCreatinine≥ 0.81 and
pa-tients without FWT compromise and non-fast transport category, using Mann–Whitney U test.
Unpaired Student t-Test or Mann Whitney U-test to
compare patients with FWT≤ 45% and FWT > 45%, as
appropriate, according to the variables involved.
Results
Solute, fluid transport parameters and concentration of cytokines in dialysate
Table 1 summarizes the peritoneal transport characteristics evaluated with a combined (“two-in-one”) PET performed in 68 study patients [35 men; mean age: 50 ± 14 years; 14 patients were diabetic; 16 were anuric; 36 were on APD; PD vintage 18.7 ± 23.5 months (range 1 – 121 months)]. According to small solute transport characteristics, 1 (1.5%) patient was classified as slow transporter (D/PCreatinine≤
0,49), 10 (14.7%) as slow-average (0,50≤ D/PCreatinine≤
0.64), 41 (60.3%) as fast-average (0,65≤ D/PCreatinine≤ 0.80),
and 16 (23.5%) as fast transporters (D/PCreatinine≥ 0,81).
Concerning water transport pathways, FWT accounted for 37.15% of the UF at 60 minutes, and once corrected (for so-dium diffusion, cumulative UF volume through the large pores, and cumulative lymphatic absorption at 60 minutes), its contribution increased to a mean value of 45.46%.
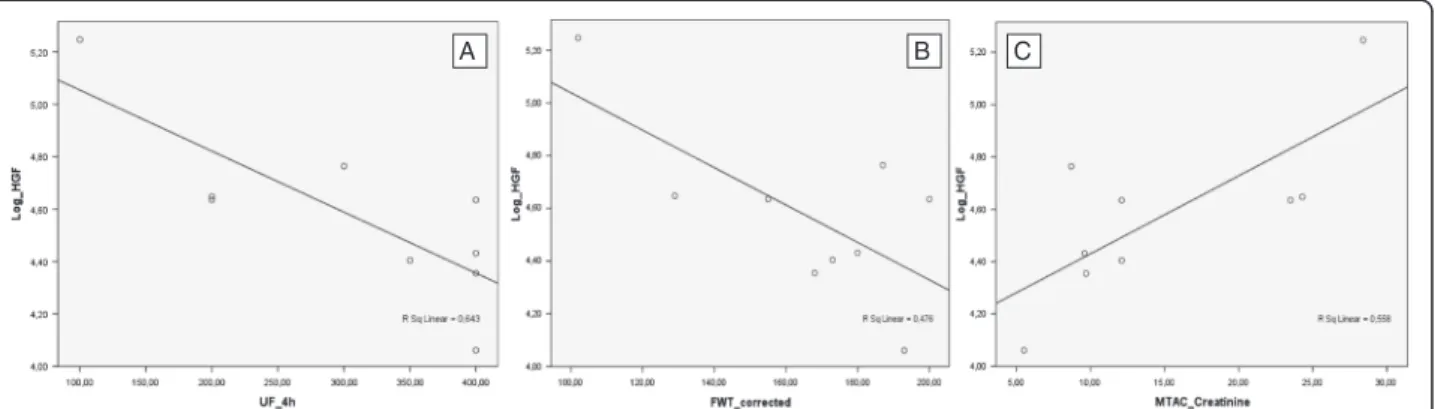
HGF correlations with ultrafiltration, FWT and small-solute transport
HGF measured in the effluent significantly correlated with total ultrafiltration at a 4 h, 3.86% glucose PET (r =−0.358, p = 0.003), with FWT (r = −0.407, p = 0.001) and MTACcreatinine (r = 0.355, p = 0.003). These
correla-tions were even stronger when we focused the analysis in patients with ultrafiltration failure (Figures 1A,B,C). In those patients, HGF exhibited a strong negative correl-ation with total ultrafiltrcorrel-ation and FWT (r =−0.802, p = 0.009 and r =−0.690, p = 0.04, respectively) and a strong
positive correlation with MTACcreatinine (r = 0.747, p =
0.021). No correlation was found between dialysate HGF concentration and small pore water transport (neither in global population, nor in the UFF group).
Patients with ultrafiltration failure compared with stable patients
Among the 68 study patients, 9 (13.2%) had UFF (total UF≤ 400 mL/4 h). Although not statistically significant, patients with UFF had been on PD for a longer time, had higher D/Pcreatinineand MTACcreatinine(Table 2). HGF
con-centration was significant higher in patients with UFF (median 103.0 pg/mL IQR [79.8–110.8]) compared with stable patients (median 77.1 pg/mL IQR [68.1–92.6], p = 0.018). Although not statistically significant, patients with UFF had also a higher ratio HGF/CA125 (Table 2).
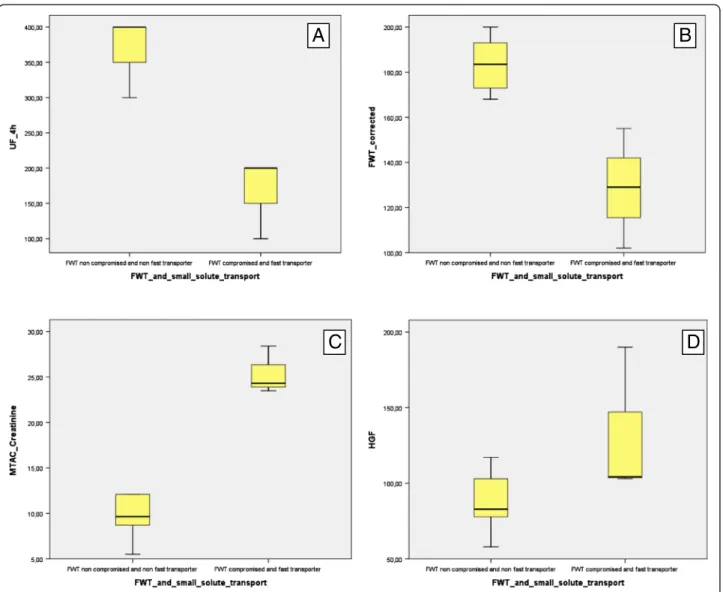
Ultrafiltration failure profile
From the 9 patients with UFF, 3 had a more severe profile
characterized by FWT compromise (FWT ≤45%) and
in-creased (D/Pcreatinine≥ 0,81). Those patients had significant
lower ultrafiltration volume at a 4 h PET (166.7 ± 57.4 mL vs 375.0 ± 41.8 mL, p = 0.024), lower FWT quantification (128.67 ± 26.50 mL vs 183.5 ± 12.14 mL, p = 0.024) and
higher MTACcreatinine (25.40 ± 2.63 mL/min vs 9.62 ±
2.45 mL/min, p = 0.024) (Figure 2A,B,C). Although not sta-tistically significant, patients with the more severe UFF pro-file had also higher values of HGF measured in the effluent (104.3 pg/mL vs 88.94 pg/mL, p = 0.085) (Figure 2D).
Tree other patients showed a less severe UFF profile, with increased effective capillary surface but preserved FWT (>45%). And still 3 incident patients (3– 6 months on PD), were average transporters with preserved FWT, in whom higher lymphatic absorption was by exclusion presumed.
Table 1 Peritoneal transport characteristics and effluent cytokines in 68 stable patients assessed during a 4-hour, 3.86% glucose peritoneal equilibration test with temporary drainage at 60 minutes
Variable Mean ± SD Median (IQR 25%-75%)
Total UF at 4 h (mL) 669,12 ± 226,76 SPUF (mL) 323,36 ± 129,34 FWT (mL) 183,26 ± 63,02 FWTcorrected(mL) 224,12 ± 66,51 %FWT 37,15 ± 11,79 %FWTcorrected 45,46 ± 11,11 D/PCreatinine 0,76 ± 0,12
MTACCreatinine(mL/min) 11,32 ± 7,14
Effluent HGF (pg/mL) 77,17 (68,83– 94,31) Effluent VEGF (pg/mL) 13,96 ± 4,92
CA125 (U/mL) 19,57 ± 11,31
SD = standard deviation; UF = ultrafiltration; SPUF = UF through the small pores at 60 minutes; FWT = free water transport at 60 minutes; FWTcorrected= FWT with an
algorithm correction according to Venturoli and Rippe [16]; MTAC = mass transfer area coefficient; D/P = dialysate-to-plasma ratio; HGF = hepatocyte growth factor; VEGF = vascular endothelial growth factor; CA 125 = cancer antigen 125.
Figure 1 HGF correlations with ultrafiltration, FWT and small-solute transport. (A) Correlation between effluent hepatocyte growth factor (HGF) and total ultrafiltration at a 4 h, 3.86% glucose PET (UF240), in patients with ultrafiltration failure (Pearson r =−0.802, p = 0.009); (B) correlation between effluent hepatocyte growth factor (HGF) and FWT corrected according to Venturoli and Rippe [16], in patients with ultrafiltration failure (Pearson r =−0.690, p =0.04); (C) correlation between effluent hepatocyte growth factor (HGF) and creatinine mass transfer area coefficient (MTACcreatinine), in patients with ultrafiltration failure (Pearson r = 0.747, p = 0.021).
FWT profile in patients without UFF
From the 59 studied patients without UFF, 33 had a
FWT≤45%. Those patients had a mean UF volume at 4 h
PET equivalent to patients with FWT > 45% (Table 3). Al-though not statistically different, patients with FWT≤ 45% had higher effluent HGF, when compared with patients with FWT > 45%. In spite of higher effluent HGF concen-tration, the HGF/CA125 ratio was significantly lower in
patients without UFF and FWT≤45% compared with
pa-tients without UFF and FWT >45% (3.65 IQR [ 2.96-5.60] vs 5.19 IQR 4.02-8.37], p = 0.014).
Discussion
To our knowledge, the present study is the first to report a clinical significant relation between HGF measured in the effluent and ultrafiltration profile, FWT quantifica-tion and small-solute transport in peritoneal dialysis pa-tients. Since HGF is involved in the process of peritoneal submesothelial fibrosis [12,13], this study also suggest some structural-functional correlations.
Although impaired FWT is frequently associated to aquaporin dysfunction, several studies provided indirect evidence that FWT can also be impaired in situations of decreased peritoneal water permeability due to interstitial changes, especially in long term patients [6]. Simulations of osmotic ultrafiltration failure in CAPD using a serial three-pore membrane/fiber matrix model [14] documented the uncoupling of small solute transport from LpS in computer simulations of UFF, whenever changes both in vasculature and in interstitium are taken into account, supporting fur-ther the role of the peritoneal membrane interstitium in fluid transport. Moreover, Devuyst and Rippe stated in a recent review [16] that reduced LpS in long-term PD has been attributed to reductions in AQP1-meditated water transport, but it might also be the result of a combination of increased vascularization and fibrotic scar tissue in the peritoneum.
When we analyze the reasons for UFF in our study we distinguish 3 groups of patients. Three had a more se-vere profile characterized by FWT compromise (FWT ≤45%) on top of increased effective capillary surface, also with higher values of effluent HGF. Three patients pre-sented an increased effective capillary surface but FWT was not impaired. Another 3 incident patients were aver-age transporters with normal FWT. A high effective lymphatic absorption rate could be the reason for UFF in those incident patients since high lymphatic absorp-tion is recognized to be mostly a cause of inherent UFF [5]. This variability in UFF patterns that we found was also documented by Waniewsky et al. [15] that recog-nized that UFF due to high peritoneal absorption could be associated with normal or decrease fractional contri-bution by transcellular pores to hydraulic conductivity. It is noteworthy that mean HGF in those 3 patients (with a functional UFF) was significantly lower com-pared with the 3 patients that had impaired FWT [77.84 (67.9– 79.8) vs 104.3 (103.7 – 147.16), p = 0.05].
In contrast with previous studies [4,6,20], MTACcreatinine
was higher but not statistically different between patients with and without UFF. This is due to the presence of many incident fast transporters (mean time on PD 6 ± 4 months) in the non UFF group.
Report and interpretation of causes of UFF as well as absolute and fractional FWT may vary according to the PD vintage. Our results are in accordance with Parikova et al., [6] that documented an early stage UFF associated with decrease of absolute FWT dependent on increased effective capillary surface without significant decrease of FWT contribution, while later the loss of osmotic con-ductance to glucose lead to a significant decrease of FWT fraction. In fact, all 9 patients with UFF had a sig-nificant decrease in absolute FWT compared with pa-tients without UFF, but only 3 had a reduction in FWT contribution to 60 minutes ultrafiltration.
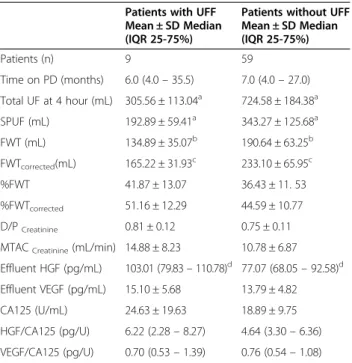
Table 2 Comparison of small solute transport, water transport pathways and effluent markers between patients with and without ultrafiltration failure
Patients with UFF Mean ± SD Median (IQR 25-75%)
Patients without UFF Mean ± SD Median (IQR 25-75%) Patients (n) 9 59 Time on PD (months) 6.0 (4.0– 35.5) 7.0 (4.0– 27.0) Total UF at 4 hour (mL) 305.56 ± 113.04a 724.58 ± 184.38a SPUF (mL) 192.89 ± 59.41a 343.27 ± 125.68a FWT (mL) 134.89 ± 35.07b 190.64 ± 63.25b FWTcorrected(mL) 165.22 ± 31.93 c 233.10 ± 65.95c %FWT 41.87 ± 13.07 36.43 ± 11. 53 %FWTcorrected 51.16 ± 12.29 44.59 ± 10.77 D/PCreatinine 0.81 ± 0.12 0.75 ± 0.11
MTACCreatinine(mL/min) 14.88 ± 8.23 10.78 ± 6.87
Effluent HGF (pg/mL) 103.01 (79.83– 110.78)d 77.07 (68.05– 92.58)d Effluent VEGF (pg/mL) 15.10 ± 5.68 13.79 ± 4.82 CA125 (U/mL) 24.63 ± 19.63 18.89 ± 9.75 HGF/CA125 (pg/U) 6.22 (2.28– 8.27) 4.64 (3.30– 6.36) VEGF/CA125 (pg/U) 0.70 (0.53– 1.39) 0.76 (0.54– 1.08)
SD = standard deviation; UF = ultrafiltration; SPUF = UF through the small pores at 60 minutes; FWT = free water transport at 60 minutes; FWTcorrected= FWT with an
algorithm correction according to Venturoli and Rippe [16]; MTAC = mass transfer area coefficient; D/P = dialysate-to-plasma ratio; HGF = hepatocyte growth factor; VEGF = vascular endothelial growth factor; CA 125 = cancer antigen 125.
a
Mann–Whitney U test p <0.0001, comparing patients with and without ultrafiltration failure.
bMann–Whitney U test p = 0.006, comparing patients with and without
ultrafiltration failure.
c
Mann–Whitney U test p = 0.002, comparing patients with and without ultrafiltration failure.
dMann–Whitney U test p = 0.018, comparing patients with and without
Moreover, our study adds further clinical evidence to the recent report from Nakamura S. et al. [21]. Those au-thors studied focal HGF expression in peritoneum biop-sies of a small number of peritoneal dialysis patients, with and without UFF. Although they did not measure dialysate HGF concentration, they demonstrated an increased ex-pression of HGF in peritoneal tissues of CAPD patients with low ultrafiltration capacity compared with those with a normal ultrafiltration profile. Given the already men-tioned protective effects of HGF on peritoneal fibrosis [11-13], we hypothesized that the increased peritoneal HGF expression demonstrated by Nakamura S. et al. [21], and the higher dialysate HGF concentration that we found in our patients with UFF, can be seen as a react-ive mechanism to peritoneal membrane lesion. This is
also supported by the fact that patients with more se-vere forms of UFF (with FWT compromise besides an increase in small-solute transport), presented higher di-alysate HGF concentration.
The effluent HGF concentration on patients under PD was addressed, until now, by one single clinical study [22]. However, Mizuiri S et al. [22], only compared dialysate HGF concentration according to small solute transport status, and found that fast transporters had higher effluent HGF concentration compared with others small solute transport categories, which we also reproduce (data not shown). Unfortunately such study gave no information about UFF or water transport pathways quantification.
As others [23] we also found significantly higher dialys-ate VEGF concentration in fast transporters compared Figure 2 Ultrafiltration failure profile. Comparison within patients with UFF, between 6 patients with non compromised FWT and non fast transporters versus 3 patients with FWT≤ 45% and fast transporters: (A) Total ultrafiltration at a 4 h, 3.86% glucose PET (375.0 ± 41.83 mL vs 166.67 ± 57.74 mL, p = 0.024). (B) FWT quantification at 60 minutes in a 4 h, 3.86% glucose PET (183.5 ± 12.14 mL vs 128.67 ± 26.50 mL, p = 0.024) (C) MTACcreatinine(9.62 ± 2.45 mL/min vs 25.40 ± 2.63 mL/min, p = 0.024). (D) Effluent Hepatocyte Growth Factor (88.94 pg/mL vs 104.3 pg/mL,
with non-fast transporters (data not shown). Although it remains uncertain if this increase in VEGF production cor-responds to an increased production of intraperitoneal vasoactive substances, as might occur in incident fast trans-porters, or if it is the result of epithelial-to-mesenchymal transition, dialysate VEGF was not discriminative of UFF. On the contrary, effluent HGF was informative not only about UFF but also highlighted more severe UFF profile, with FWT compromise.
We are aware that the mass of mesothelial cells could affect the levels of intraperitoneal growth factors in PD pa-tients. Although there are some controversies about the use of CA125 as an index of mesothelial cells mass or their functional properties [24-26], we also documented a higher HGF/CA125 ratio in UFF patients compared with stable
patients, indicating a reactive increased HGF production beyond that we would expect for the mesothelial cell mass. Since there are no clinical studies that had examined plasma and effluent HGF, and we found a correlation with small-solute transport, we might question whether effluent HGF concentration could depend on plasma HGF levels. We think that this is not plausible for various reasons. First, the peritoneal permeability is expected to be poor, since HGF is a heterodimeric molecule composed of a 69 KDa alpha subunit and a 34 KDa beta subunit. Second and mostly important, human peritoneal cells constitu-tively synthesized HGF [13]. For these reasons, we believe that the HGF protein detected in the effluent is locally produced.
The use of effluent biomarkers as an early sign of peri-toneal membrane alterations is currently under debate [27-29] specially because clinical factors cannot give an accurate individual prediction for EPS [30].
In a very recent report [27], MCP-1, IL-6 and CCL15 were found at higher levels in the dialysate of patients who subsequently developed EPS. However, by logistic regres-sion analysis, these cytokines did not improve prediction of future EPS above known clinical factors, as PD vintage and peritoneal small solute transport. On the contrary, Sampimon et al. [28] concluded that dialysate appearance rate of CA125 and IL-6 combined was potentially useful for an early diagnosis of EPS. None of these studies ex-plored the associations between the cytokines measured in the dialysate and ultrafiltration or water transport path-ways in a peritoneal equilibration test. These would be of great importance as we know that in the 2 years that pre-cede an EPS diagnosis, a proportion of patients with EPS present an uncoupling between the membrane ultrafiltra-tion capacity and the peritoneal membrane small solute transport [30]. This fact gives even more strength to the necessity of finding a biomarker that correlates both with ultrafiltration and with water transport pathways, and not only to the membrane small solute transport status. HGF can be easily measured, without specific preparation of the dialysate sample, by commercially available highly specific assay (IBL-Immuno-Biological Laboratories Co.Ltd), with acceptable inter-assay variability (10%); it is constitutively synthesized by human peritoneal mesothelial cells, blocks high glucose-induced epithelial-to-mesenchymal transition (EMT) and was implicated in the inhibition of the trans-forming growth factor β1 signaling, ameliorating peri-toneal fibrosis in an ex-vivo study [13]. According to our present investigation, dialysate HGF concentration in-creases as ultrafiltration dein-creases in a 4-hour, 3,86% glu-cose PET. The fact that dialysate HGF concentration is even higher among patients with FWT compromise and fast transport status increases the likelihood of effluent HGF concentration being related with peritoneal deterior-ation, as a reactive repairing mechanism, and not with a
Table 3 FWT profile in patients without UFF: comparison of small solute transport, water transport pathways and effluent markers between patients with FWT≤ 45% and FWT > 45%
Patients without ultrafiltration failure Patients with FWT≤ 45% Mean ± SD Median (IQR 25-75%) Patients with FWT > 45% Mean ± SD Median (IQR 25-75%) Patients (n) 33 26 Time on PD (months) 6.0 (4.0– 19.0) 8.5 (5.0– 30.25) Total UF at 4 hour (mL) 739.39 ± 210.56 705.77 ± 146.51 SPUF (mL) 412.9 ± 108.54a 254.81 ± 83.74a FWT (mL) 173.42 ± 60.43b 212.50 ± 60.98b FWTcorrected(mL) 221.51 ± 66.11 247.81 ± 63.97 %FWT 29.10 ± 6.50a 45.74 ± 9. 66a %FWTcorrected 37.56 ± 5.62 a 53.52 ± 8.96a D/PCreatinine 0.76 ± 0.08 0.73 ± 0.14 MTACCreatinine (mL/min) 10.45 ± 5.14 11.20 ± 8.69 Effluent HGF (pg/mL) 77.17 (68.42– 93.89) 75.89 (66.47– 86.51) Effluent VEGF (pg/mL) 14.19 ± 4.96 13.28 ± 4.68 CA125 (U/mL) 22.28 ± 10.90c 14.56 ± 5.82c HGF/CA125 (pg/U) 3.65 (2.96– 5.60)d 5.19 (4.02 – 8.37)d VEGF/CA125 (pg/U) 0.68 (0.51– 0.90) 0.89 (0.67– 1.29)
Variables presented as mean ± SD or median (interquartile range) accordingly. SD = standard deviation; UF = ultrafiltration; SPUF = UF through the small pores at 60 minutes; FWT = free water transport at 60 minutes; FWTcorrected= FWT with an
algorithm correction according to Venturoli and Rippe [16]; MTAC = mass transfer area coefficient; D/P = dialysate-to-plasma ratio; HGF = hepatocyte growth factor; VEGF = vascular endothelial growth factor; CA 125 = cancer antigen 125. a) T-test p <0.0001, comparing patients with FWT≤ 45% and FWT > 45%. b) T-test p = 0.017, comparing patients with FWT≤ 45% and FWT > 45%. c) T-test p = 0.001, comparing patients with FWT≤ 45% and FWT > 45%. d) Mann–Whitney U test p = 0.014, comparing patients with FWT ≤ 45% and FWT > 45%.
functional characteristic, as for example an higher effective lymphatic absorption rate, hardly measurable in clinic.
In this study we reported a mean FWTcorrectedfraction
of 45%, which is in line with our previous studies [7], and with the FWT fraction reported by La Milia [31]. A FWT≤ 45% is clinical relevant in patients with UFF, since it may signalize aquaporin dysfunction or interstitial fibro-sis with glucose osmotic conductance compromise, with important repercussions for PD prescription. However, there is no knowledge yet about the clinical value of FWT fraction on patients without UFF. We think that this is an-other relevant aspect of our investigation: although we did find that patients without UFF but with FWT fraction ≤45% had higher dialysate HGF concentration compared with patients with preserved FWT fraction, the first group had a significant lower mean value of HGF/CA125 ratio compared with the second one. This trend is completely different from that we observed in patients with UFF, in whom we found a higher HGF/CA125 ratio. We hypothe-sized that this may represent an intermediate level of peri-toneal dysfunction, where the patient may already have interstitial changes that lead to a reactive increase in HGF production, while not severe enough to present as UFF. At this point, those patients may still have a preserved meso-thelial cell mass which explains the lower HGF/CA125 ra-tio that we found in this group. Aging, uremia, diabetes are indeed often associated with membrane changes already at PD start possibly justifying in some patients selective FWT compromise in absence of clinically relevant UFF [32-35].
Our study is limited by its cross sectional design and small number of patients with UFF. A longitudinal study is being conducted in order to document the dynamic profile of HGF production and its relationship with peri-toneal membrane water transport changes. More studies are needed to increase the knowledge on HGF clinical value, in patients under PD, as it may possibly point to new diagnostic opportunities and therapeutic avenues in the ultrafiltration failure field.
Conclusions
Since HGF ameliorated peritoneal fibrosis in anex-vivo study [12], a clinical study as ours looks opportune. Our results demonstrated, for the first time, that dialysate HGF concentration is significantly higher among pa-tients with ultrafiltration failure, specially if free water transport is impaired, being an useful marker of progres-sive peritoneal deterioration.
Competing interests
The authors declare that they have no competing interests. Authors’ contributions
APB and AR designed the study, analyzed and interpreted the data. JCO, OS, MJC and AC gave scientific contributions in their field of expertise. All authors revised the manuscript and contributed to its improvement. All authors read and approved the final manuscript.
Acknowledgements
This study was partially performed with the help of investigations grants from Sociedade Portuguesa de Nefrologia. This work was also supported by UMIB/ICBAS– University of Porto (UP). Multidisciplinary Unit for Biomedical Research (UMIB) is funded by grants from Foundation for Science and Technology (Fcomp-01-0124-FEDER-015896).
Author details
1Nephrology Department, St. António Hospital - Oporto Hospital Center,
Oporto, Portugal.2Clinical Pathology, St. António Hospital - Oporto Hospital Center, Oporto, Portugal.3UMIB/ICBAS/UP, Oporto, Portugal.4Largo Prof.
Abel Salazar, 4099-001 Porto, Portugal.
Received: 5 June 2014 Accepted: 11 December 2014 Published: 17 December 2014
References
1. Heimbürger O, Waniewski J, Werynski A, Tranaeus A, Lindholm B: Peritoneal transport in CAPD patients with permanent loss of ultrafiltration capacity. Kidney Int 1990, 38:495–506.
2. Krediet RT, Imholz AL, Struijk DG, Koomen GC, Arisz L: Ultrafiltration failure in continuous ambulatory peritoneal dialysis. Perit Dial Int 1993, 13(Suppl 2):S59–S66.
3. Krediet RT, Lindholm B, Rippe B: Pathophysiology of peritoneal membrane failure. Perit Dial Int 2000, 20(Suppl4):S22–S42.
4. Smit W, Schouten N, van den Berg N, Langedijk MJ, Struijk DG: Krediet RT; Netherlands Ultrafiltration Failure Study Group. Analysis of the prevalence and causes of ultrafiltration failure during long-term peritoneal dialysis: a cross-sectional study. Perit Dial Int 2004, 24:562–570.
5. Smit W, Parikova A, Struijk DG, Krediet RT: The difference in causes of early and late ultrafiltration failure in peritoneal dialysis. Perit Dial Int 2005, 25(S3):S41–S45. 6. Parikova A, Smit W, Struijk DG, Krediet RT: Analysis of fluid transport
pathways and their determinants in peritoneal dialysis patients with ultrafiltration failure. Kidney Int 2006, 70:1988–1994.
7. Bernardo AP, Bajo MA, Santos O, Del Peso G, Carvalho MJ, Cabrita A, Selgas R, Rodrigues A: Two-in-one protocol: simultaneous small-pore and ultrasmall-pore peritoneal transport quantification. Perit Dial Int 2012, 32(5):537–544. 8. Del Peso G, Jiménez-Heffernan JA, Bajo MA, Aroeira LS, Aguilera A,
Fernández-Perpén A, Cirugeda A, Castro MJ, de Gracia R, Sánchez-Villanueva R, Sánchez-Tomero JA, López-Cabrera M, Selgas R: Epithelial-to-mesenchymal transition of mesothelial cells is an early event during peritoneal dialysis and is associated with high peritoneal transport. Kidney Int Suppl. 2008, (108):S26–33. 9. Shukla MN, Rose JL, Ray R, Lathrop KL, Ray A, Ray P: Hepatocyte growth
factor inhibits epithelial to myofibroblast transition in lung cells via Smad7. Am J Respir Cell Mol Biol 2009, 40:643–653.
10. Yang J, Dai C, Liu Y: A novel mechanism by which hepatocyte growth factor bloks tubular epithelial to mesenchymal transition. J Am Soc Nephrol 2005, 16:68–78.
11. Nakamura S, Niwa T: Pyridoxal phosphate and hepatocyte growth factor prevent dialysate-induced peritoneal damage. J Am Soc Nephrol 2005, 16:144–150.
12. Ueno T, Nakashima A, Doi S, Kawamoto T, Honda K, Yokoyama Y, Doi T, Higashi Y, Yorioka N, Kato Y, Kohno N, Masaki T: Mesenchymal stem cells ameliorate experimental peritoneal fibrosis by suppressing inflammation and inhibiting TGF-β1 signaling. Kidney Int 2013, 84:297–307.
13. Yu MA, Shin KS, Kim JH, Kim YI, Chung SS, Park SH, Kim YL, Kang DH: HGF and BMP-7 ameliorate high glucose-induced epithelial-to-mesenchymal transition of peritoneal mesothelium. J Am Soc Nephrol 2009, 20:567–581. 14. Rippe B, Venturoli D: Simulations of osmotic ultrafiltration failure in CAPD
using a serial three-pore membrane/fiber matrix model. Am J Physiol Renal Physiol 2007, 292:F1035–F1043.
15. Waniewski J, Debowska M, Lindholm B: Water and solute transport through different types of pores in peritoneal membrane in CAPD patients with ultrafiltration failure. Perit Dial Int 2009, 29:664–669. 16. Devuyst O, Rippe B: Water transport across the peritoneal membrane.
Kidney Int 2014, 85(4):750–758.
17. Twardowski ZJ, Nolph KO, Khanna R, Prowant BF, Ryan LP, Moore HL, Nielsen MP: Peritoneal equilibration test. Perit Dial Bull 1987, 7:138–147. 18. Garred LJ, Canaud B, Farrell PC: A simple kinetic model for assessing
peritoneal mass transfer in chronic ambulatory peritoneal dialysis. ASAIO J 1983, 6:131–137.
19. Venturoli D, Rippe B: Validation by computer simulation of two indirect methods for quantification of freee water transport in peritoneal dialysis. Perit Dial Int 2005, 25:77–84.
20. Waniewski J: Peritoneal fluid transport: mechanisms, pathways, methods of assessment. Arch Med Res 2013, 44:576–583.
21. Nakamura S, Tachikawa T, Tobita K, Miyazaki S, Sakai S, Morita T, Hirasawa Y, Weigle B, Pischetsrieder M, Niwa T: Role of advanced glycation end products and growth factors in peritoneal dysfunction in CAPD patients. Am J Kidney Dis 2003, 41(Suppl 1):S61–S67.
22. Mizuiri S, Hemmi H, Arita M, Tai R, Hattori Y, Muto A, Suzuki Y, Ohashi Y, Sakai K, Aikawa A: Effluent markers related to epithelial mesenchymal transition with adjusted values for effluent cancer antigen 125 in peritoneal dialysis patients. Int J Nephrol 2011, 2011:261040.
23. Pecoits-Filho R, Araújo MR, Lindholm B, Stenvinkel P, Abensur H, Romão JE Jr, Marcondes M, De Oliveira AH, Noronha IL: Plasma and dialysate Il-6 and VEGF concentrations are associated with high peritoneal solute transport rate. Nephrol Dial Transplant 2002, 17:1480–1486.
24. Rodrigues AS, Martins M, Korevaar JC, Silva S, Oliveira JC, Cabrita A: Castro e Melo J, Krediet RT. Evaluation of peritoneal transport and membrane status in peritoneal dialysis: focus on incident fast transporters. Am J Nephrol 2007, 27:84–91.
25. Krediet R: Dialysate cancer antigen 125 concentration as marker of peritoneal membrane status in patients treated with chronic peritoneal dialysis. Perit Dial Int 2001, 21:560–567.
26. Breborowicz A, Breborowicz M, Pyda M, Połubinska A, Oreopoulos D: Limitations of CA125 as an index of peritoneal mesothelial cell mass. Nephron Clin Pract 2005, 100:c46–c51.
27. Goodlad C, Tam FWK, Ahmad S, Bhangal G, North BV, Brown EA: Dialysate cytokine levels do not predict encapsulating peritoneal sclerosis. Perit Dial Int 2014, 34(6):594–604.
28. Sampimon DE, Korte MR, Barreto DL, Vlijm A, Waart R, Struijk DG, Krediet RT: Early diagnostic markers for encapsulating peritoneal sclerosis: a case–control study. Perit Dial Int 2010, 30:163–169.
29. Barreto DL, Coester AM, Struijk DG, Krediet RT: Can effluent matrix metalloproteinase 2 and plasminogen activator inhibitor 1 be used as biomarkers of peritoneal membrane alterations in peritoneal dialysis patients? Perit Dial Int 2013, 33(5):529–537.
30. Lambie ML, John B, Mushahar L, Huckvale C, Davies S: The peritoneal osmotic conductance is low well before the diagnosis of encapsulating peritoneal sclerosis is made. Kidney Int 2010, 78:611–618.
31. La Milia V, Di Filippo S, Crepaldi M, Del Vecchio L, Dell'Oro C, Andrulli S, Locatelli F: Mini-peritoneal equilibration test: a simple and fast method to assess free water and small solute transport across the peritoneal membrane. Kindey Int 2005, 68:840–846.
32. Williams JD, Craig KJ, Topley N, Von Ruhland C, Fallon M, Newman GR, Mackenzie RK: Williams GT; Peritoneal Biopsy Study Group. Morphologic changes in the peritoneal membrane of patients with renal disease. J Am Soc Nephrol 2002, 13:470–479.
33. Honda K, Hamada C, Nakayama M, Miyazaki M, Sherif AM, Harada T: Hirano H; Peritoneal Biopsy Study Group of the Japanese Society for Peritoneal Dialysis. Impact of uremia, diabetes, and peritoneal dialysis itself on the pathogenesis of peritoneal sclerosis: a quantitative study of peritoneal membrane morphology. Clin J Am Soc Nephrol 2008, 3:720–728.
34. Oliveira L, Rodrigues A: Previous renal replacement therapy time at start of peritoneal dialysis independently impact on peritoneal membrane ultrafiltration failure. Int J Nephrol 2011, 2011:685457. doi:10.4061/2011/ 685457. Epub 2011 Sep 29.
35. Shimaoka T, Hamada C, Kaneko K, Io H, Sekiguchi Y, Aruga S, Inuma J, Inami Y, Hotta Y, Horikoshi S, Kumasaka T, Tomino Y: Quantitative evaluation and assessment of peritoneal morphologic changes in peritoneal dialysis patients. Nephrol Dial Transplant 2010, 25(10):3379–3385. doi:10.1093/ndt/gfq194. Epub 2010 Apr 22.
doi:10.1186/1471-2369-15-201
Cite this article as: Bernardo et al.: Hepatocyte growth factor signalizes peritoneal membrane failure in peritoneal dialysis. BMC Nephrology 2014 15:201.
Submit your next manuscript to BioMed Central and take full advantage of:
• Convenient online submission
• Thorough peer review
• No space constraints or color figure charges
• Immediate publication on acceptance
• Inclusion in PubMed, CAS, Scopus and Google Scholar
• Research which is freely available for redistribution
Submit your manuscript at www.biomedcentral.com/submit