LYMPHOID NEOPLASIA
Variability in DNA methylation de
fines novel epigenetic subgroups of
DLBCL associated with different clinical outcomes
Nyasha Chambwe,1,2,3Matthias Kormaksson,4,5Huimin Geng,6Subhajyoti De,7,8,9Franziska Michor,10,11
Nathalie A. Johnson,12Ryan D. Morin,13,14David W. Scott,15Lucy A. Godley,16Randy D. Gascoyne,15,17Ari Melnick,18,19
Fabien Campagne,1,2and Rita Shaknovich19,20
1The HRH Prince Alwaleed Bin Talal Bin Abdulaziz Alsaud Institute for Computational Biomedicine,2Department of Physiology and Biophysics,3 Tri-Instituitional Training Program in Computational Biology and Medicine, and4Department of Public Health, Weill Cornell Medical Center, New York, NY;5IBM Research-Brazil, Rio de Janeiro, Brazil;6Department of Laboratory Medicine, University of California, San Francisco, San Francisco, CA;7Department of Medicine, University of Colorado School of Medicine, Aurora, CO;8Department of Biostatistics and Informatics, Colorado School of Public Health, Aurora, CO;9Molecular Oncology Program, University of Colorado Cancer Center, Aurora, CO;10Department of Biostatistics and Computational Biology, Dana-Farber Cancer Institute, Boston, MA;11Department of Biostatistics, Harvard School of Public Health, Boston, MA;12Department of Medicine, Jewish General Hospital, Montreal, QC, Canada;13Department of Molecular Biology and Biochemistry, Simon Fraser University, Burnaby, BC, Canada;14Michael Smith Genome Sciences Centre, and15Centre for Lymphoid Cancer, British Columbia Cancer Agency, Vancouver, BC, Canada;16Department of Medicine, The University of Chicago, Chicago, IL;17Department of Pathology, University of British Columbia, Vancouver, BC, Canada; and18Department of Pharmacology,19Division of Hematology and Oncology, and20Department of Pathology and Laboratory Medicine, Weill Cornell Medical College, New York, NY
Key Points
• Unsupervised clustering of DLBCLs based on DNA methylation changes identifies 6 novel epigenetic clusters. • Greater magnitude of
methylation changes correlates with worse clinical outcome.
Diffuse large B-cell lymphoma (DLBCL) is the most common aggressive form of non-Hodgkin lymphoma with variable biology and clinical behavior. The current classification does not fully explain the biological and clinical heterogeneity of DLBCLs. In this study, we carried out genomewide DNA methylation profiling of 140 DLBCL samples and 10 normal germinal center B cells using the HpaII tiny fragment enrichment by ligation-mediated polymerase chain reaction assay and hybridization to a custom Roche NimbleGen promoter array. We defined methylation disruption as a main epigenetic event in DLBCLs and designed a method for measuring the methylation variability of individual cases. We then used a novel approach for unsupervised hierarchical clustering based on the extent of DNA methylation variability. This approach identified 6 clusters (A-F). The extent of methylation variability was associated with survival outcomes, with significant differences in overall and progression-free survival. The novel clusters are characterized by disruption of specific biological pathways such as cytokine-mediated signaling, ephrin signaling, and pathways associated with apoptosis and cell-cycle regulation. In a subset of patients, we profiled gene expression and genomic variation to investigate their interplay with methylation changes. This study is the first to identify novel epigenetic clusters of DLBCLs and their aberrantly methylated genes, molecular associations, and survival. (Blood. 2014;123(11):1699-1708)
Introduction
Diffuse large B-cell lymphoma (DLBCL) is the most common subtype of B-cell non-Hodgkin lymphoma. DLBCLs are highly heteroge-neous; only about 60% of patients are responsive to the current standard-of-care chemotherapy: a regimen of rituximab combined with cyclophosphamide, doxorubicin, vincristine, and prednisolone (R-CHOP). The remaining 40% of patients have either primary refractory or relapsed disease with dismal outcome. DLBCLs are also highly heterogeneous at the molecular level. Gene expression profiling studies have defined 3 molecular subtypes: germinal center B-cell–like (GCB) DLBCL, activated B-cell–like (ABC), and primary mediastinal B-cell lymphoma.1,2These molecular subtypes were shown to have different prognostic outcomes, with the ABC subtype having the most unfavorable outcome. However, some cases of DLBCL cannot be
classified according to their gene expression profile, suggesting that DLBCL may harbor more genomic or epigenomic complexity that is not captured by gene expression profiling.3,4
Regulation of gene expression through epigenetic mechanisms such as DNA cytosine methylation is increasingly recognized as a hallmark of cancer.5-7DNA methylation is involved in critical pro-cesses such as normal cell development, cellular differentiation, genome imprinting, and X-chromosome inactivation.8-10Global DNA hypomethylation in cancer contributes to genomic instability,11whereas focal hypermethylation at promoters of tumor suppressors is recognized as contributing to neoplastic transformation.12,13In DLBLCs, promoter hypermethylation in the DNA repair enzyme MGMT is significantly associated with prognosis in DLBCL.14,15Furthermore, the importance
Submitted July 9, 2013; accepted December 22, 2013. Prepublished online as Blood First Edition paper, January 2, 2014; DOI 10.1182/blood-2013-07-509885.
Presented in abstract form at the 53rd annual meeting of the American Society of Hematology, San Diego, CA, December 12, 2011.
The online version of the article contains a data supplement.
There is an Inside Blood commentary on this article in this issue.
The publication costs of this article were defrayed in part by page charge payment. Therefore, and solely to indicate this fact, this article is hereby marked “advertisement” in accordance with 18 USC section 1734.
© 2014 by The American Society of Hematology
of DNA methylation in the biology of DLBCLs is underscored by distinct DNA methylation profiles of ABC and GCB DLBCLs.16-18
In addition to focal changes in DNA methylation, Hansen et al19 reported increased stochastic variation in DNA methylation across solid cancers and suggested that cancer methylomes can be described in terms of their variance from their corresponding cell of origin. Following this observation, De et al20demonstrated extensive intratumor and interpatient variability in DNA methylation in DLBCL. Building on these prior observations, we sought to investigate if DNA methylation differences between patients would help explain the observed bi-ological heterogeneity in DLBCL patient cohorts.
We hypothesized that patterns of DNA methylation could help classify DLBCLs into distinct biologically and clinically relevant subtypes. To test this hypothesis, we carried out genomewide DNA methylation profiling in a cohort of 140 DLBCL cases and 10 normal GCB cell (NGCB) controls. We clustered DLBCL cases based on how their methylome differs from NGCBs. This process defined 6 clusters in this DLBCL cohort. We found that the magnitude of methylation changes from NGCBs associates with survival in patients who have undergone R-CHOP treatment. We also found that changes in DNA methylation at specific loci target important biological processes such as cytokine-mediated signaling, ephrin signaling, and pathways associated with apoptosis and cell-cycle regulation.
Materials and methods
Sample collection
A total of 140 diagnostic de novo DLBCL samples were collected from individuals with de novo DLBCL at the British Columbia Cancer Agency, Canada. Supplemental Table 1 (available on the Blood Web site) presents characteristics of the study cohort. NGCBs were obtained from leftover tonsillectomy specimens at New York Presbyterian Hospital. All tissue collection was approved by the Weill Cornell Medical College Institutional Review Board and in accordance with the stipulations of the Declaration of Helsinki treaties.
HELP assay and data analysis
We measured DNA methylation using the published HpaII tiny fragment enrichment by ligation-mediated polymerase chain reaction (HELP) assay.21,22 The microarray design is documented in the Gene Expression Omnibus accession number GPL6604. Data from this study are publicly available by accessing Gene Expression Omnibus accession number GSE54200. HELP data were processed using standard pipeline as outlined in the HELP analysis package23from the R Bioconductor suite. Additional details can be found in the supplemental Methods.
Results
Identification of DNA methylation-based clusters in DLBCL
We profiled DNA methylation in 140 DLBCL cases and 10 NGCB cell samples using the HELP assay and hybridization to a custom-designed Roche NimbleGen array. This array represents approximately 50 000 CpGs favoring promoter regions of 14 000 genes. We carried out data processing, quality control analysis, and quantile normalization of these data and obtained the relative methylation signal (log2(HpaII/MspI)) for each HELP genomic fragment measured by the assay.
Given that lymphomas are characterized by extensive DNA methylation disruption as reported previously,20
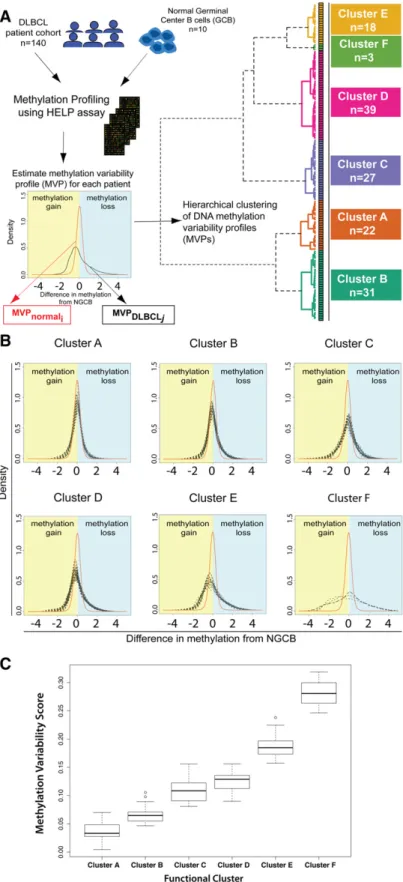
we hypothesized that clustering DLBCLs based on degree and direction of methylation changes would produce informative biologically distinct subgroups. We quantified DNA methylation disruption in the following way: for each HELP fragment, we calculated the relative methylation difference between each DLBCL case and the mean of NGCB control samples (supplemental Figure 1; see supplemental Methods for statistical details). We estimated a histogram of these methylation differences for each DLBCL case; the histogram counts how many HELP fragments in a DLBCL genome differ from controls at a certain level of methylation change. The spread of a histogram defines the variability between a DLBCL genome and that of NGCB controls. We refer to these histograms as methylation variability profiles (MVP). We defined the sample methylation variability score (MVS) as the difference in area under the curve between a given sample’s MVP and the expected MVP of NGCBs (supplemental Figure 1).
We then carried out unsupervised hierarchical clustering of the DLBCL samples that is conceptually novel in that it uses a similarity metric based on the difference in methylation variability between 2 samples (supplemental Methods). Unsupervised clustering identified 6 DNA methylation-based clusters in this DLBCL cohort (Figure 1A). To confirm that these 6 clusters are stable and reproducible, we performed consensus clustering. Briefly, this method repeats the clustering process on subsets of the complete dataset and checks how consistently samples are clustered together. Consensus clustering confirmed K 5 6 as an optimal choice for cluster number (supplemental Figure 2A-C).
We found a large MVS for DLBCLs, indicative of methylation changes of larger magnitude in DLBCL samples. Changes of greater magnitude are visible in the heavier left and right tails for DLBCL MVPs compared with the average NGCB MVP (Figure 1B). Clustering of the samples shows that DLBCL samples can be grouped by magnitude of methylation changes compared with controls (Figure 1B-C). DLBCL clusters were labeled A through F based on increasing magnitude of methylation changes from NGCBs, with cluster A having the smallest magnitude of methylation changes compared with NGCB and cluster F the largest. Clusters B, D, and E show a tendency toward hypomethylation in DLBCL (heavier right tail of the profiles, Figure 1B). Clusters A and C have a tendency toward hypermethylation. Cluster F shows the largest methylation changes with almost equal proportion of methylation gain and loss in different parts of the genome.
To test whether these changes occurred throughout the DLBCL genome, we assayed genomewide 5-methylcytosine (5-mC) content by liquid chromatography mass spectrometry in a subset of DLBCL tumors. We observed a global hypomethylation (mean 5-mC 4.9%) in DLBCLs compared with NGCBs (mean 5-mC 12.08%, supple-mental Figure 3). However, we found that genomewide 5-mC content was similar across DLBCL clusters, ranging from around 5% for clusters A-D to 3.73% for cluster F. Therefore, global differences in genomewide content of 5-mC cannot explain the pattern of gain and loss of methylation we observed in promoter regions with the HELP assay (Figure 1B). The comparison of HELP assay results and genomewide results would suggest that the global loss of 5-mC content in DLBCLs occurs primarily in the intergenic or coding sequence areas of the genome.
The magnitude of DNA methylation changes predicts survival
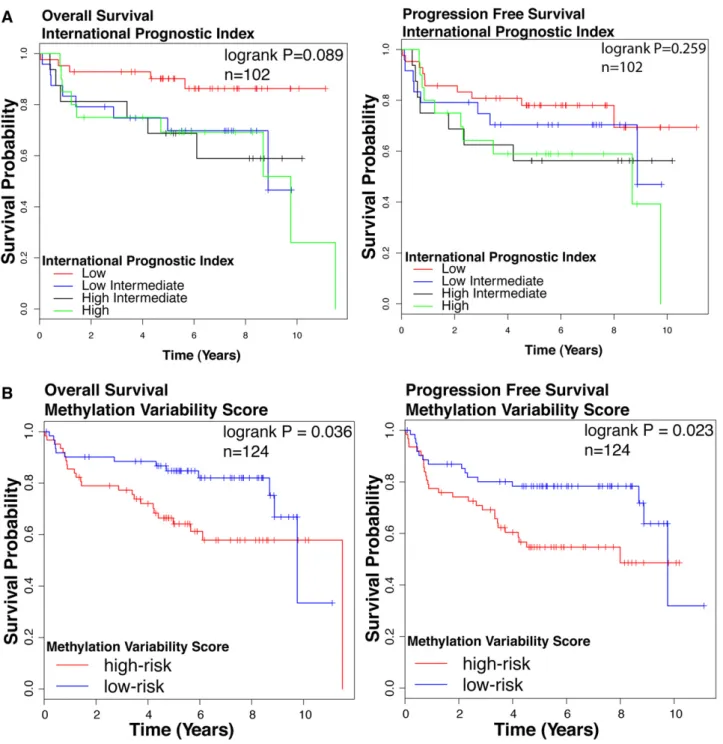
We assessed the association of the DNA methylation based clusters of DLBCL with survival outcomes. Cluster identity alone did not predict
survival outcomes (log-rank test: overall survival [OS] P 5 .375, progression-free survival [PFS] P 5 .139, n 5 124; supplemental Figure 4), possibly reflecting insufficient number of patients in each cluster. We tested the prognostic significance of the IPI, a widely accepted standard prognostication model in DLBCL. IPI was sig-nificantly associated with OS but not PFS (log-rank test OS P 5 .089,
PFS P 5 .259, Figure 2A) in our cohort. We also studied clinical outcomes by dividing patients based on the median MVS. The high-risk group is composed patients with MVS above the median; the low-risk group is composed of patients with an MVS below the median. We observed a statistically significant difference in survival between high- and low-risk groups (log-rank test OS P 5 .036, PFS P 5 .023,
Figure 1. Methylation variability defines 6 distinct clusters of DLBCL. (A) Outline of the study design and outcome of functional clustering. Samples were profiled for genomewide DNA methylation using the HELP array. For each sample, the MVP was determined. The MVPs were clustered using unsupervised functional hierarchical clustering to produce 6 distinct clusters in this cohort. (B) Cluster MVPs show increasing DNA methylation variability from the average NGCB methylation profile. Heavy right tails in the distribution indicate a tendency toward hypomethylation, whereas heavy left tails indicate hypermethylation in DLBCLs. (C) Boxplot representation of MVS by cluster shows increasing MVS from cluster A to cluster F.
n5 124; Figure 2B). Patients with a larger magnitude of methylation changes compared with NGCB display poorer survival outcomes compared with patients with smaller magnitude of methylation changes.
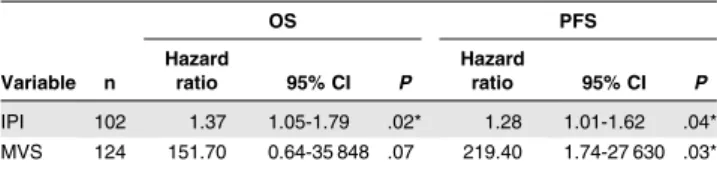
The univariate Cox proportional hazard model shows that the MVS is moderately predictive of OS (P 5 .072) and predicts PFS (P 5 .029) (Table 1). We performed a multivariate Cox analysis for OS and PFS using IPI and MVS as predictors. After accounting for IPI, MVS is a significant predictor of PFS (P 5 .03) and is a moderately significant predictor of OS (P 5 .07) (Table 2). These findings suggest that classifying patients according to the extent of their methylation divergence from normal B cells is a useful factor
in building prognostic models for DLBCL because it performs comparably with IPI in univariate analysis and remains significant in a multivariate model with both factors.
Characteristics of epigenetic clusters
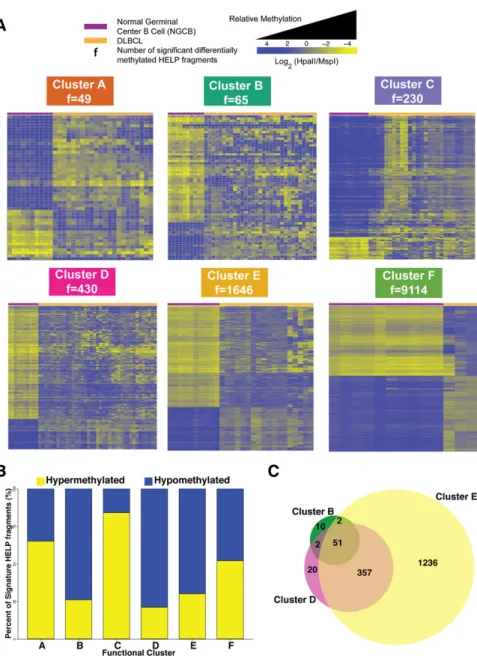
We then investigated how each of the 6 DLBCL clusters differed from controls. We carried out differential methylation analysis between each DLBCL cluster and NGCBs. This analysis produced the signatures presented in Figure 3A (supplemental Table 2). In line with the extent of methylation disruption shown in Figure 1B, we observed increasing amounts of methylation changes: from cluster A
Figure 2. Survival outcomes in patient cohort. Kaplan-Meier curves for (left) OS and (right) PFS according to (A) IPI. Groups are: low (IPI score 0 or 1), low/intermediate (IPI score 2), high/intermediate (IPI score 3), and high (IPI score 4 or 5). (B) MVS. Groups are: low risk (MVS, median) and high risk (MVS . median). The log-rank test P value for group association with survival outcome is reported. n, number of patients who underwent R-CHOP therapy in this cohort with follow-up data.
with 49 fragments (47 genes) to cluster F with 9114 fragments (7361 genes) (Figure 3A). Cluster B (74%), D (79%), and E (70%) signatures showed predominant hypomethylation in DLBCL (Figure 3B). Sixty-five percent of cluster A and 84% of cluster C signature fragments were significantly hypermethylated (Figure 3B). Cluster F showed extensive methylation changes that affected 9114 of 25 625 fragments (48% fragments were hypomethylated and 52% hypermethylated).
Interestingly, we found that clusters B, D, and E have a substantial overlap in aberrantly methylated fragments: 53 of 65 signature frag-ments from cluster B are also aberrantly methylated in cluster D and 408 of 439 signature fragments from cluster D are also aberrantly methylated in cluster E (Figure 3C). These results suggest a possible progressive accumulation of aberrant methylation in the genome of some DLBCL patients. Although these results are suggestive, de-finitive demonstration of progressive accumulation of changes would require measuring methylation over time for the same patients.
We performed technical validation of methylation levels for a subset of genes in these signatures using Sequenom MassARRAY EpiTYPER as an orthogonal method. We selected 10 fragments and epityped 10 DLBCL cases at these locations. HELP and Sequenom MassARRAY estimates are highly correlated (r25 0.7) (supplemental
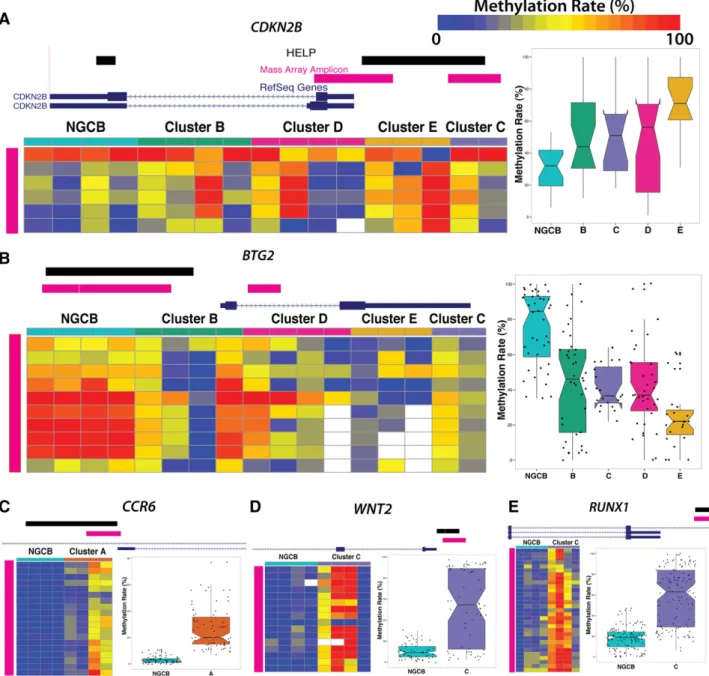
Figure 5). We also confirmed methylation status of some of the biologically important signature genes. p15/CDKN2B was hyper-methylated, whereas BTG2 was hypomethylated in clusters B, C, D, and E (Figure 4A-B). We confirmed hypermethylation in the promoter region of CCR6 in cluster A (Figure 4C), RUNX1 (Figure 4D), and WNT2 (Figure 4E).
The gene expression–based molecular subtypes ABC and GCB DLBCL are well characterized and validated. We investigated how the ABC/GCB classification was related to the DNA methylation– based clusters (supplemental Figure 6). We found that DNA meth-ylation clusters are not exclusive of a particular gene-expression subtype. Clusters A, B, C, and D with lower methylation disruption have higher frequencies of GCB DLBCLs (60%, 50%, 83%, and 56%, respectively), whereas cluster E has the highest frequency of ABC-DLBCL (78%)—much higher than the overall cohort ABC-ABC-DLBCL frequency of 30%. Limited conclusions can be made for cluster F with 3 samples in the cluster.
We then investigated which biological functions were over-represented in the genes that compose the different DLBCL cluster signatures (Figure 5). Cluster A’s differentially methylated genes were involved in the cytokine-mediated signaling pathway (STAT3, TNFRSF1A, and KRAS, supplemental Figure 7). Cluster B signature was enriched in genes contributing to multicellular organismal homeostasis (eg, CALD1, GIMAP) and T-cell activation (CD3D, CD3G) (supplemental Figure 8). Cluster C was characterized by hypermethylation of many important developmental genes, particularly homeobox and forkhead box family genes (supplemental Figure 9). We found that the tricarbonic acid cycle is one of the top canonical pathways in cluster D (supplemental Figure 10). Of note, IDH2 belongs to this pathway and is significantly hypomethylated in clusters D, E, and F. IDH1 and IDH2 mutations in acute myeloid leukemia (AML) are
associated with hypermethylation.24Aberrant methylation of the ephrin signaling pathway was a hallmark of cluster E (supplemental Figure 11), with aberrant hypermethylation of EPHA5 and PIK3CG, hypomethy-lation of EPHB1, the tyrosine-protein kinase FYN, GRB7, GNAO1, and PXN, and ephexin. Many processes that contribute to a malignant phenotype are enriched in cluster F, such as regulation of apoptotic processes and aberrant methylation of cell-cycle genes as well as many signal transduction pathways associated with cancer (protein kinase B signaling, inhibition of extracellular signal-regulated kinase, or 59 adenosine monophosphate-activated protein kinase signaling, supplemental Figure 12). Additional details about pathway analysis can be found in supplemental Results.
Previous reports had shown that lymphomas aberrantly methylate a subset of the targets of the PRC2 polycomb complex (EZH2 is the catalytic subunit of the complex).25,26We found that differentially methylated genes were enriched for targets of EZH2 with statistically significant enrichment in clusters C, D, and E (supplemental Figure 13, hypergeometric test q value,0.05). More than 60% of the EZH2 targets present in each cluster signature were hypermethylated compared with NGCBs. Examples of hypermethylated EZH2 targets included CDKN2A, CDKN2B, NID1, HOXA9, HOXD8, ERICH1, and EPHA5 (supplemental Table 3).
We also investigated if there were genes that were aberrantly methylated in all DLBCLs and thus defined a lymphoma-specific methylation signature. We found 200 differentially methylated genes when comparing DLBCL and NGCBs (supplemental Results, sup-plemental Figure 14). These commonly aberrantly methylated genes were enriched in cell-adhesion genes—in particular, proto-cadherins. Interestingly, CDKN2B was hypermethylated in all DLBCL clusters except A, suggesting a possible early event in lymphomagenesis. Epigenetic deregulation of the INK4A-ARF cluster appears to be a common and progressive event in lymphomagenesis because more deregulated clusters B and D displayed hypermethylation of CDKN2B and CDKN2B-AS1 and the most deregulated clusters E and F in addition to hypermethylating CDKN2B and CDKN2B-AS1 also displayed hypermethylation of CDKN2A. Most deregulated cluster F also had hypermethylation of other cell-cycle regulators such as CDKN1A, CDKN1B, CDKN2D, and CDKN2AIP. Our data show that the INK4A, CDKN1A, and CDKN1B genes display aberrant methyl-ation in DLBCLs.
We asked if DNA methylation changes could correlate with genomic changes in the samples. To this end, we measured and an-alyzed copy number changes using single nucleotide polymorphism data from a subset of analyzed DLBCLs. We identified broad regions of genomic amplification and deletion in this cohort using the GISTIC algorithm (supplemental Table 4).273q, 7p, 11q, and 18q amplifications and 6q deletions were the most frequently observed genomic changes in this cohort (supplemental Figure 15). The 3q amplification has been reported before and contains the NFKBIZ gene.28NFKBIZ can bind to NFKB and activate downstream signaling of NFKB, resulting in upregulation of interleukin-6 among other targets.29 Activation of NFKB and IL-6 signaling through STAT3 both contribute to the
Table 1. Univariate Cox proportional hazards models for OS and PFS OS PFS Variable n Hazard ratio 95% CI P Hazard ratio 95% CI P IPI 102 1.37 1.05-1.79 .02* 1.28 1.01-1.62 .04* MVS 124 151.70 0.64-35 848 .07 219.40 1.74-27 630 .03* *Statistically significant.
Table 2. Multivariate Cox proportional hazards models for OS and PFS OS PFS Variable n Hazard ratio 95% CI P Hazard ratio 95% CI P IPI 102 1.38 1.05-1.80 .02* 1.28 1.01-1.62 .04* MVS 102 471.77 0.63-35 500 .07 718.79 2.29-225 400 .03* *Statistically significant.
proliferative potential of DLBCLs. The 18q amplification was present in all clusters with greater frequency in clusters E and F. This amplification has been reported previously to be more prevalent in ABC-type DLBCLs, which is consistent with our data.28BCL2, an antiapoptotic protein playing a pivotal role in the pathogenesis of many lymphoma subtypes, was reported to be the most overexpressed gene as a result of this amplification.28
Interestingly the 6q deletion is found in less than 10% of cluster A and is absent in cluster F cases. The deleted arm of 6q contains the candidate tumor suppressor gene PRDM1, which is crucial for plasmacytic differentiation.30
Similar to the magnitude of methylation difference from NGCBs, genomic instability increases from cluster A to cluster F. The 3q, 7pq, 11q, and 18q amplifications are enriched with increasing frequency from cluster A to F (2-sided Fisher exact test, P # .1). We sought to rule out that genomic aberrations alone could explain the patterns of meth-ylation variability observed in this cohort. To this end, we identified the genomic regions where no significant amplifications or deletions were detected by GISTIC. We calculated the MVS based on the HELP fragments that map to these regions and observed a similar pattern of increased MVS from clusters A to F that we observed when all fragments were used (supplemental Figure 16). These results show that
both genomic aberrations and DNA methylation changes compared with normal increase from patients in cluster A to patients in cluster F. Additionally, we ruled out that variation in sample purity is not the cause for different methylation variability between the clusters (supplemental Figure 17).
Concordant changes in DNA methylation and gene expression
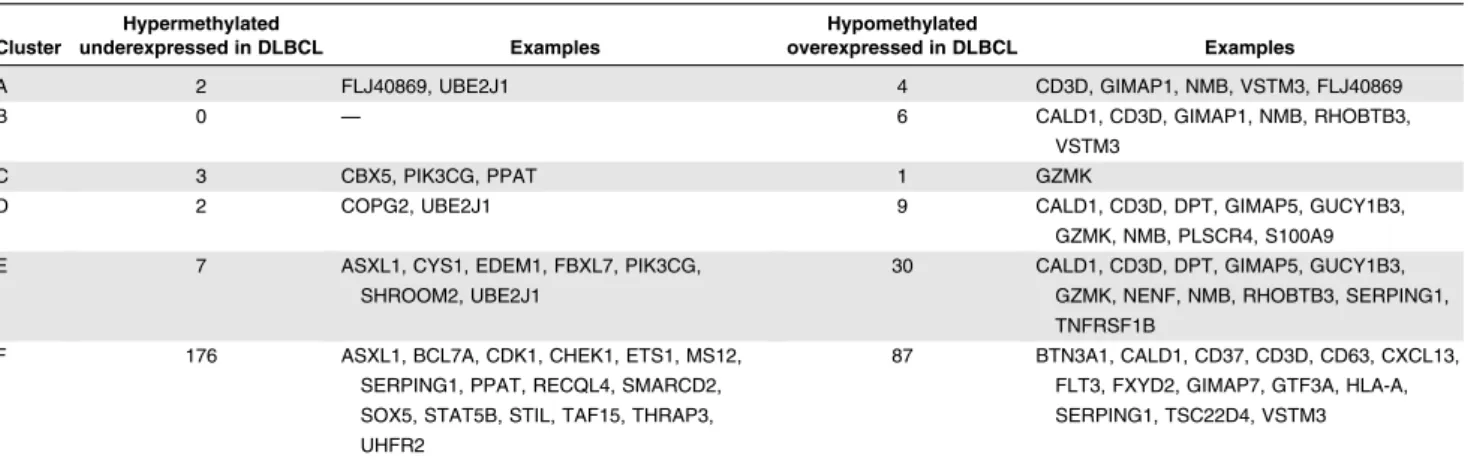
We integrated DNA methylation and gene expression data to look for genes whose regulation could be associated with DNA methylation status. Gene expression was assayed in 52 samples spanning each DNA methylation cluster. We determined genes that were sig-nificantly up or downregulated in DLBCL clusters compared with NGCB. For these differentially expressed genes, we examined whether methylation was perturbed in those genes for each cluster. This analysis showed that 14% of cluster A and 11% of cluster B RefSeq transcripts show an inverse correlation with expression, whereas for all other clusters less than 5% of the methylation signature falls in this category (supplemental Tables 5-6). Inversely correlated between methylation and expression across clusters are genes such as CD3D, NMB, GZMK, and VSTM3 (Table 3). These genes have immune
Figure 3. Cluster DNA methylation signatures. (A) Heat map representation for the HELP fragments that are differentially methylated between NGCB cells and DLBCL cases in each cluster (moderated Student t test q value,0.05 and log fold change $1.5). Each row represents a single HELP fragment (probe set) and each column a single patient/normal sample. Yellow represents highly methylated (hypermethylated) frag-ments and blue represents fragfrag-ments with lower methylation (hypomethylated). (B) Bar plot showing relative abundance of methylation gain and loss for each cluster signature. (C) Venn diagram depicting the overlap of differentially methylated HELP fragments among clusters B, D, and E.
functions such as lymphocyte activation and T-cell activation. Enzymes that act against guanosine triphosphate in the immunity-associated protein family (GIMAPs) are known to regulate lymphocyte survival.31Here wefind that GIMAP1 and GIMAP5 are hypomethy-lated and overexpressed in DLBCLs. We found that ASXL1 was hyper-methylated and downregulated in cluster E and F DLBCLs. ASXL1 is a tumor suppressor gene that is associated with the repressive polycomb complex PRC2.
Discussion
Extensive gene expression profiling studies of DLBCLs resulted in identification of several molecular subgroups of clinical significance,
including ABC-like, GCB-like, and primary mediastinal B-cell lymphoma subtypes.1,2The biology of these subgroups is not entirely explained by genomic events and transcriptional programs, suggesting an additional layer of regulation. Recently, somatic mutations have been identified in components of the epigenetic machinery—such as EZH2, CBP/p300, and MLL2—that shed the light on the significance of epigenetic regulation in normal B-cell development and in lymphomagenesis.32-34In addition to histone modifiers and small
noncoding RNAs, chemical modifications of DNA such as cytosine methylation emerged recently as paramount in regulating genome stability and gene expression. Targeted studies identified several loci with altered DNA methylation in DLBCL, including INK4A,35,36 MGMT,37,38and BCL6.39Following these observations, we asked whether such changes are widespread in the genome of DLBCL
Figure 4. Technical validation of differentially methylated loci. MassARRAY EpiTYPER results are shown for (A) CDKN2B, (B) BTG2, (C) CCR6, (D) WNT2, and (E) RUNX1. In each panel, the genome plots show the location of the HELP locus (black). The pink genome track shows the region assayed by MassARRAY. DLBCL samples were randomly selected as cluster representatives for validation (columns). Each row represents an individual genomic cytosine in the genomic region shown in the genome plot above the heat map (pink). Color intensity from blue to red represents the methylation rate (0%-100%). The boxplots on the right depict the distribution of methylation rate by group for all cytosines in regions assayed by MassARRAY.
patients and used a genomewide approach to measure DNA meth-ylation at more than 14 000 promoters.
A keyfinding in our study is that the magnitude of methylation changes and the number of gene promoters perturbed in DLBCLs compared with NGCBs correlates with clinical outcome. The magnitude of methylation changes is related to the concept of epigenetic variability. Epigenetic variability has been detected in other cancers such as colon, breast, and lung,19and results in the loss of the bimodal distribution of methylation that is normally observed in normal healthy tissues. This feature so far has not been described in other hematologic malignancies, which are characterized by aberrant methylation of a specific set of genes. In AML, epigenetic signatures define most cytogenetic AML subtypes.40,41
The mechanisms that are implicated in aberrant DNA methylation in other cancers such as AML and pre–B-acute lymphoblastic lymphoma such as mutations in DNMT3A, IDH1/2, and TET1/2 have not been identified in DLBCLs,42-45whereas changes in the level of expression of
methyltransferases have been,46setting this subtype of B-cell non-Hodgkin lymphoma apart.46We also proposed in our earlier work that other factors such as AID and CTCF may play a role in creating methylation variability in DLBCLs.20Here, we defined MVP and MVS as novel quantitative measures of methylation disruption that can also be applied to other tumor types. In this study, the MVP and MVS measures specifically account for methylation disruption between samples but do not specifically address the extent of intrasample heterogeneity. We found that the magnitude of DNA methylation changes across the genome defines 6 clusters among 140 patients.
The underlying cause for increased magnitude of methylation changes in DLBCLs may lie in their cell of origin. The NGCB cell at the origin of DLBCL tumors is known to possess increased genomic
and epigenomic mutability because of its ability to suppress DNA repair mechanisms to allow physiologic somatic hypermutation and class switch recombination.47,48 This phenomenon of epigenetic variability in DLBCLs may be an underlying cause of clonal evolution and chemoresistance. Technical approaches measuring intrasample variability will be necessary to determine the contribution of DNA methylation to clonal evolution in these tumors.
ABC DLBLCs have been shown to have poorer prognosis compared with GCB DLBCL.1,4Here we show that DLBCLs with high levels of methylation disruption compared with NGCBs have poorer survival outcomes and are enriched in ABC DLBCLs. Based on these data, we can postulate that extensive methylation disruption and the ABC signature are associated and result in more aggressive forms of DLBCL.
We confirmed the hypermethylation of EZH2 targets in our cohort. This finding has been reported in smaller cohorts of patients25,26and reflects aberrant colocalization of these
methyl-ation marks with H3K7me3 on targets that are normally repressed by EZH2 and PRC2 complex in embryonic stem cells. Deleterious consequences of a common EZH2 mutation resulting in mark-edly upregulated H3K27me3 in DLBCLs are further enhanced by colocalizing the inhibitory DNA methylation mark. Our data revealed that the most deregulated clusters E and F have hyper-methylation and downregulation of another member of PRC2 complex tumor suppressor gene ASXL1. Mutations in ASXL1 are asso-ciated with poor outcomes in hematopoietic malignancies such as in AML.49Loss of ASXL1 through mutation results in impaired PRC2 function; thus, H3K27me3 is depleted. As a result, DNA methyla-tion may represent an alternative pathway to repress ASXL1 as seen in DLBCL clusters E and F.
Table 3. RefSeq transcripts inversely correlated between DNA methylation and expression
Cluster Hypermethylated underexpressed in DLBCL Examples Hypomethylated overexpressed in DLBCL Examples A 2 FLJ40869, UBE2J1 4 CD3D, GIMAP1, NMB, VSTM3, FLJ40869
B 0 — 6 CALD1, CD3D, GIMAP1, NMB, RHOBTB3,
VSTM3
C 3 CBX5, PIK3CG, PPAT 1 GZMK
D 2 COPG2, UBE2J1 9 CALD1, CD3D, DPT, GIMAP5, GUCY1B3,
GZMK, NMB, PLSCR4, S100A9
E 7 ASXL1, CYS1, EDEM1, FBXL7, PIK3CG,
SHROOM2, UBE2J1
30 CALD1, CD3D, DPT, GIMAP5, GUCY1B3,
GZMK, NENF, NMB, RHOBTB3, SERPING1, TNFRSF1B
F 176 ASXL1, BCL7A, CDK1, CHEK1, ETS1, MS12,
SERPING1, PPAT, RECQL4, SMARCD2, SOX5, STAT5B, STIL, TAF15, THRAP3, UHFR2
87 BTN3A1, CALD1, CD37, CD3D, CD63, CXCL13, FLT3, FXYD2, GIMAP7, GTF3A, HLA-A, SERPING1, TSC22D4, VSTM3
Figure 5. DNA methylation clusters represent molec-ular states. Schematic depicting increasing differences in methylation from normal NGCB cells from left to right. The figure presents a model of possible transitions between DLBCL molecular states. The transitions were derived from an analysis of the number of differentially methyl-ated genomic fragments whose identity overlaps between clusters. Biological processes and pathways significantly overrepresented in each cluster are depicted under each cluster label.
A common aberrant epigenetic event in DLBCLs also observed here is the aberrant methylation of the INK4B-ARF-INK4A locus. This appears to be a progressive oncogenic event that is more common in more aggressive DLBCLs (clusters E and F). Prior reports high-lighted frequent deletion of the INK4B-ARF-INK4A locus in patients with DLBCLs35,36,50,51and suggested that an alternative mechanism of gene inactivation through aberrant hypermethylation also exists and cumulatively with deletions may affect between one-third and one-half of patients with DLBCLs. In addition, we demonstrated aberrant hypermethylation of CDKN1A and CDKN1B, which is a novel finding. Correlation of lower expression of CDKN1A and CDKN1B in lymphomas with higher proliferative capacity has been reported before without addressing the mechanism.52,53Methylation of tumor suppressor genes that have a cell-cycle regulatory role in DLBCLs may provide a rationale for treatment with demethylating agents.
Our clustering study suggests a model for the pathogenesis of DLBCLs and identifies DNA methylation–based molecular states that underlie this process. Functional clustering based on the magnitude of methylation disruption underscores the existence of several subtypes of DLBCL with variable patterns and magnitude of DNA methylation change compared with the normal cell of origin (NGCB in this instance). Our data suggest that some epigenetic subtypes may be interrelated and may result from progressive accumulation of aberrant epigenetic changes (such as subtypes B, D, and E). Other subtypes may arise independently and possibly with different lead time to diagnosis, but eventually ending up in certain predictable aberrant methylation states. These aberrant states of methylation must be predicated on the underlying molecular defects, which are still under investigation.
In summary, we defined novel epigenetic subgroups of DLBCLs and analyzed their unique biological features, deregulated signature
genes, and revealed potential novel therapeutic targets. We also developed a method to measure methylation disruption in lympho-mas that could be useful for risk stratification.
Acknowledgments
The authors thank Dr Anja Mottok for contributing her expertise in pathology to this study.
This work was supported by grants from the Tri-Institutional Training Program in Computational Biology and Medicine (N.C.), the National Institutes of Health Clinical Investigator Award (K08 CA127353), and The Leukemia & Lymphoma Society (6304-11) (R.S.) (U54CA143798) (S.D. and F.M.).
Authorship
Contribution: N.C., M.K., L.A.G., and R.S. performed experiments; N.C., M.K., H.G., S.D., F.M., R.D.M., D.W.S., F.C., and R.S. analyzed results; N.A.J., R.D.M., and R.D.G. provided samples and data; N.C., R.D.G., A.M., F.C., and R.S. wrote the manuscript; and R.D.G., A.M., F.C., and R.S. supervised the project.
Conflict-of-interest disclosure: The authors declare no competing financial interests.
Correspondence: Rita Shaknovich, Weill Cornell Medical College, 1300 York Ave, Building C, Room 620C, New York, NY 10065; e-mail: [email protected]; and Fabien Campagne, Weill Cornell Medical College, 1300 York Ave, Box 140, New York, NY 10065; e-mail: [email protected].
References
1. Alizadeh AA, Eisen MB, Davis RE, et al. Distinct types of diffuse large B-cell lymphoma identified by gene expression profiling. Nature. 2000; 403(6769):503-511.
2. Rosenwald A, Wright G, Leroy K, et al. Molecular diagnosis of primary mediastinal B cell lymphoma identifies a clinically favorable subgroup of diffuse large B cell lymphoma related to Hodgkin lymphoma. J Exp Med. 2003;198(6):851-862. 3. Dunleavy K, Grant C, Wilson WH. Using biologic
predictive factors to direct therapy of diffuse large B-cell lymphoma. Ther Adv Hematol. 2013;4(1): 43-57.
4. Rosenwald A, Staudt LM. Gene expression profiling of diffuse large B-cell lymphoma. Leuk Lymphoma. 2003;44(Suppl 3):S41-S47. 5. Fernandez AF, Assenov Y, Martin-Subero JI,
et al. A DNA methylation fingerprint of 1628 human samples. Genome Res. 2012;22(2): 407-419.
6. Kulis M, Heath S, Bibikova M, et al. Epigenomic analysis detects widespread gene-body DNA hypomethylation in chronic lymphocytic leukemia. Nat Genet. 2012;44(11):1236-1242.
7. Taylor KH, Briley A, Wang Z, Cheng J, Shi H, Caldwell CW. Aberrant epigenetic gene regulation in lymphoid malignancies. Semin Hematol. 2013; 50(1):38-47.
8. Klose RJ, Bird AP. Genomic DNA methylation: the mark and its mediators. Trends Biochem Sci. 2006;31(2):89-97.
9. Ubeda F, Wilkins JF. Imprinted genes and human disease: an evolutionary perspective. Adv Exp Med Biol. 2008;626:101-115.
10. Carmona FJ, Esteller M. DNA methylation in early neoplasia. Cancer Biomark. 2010;9(1-6):101-111. 11. Herman JG, Baylin SB. Gene silencing in cancer in association with promoter hypermethylation. N Engl J Med. 2003;349(21):2042-2054. 12. Xiong H-L, Liu X-Q, Sun A-H, He Y, Li J, Xia Y.
Aberrant DNA methylation of P16, MGMT, hMLH1 and hMSH2 genes in combination with the MTHFR C677T genetic polymorphism in gastric cancer. Asian Pac J Cancer Prev. 2013;14(5): 3139-3142.
13. Oricchio E, Nanjangud G, Wolfe AL, et al. The Eph-receptor A7 is a soluble tumor suppressor for follicular lymphoma. Cell. 2011;147(3):554-564. 14. Esteller M, Gaidano G, Goodman SN, et al.
Hypermethylation of the DNA repair gene O(6)-methylguanine DNA methyltransferase and survival of patients with diffuse large B-cell lymphoma. J Natl Cancer Inst. 2002;94(1):26-32. 15. Lee SMSH, Lee EJ, Ko Y-H, Lee SH, Maeng L,
Kim KM. Prognostic significance of O6-methylguanine DNA methyltransferase and p57 methylation in patients with diffuse large B-cell lymphomas. APMIS. 2009;117(2):87-94. 16. Shaknovich R, Geng H, Johnson NA, et al. DNA
methylation signatures define molecular subtypes of diffuse large B-cell lymphoma. Blood. 2010; 116(20):e81-e89.
17. Pike BL, Greiner TC, Wang X, et al. DNA methylation profiles in diffuse large B-cell lymphoma and their relationship to gene expression status. Leukemia. 2008;22(5): 1035-1043.
18. Wang X-M, Greiner TC, Bibikova M, et al. Identification and functional relevance of de novo DNA methylation in cancerous B-cell populations. J Cell Biochem. 2010;109(4):818-827. 19. Hansen KD, Timp W, Bravo HC, et al. Increased
methylation variation in epigenetic domains across cancer types. Nat Genet. 2011;43(8): 768-775.
20. De S, Shaknovich R, Riester M, et al. Aberration in DNA methylation in B-cell lymphomas has a complex origin and increases with disease severity. PLoS Genet. 2013;9(1):e1003137. 21. Khulan B, Thompson RF, Ye K, et al.
Comparative isoschizomer profiling of cytosine methylation: the HELP assay. Genome Res. 2006;16(8):1046-1055.
22. Shaknovich R, Figueroa ME, Melnick A. HELP (HpaII tiny fragment enrichment by ligation-mediated PCR) assay for DNA methylation profiling of primary normal and malignant B lymphocytes. Methods Mol Biol. 2010;632: 191-201.
23. Thompson RF, Reimers M, Khulan B, et al. An analytical pipeline for genomic representations used for cytosine methylation studies. Bioinformatics. 2008;24(9):1161-1167. 24. Figueroa ME, Abdel-Wahab O, Lu C, et al.
Leukemic IDH1 and IDH2 mutations result in a hypermethylation phenotype, disrupt TET2 function, and impair hematopoietic differentiation. Cancer Cell. 2010;18(6):553-567.
25. Mart´ın-Subero JI, Kreuz M, Bibikova M, et al; Molecular Mechanisms in Malignant Lymphomas Network Project of the Deutsche Krebshilfe. New
insights into the biology and origin of mature aggressive B-cell lymphomas by combined epigenomic, genomic, and transcriptional profiling. Blood. 2009;113(11):2488-2497. 26. Velichutina I, Shaknovich R, Geng H, et al.
EZH2-mediated epigenetic silencing in germinal center B cells contributes to proliferation and lymphomagenesis. Blood. 2010;116(24): 5247-5255.
27. Beroukhim R, Getz G, Nghiemphu L, et al. Assessing the significance of chromosomal aberrations in cancer: methodology and application to glioma. Proc Natl Acad Sci U S A. 2007;104(50):20007-20012.
28. Lenz G, Wright GW, Emre NCT, et al. Molecular subtypes of diffuse large B-cell lymphoma arise by distinct genetic pathways. Proc Natl Acad Sci U S A. 2008;105(36):13520-13525.
29. Motoyama M, Yamazaki S, Eto-Kimura A, Takeshige K, Muta T. Positive and negative regulation of nuclear factor-kappaB-mediated transcription by IkappaB-zeta, an inducible nuclear protein. J Biol Chem. 2005;280(9): 7444-7451.
30. Turner CA Jr, Mack DH, Davis MM. Blimp-1, a novel zinc finger-containing protein that can drive the maturation of B lymphocytes into immunoglobulin-secreting cells. Cell. 1994;77(2): 297-306.
31. Nitta T, Takahama Y. The lymphocyte guard-IANs: regulation of lymphocyte survival by IAN/ GIMAP family proteins. Trends Immunol. 2007; 28(2):58-65.
32. B ´eguelin W, Popovic R, Teater M, et al. EZH2 is required for germinal center formation and somatic EZH2 mutations promote lymphoid transformation. Cancer Cell. 2013;23(5):677-692. 33. Morin RD, Johnson NA, Severson TM, et al.
Somatic mutations altering EZH2 (Tyr641) in follicular and diffuse large B-cell lymphomas of germinal-center origin. Nat Genet. 2010;42(2): 181-185.
34. Morin RD, Mendez-Lago M, Mungall AJ, et al. Frequent mutation of histone-modifying genes in non-Hodgkin lymphoma. Nature. 2011;476(7360): 298-303.
35. Guney S, Jardin F, Bertrand P, et al. Several mechanisms lead to the inactivation of the CDKN2A (P16), P14ARF, or CDKN2B (P15) genes in the GCB and ABC molecular DLBCL subtypes. Genes Chromosomes Cancer. 2012; 51(9):858-867.
36. Zainuddin N, Kanduri M, Berglund M, et al. Quantitative evaluation of p16(INK4a) promoter methylation using pyrosequencing in de novo diffuse large B-cell lymphoma. Leuk Res. 2011; 35(4):438-443.
37. Uccella S, Cerutti R, Placidi C, et al. MGMT methylation in diffuse large B-cell lymphoma: validation of quantitative methylation-specific PCR and comparison with MGMT protein expression. J Clin Pathol. 2009;62(8):715-723. 38. Lee G-W, Kang J-H, Kim I-S, et al. Is
inactivation of O6-methylguanine DNA methyltransferase still a favorable prognostic factor of patients with diffuse large B-cell lymphoma in the era of R-CHOP
chemotherapy? Leuk Lymphoma. 2009;50(12): 1992-1998.
39. Lai AY, Fatemi M, Dhasarathy A, et al. DNA methylation prevents CTCF-mediated silencing of the oncogene BCL6 in B cell lymphomas. J Exp Med. 2010;207(9):1939-1950.
40. Figueroa ME, Lugthart S, Li Y, et al. DNA methylation signatures identify biologically distinct subtypes in acute myeloid leukemia. Cancer Cell. 2010;17(1):13-27.
41. Lugthart S, Figueroa ME, Bindels E, et al. Aberrant DNA hypermethylation signature in acute myeloid leukemia directed by EVI1. Blood. 2011;117(1):234-241.
42. Lu C, Ward PS, Kapoor GS, et al. IDH mutation impairs histone demethylation and results in a block to cell differentiation. Nature. 2012; 483(7390):474-478.
43. Ley TJ, Ding L, Walter MJ, et al. DNMT3A mutations in acute myeloid leukemia. N Engl J Med. 2010; 363(25):2424-2433.
44. Yan X-J, Xu J, Gu Z-H, et al. Exome sequencing identifies somatic mutations of DNA methyltransferase gene DNMT3A in acute
monocytic leukemia. Nat Genet. 2011;43(4): 309-315.
45. Delhommeau F, Dupont S, Della Valle V, et al. Mutation in TET2 in myeloid cancers. N Engl J Med. 2009;360(22):2289-2301.
46. Amara K, Ziadi S, Hachana M, Soltani N, Korbi S, Trimeche M. DNA methyltransferase DNMT3b protein overexpression as a prognostic factor in patients with diffuse large B-cell lymphomas. Cancer Sci. 2010;101(7):1722-1730. 47. Ranuncolo SM, Polo JM, Dierov J, et al. Bcl-6
mediates the germinal center B cell phenotype and lymphomagenesis through transcriptional repression of the DNA-damage sensor ATR. Nat Immunol. 2007;8(7):705-714.
48. Bea S, Zettl A, Wright G, et al; Lymphoma/ Leukemia Molecular Profiling Project. Diffuse large B-cell lymphoma subgroups have distinct genetic profiles that influence tumor biology and improve gene-expression-based survival prediction. Blood. 2005;106(9):3183-3190. 49. Gelsi-Boyer V, Brecqueville M, Devillier R, Murati
A, Mozziconacci M-J, Birnbaum D. Mutations in ASXL1 are associated with poor prognosis across the spectrum of malignant myeloid diseases. J Hematol Oncol. 2012;5(1):12.
50. Baur AS, Shaw P, Burri N, Delacr´etaz F, Bosman FT, Chaubert P. Frequent methylation silencing of p15(INK4b) (MTS2) and p16(INK4a) (MTS1) in B-cell and T-cell lymphomas. Blood. 1999;94(5): 1773-1781.
51. Guney S, Bertrand P, Jardin F, et al. Molecular characterization of 9p21 deletions shows a minimal common deleted region removing CDKN2A exon 1 and CDKN2B exon 2 in diffuse large B-cell lymphomas. Genes Chromosomes Cancer. 2011;50(9):715-725.
52. S ´anchez-Beato M, S ´aez AI, Mart´ınez-Montero JC, et al. Cyclin-dependent kinase inhibitor p27KIP1 in lymphoid tissue: p27KIP1 expression is inversely proportional to the proliferative index. Am J Pathol. 1997;151(1):151-160.
53. Go JH. Expressions of the CIP/KIP family of CDK inhibitor proteins in primary intestinal large B-cell lymphomas: correlation with clinical outcomes. Pathol Res Pract. 2002;198(11):741-746.