1
Determinants of the Portuguese families’ level of over-indebtedness
Cláudio Campos
Masters Degree in Management
Advisor: Prof. Susana Peralta
2
Determinants of the Portuguese families’ level of over-indebtedness
Abstract
This paper provides several econometric analyses in order to disclose the determinants of the probability of defaulting on financial obligations and of the level of debt and expenses burdens for Portuguese families. The study was developed using data collected by DECO, a Portuguese consumer association. We run several regressions using demographic variables and over-indebtedness triggers and look for the robustness of results. We find that unemployment and family composition are the most significant and consistent determinants of our outcome variables and most of our empirical findings are backed up by previous studies.
Keywords: over-indebtedness, default, Portugal, DECO
1. Introduction
Over the last years, the importance given to households’ over-indebtedness and financial literacy has been increasing, especially after the Financial crisis of 2007–2008 (OECD/INFE, 2009). To understand and measure such concepts is of the utmost importance, as they are an integral part of the financial system’s stability (OECD/INFE, 2016), which has led institutions such as the OECD/INFE and the DG SANCO to address these topics.
3
According to Eurostat, in 2015, 26,6% of Portugal’s population was at risk of poverty or social exclusion, 2,9% more than the EU average (Eurostat, 2016). In 2015, the Bank of Portugal conducted the 2nd Financial Literacy Survey of the Portuguese population, which revealed that the general numeracy and financial products knowledge of the population has severe shortcomings, confirming the conclusion reached in the 1st wave of the survey (Bank of Portugal, 2016). Within this 5-year period, the number of households with financial problems requesting assistance from DECO (Portuguese Association for Consumer Protection) grew from 11.960 to 29.214, a 144% increase (DECO, 2016), while the number of firm insolvency cases in Portugal increased 709% (DGPJ, 2016). These statistics reflect the severity of the Portuguese households’ current financial situation and literacy.
The literature uses three different definitions of over-indebtedness (Ferreira, 2000): a subjective, a quantitative/objective and an administrative model. Betti et al. (2007) adopted a subjective model that depends on the household’s judgement, i.e., over-indebted households are “those that expressed difficulty or serious difficulty in making debt payments, including credit debt, mortgage payments and hire purchase installments as recorded in household surveys” (Betti et al., 2007: 144). An objective definition makes use of indicators with established thresholds to determine if the household is over-indebted. Examples of such indicators are the number of credit commitments, debt-to-income ratios or number of arrears on a credit commitment, as used by d’Alessio et al. (2013). These quantitative measures provide a more objective mechanism for defining over-indebtedness; yet, critical levels may be difficult to define and may seem somewhat arbitrary (Betti et al., 2007). The administrative approach is associated with the judicial system and states that
over-4
indebtedness is a situation where the inability to pay off debts has been pronounced before a court, i.e., the household has declared bankruptcy.
In this work we adopt a subjective approach, as over-indebted households are those seeking the assistance of GAS (Gabinete de Apoio ao Sobre-endividado, a division of DECO that helps households with over-indebtedness problems). The reasoning is that, if households look for GAS’s help it is because they perceive themselves as over-indebted, acknowledging their difficulty in making debt or utility bills payments. We may trust the truthfulness of these households’ situation for two main reasons. Firstly, being over-indebted is usually perceived as a shameful situation that contributes to a feeling of second-class citizenship (Persson, 2007). Secondly, since GAS does not provide monetary aid to households, there is no incentive to seek assistance for those who are not facing difficulties.
The problem of over-indebtedness can generate a reduction in consumption below the household’s desired level and may even deprive its members of some basic goods. In the long term, the accumulation of debt can lead to financial fragility, social exclusion and even poverty (d’Alessio et al., 2013). The issue has been associated to lack of financial literacy (Casagrande, 2016) and liquidity constraints (Betti et al., 2007), which can be tackled through appropriate policies.
This research was developed in partnership with DECO’s Gabinete de Apoio ao Sobre-endividado (GAS). We use a sample of 6.479 households that sought GAS’s assistance from its database.1 Our contribution is twofold: on the one hand, we do a thorough preparation of the database for research purposes, including the creation of a newly “over-indebtedness
1 The database provided contained a total of 17.470 households. However, only 6.479 gathered the detailed demographic and financial information that was necessary to conduct this study.
5
trigger” variable that we recovered from an open text answer. On the other hand, we provide several econometric analyses in order to disclose the determinants of the probability of defaulting on financial obligations and of the level of debt and expenses burdens. These determinants include not only demographic variables but also over-indebtedness triggers that have occurred to households (such as unemployment, divorce or own company bankruptcy).
The next section of the paper browses existing literature on the topic. An overview of DECO and GAS is provided in section 3. Section 4 exposes relevant information concerning the data, such as the data collection process, how data was treated and the data itself. Results of the analysis are presented in section 5 and section 6 outlines the conclusions.
2. Literature Review
The importance of over indebtedness has spawned a vast literature on the topic, with several approaches, types of data, and techniques, of which we now provide a brief overview. Betti et al. (2007) suggest that the differences arise because of the “intrinsic conceptual difficulty” and lack of detailed household data. In their paper they use micro-data from the European Community Household Panel Survey (ECHP) and the (European) Household Budget Surveys (HBS) for the year 1996 to examine indebtedness across several EU countries (including Portugal) while adopting the life-cycle-permanent-income framework.2 The
results are broadly consistent with the model, but distinct for high and low-borrowing countries. In the latter, over-indebtedness appears to be more problematic mainly due to
2 According to this model, being indebted is a natural and rational circumstance in which households try to smooth consumption over their lifetime. Such a circumstance only becomes a problem when it leads to over-indebtedness, which is only caused if an unexpected shock appears or if the consumer has a myopic view of resources (behavior in which a person mismanages its resources by being short-sighted, which can exist in the form of extreme risk aversion or extreme risk taking).
6
liquidity constraints. Likewise, Russell et al. (2012) found that financial exclusion has a positive impact on debt levels using data for Ireland from the European Union Statistics on Income and Living Conditions (EU-SILC).
In Germany, Keese (2009) relates income and debt services to different concepts of subsistence levels with data from the German Socio-Economic Panel (SOEP). The paper addresses the impact of unexpected shocks (i.e., trigger events) and shows that household’s indebtedness is most affected by unemployment, childbirth and death, divorce or separation. The same author, in a paper from 2012, also confirms that the debt burden of households is influenced by future expectations regarding the personal and socio-economic environment (Keese, 2012).
The relationships between compulsive buying and debt have also been analyzed in several papers. Using SOEP data, Achtziger et al. (2015) showed that compulsive buying has a positive impact on debt, while self-control has a negative one. Furthermore, it was found that women are more likely to buy compulsively and that age has a positive relation with self-control. In a similar analysis for the UK, Gathergood (2012) shows that financial illiteracy and lack of self-control are positively linked to excessive debt burdens and a higher exposure to risks, due to a higher probability of credit withdrawals and income shocks. In 2016, Casagrande (2016) analyzed the impact of financial literacy on over-indebted Portuguese families, in partnership with DECO.3 The findings suggest that financial literacy has a
significant impact on the probability of being over-indebted and that the relationship between the two variables is mediated by the level of education.
3 The data was collected via a survey that tested households’ financial literacy and distributed among the households in DECO’s database.
7
Similarly, Lusardi et al. (2015) conducted a study on debt literacy with a sample of the American population and found that approximately one-third of the population understands what interest compounding is, or how credit cards work. Like the other authors already mentioned, they also found a positive relationship between the financial illiteracy and debt burden. Oksanen et al. (2015) analyzed debt problems in Finland between 2005 and 2013 using a random sample of the Finnish population and found that prior criminal convictions are associated with higher debt related problems.
With Italian data from 2010, d’Alessio et al. (2013) compared a list of indicators (mostly objective ones) that capture different dimensions of over-indebtedness4 and found that the
debt-poverty indicator is the one that best detects over-indebtedness situations. For each, they establish a threshold that dictates whether or not the household is over-indebted and then proceed to test the indicators’ predictive performance by changing its cut points. The problem with these objective definitions of over-indebtedness is that sometimes, being above the threshold does not necessarily mean a situation of over-indebtedness. Even for a very high debt-to-income ratio, households may have a high enough income that they are able to service the debt without feeling overwhelmed by it. In the same line of reasoning, households can have a number of loans below the threshold, but with total outstanding debt above their repayment possibilities. Despite this limitation, debt and expenses-to-income ratios are used in this paper to measure the household’s level of over-indebtedness, as they are a useful complement to our subjective definition.
8
3. DECO and GAS overview
DECO, also known as the Portuguese Association for Consumer Protection, is an independent and non-profit consumer association with over 40 years of intervention. With headquarters in Lisbon and delegations in six other regions of Portugal, it is the largest and most recognized association of its kind whose main objectives are defending the rights and interests of consumers and providing a better access to information. Its main activities include consumer’s advice, support and representation, dispute resolution and publication of test magazines and guides (DECO, 2016).
In the year 2000 DECO founded GAS, a division with the objective of counselling consumers with over-indebtedness problems. Its work consists in providing support and advice to households that are over-indebted and increasing consumer’s financial literacy by publishing articles about topics such as household budgeting, savings on daily expenses and investments.
To request GAS’s help, a household member has to register in its website and fill in a form, and in cases where households do not have access to internet, a personal meeting with a GAS member is scheduled. After submitting the information, the household’s situation is analyzed and prioritized according to its severity. The first step of the process is to contact the credit institutions or service providers to suggest a restructuring of the credit agreements or contracts that allows the consumers to comply with their financial obligations. If a consensus is not reached, GAS often suggests households to open an insolvency proceeding, while providing legal advice, support and guidance during the process. It should be noted that GAS does not provide its services to everyone who is over-indebted. It does so to individuals
9
whose excessive debt situation arises from involuntary acts or situations such as unemployment, income reduction or disease. Debts of fiscal nature (income taxes, value added taxes and alike) or related to business activities are out of GAS’s scope. They must be of non-professional nature and related to credit entities or service providers, such as telecommunications or electricity companies (GAS, 2016).
4. The Data
The data used in this paper was provided by GAS and collected between 2012 and 2015. The following topics elaborate on the data collection and treatment, and provide some descriptive statistics.
4.1. Data collection and Data treatment
When households request GAS’s assistance by filling in the form in its website, they are required to provide several information such as their income level, amount of expenses and installments, whether or not they are defaulting on financial obligations and demographic variables such as age, professional status and education. When households do not have access to the internet, this information is provided personally in a meeting with a GAS member. The data provided by each household is then added to a database that has all the information previously collected.
While browsing through GAS’s database, we came across two problems concerning the data. First, there was missing data given that some consumers preferred not to reveal information on topics such as job status, marital status or education. Since these observations usually had several missing variables, we ignored them, as estimating the missing values would have
10
introduced bias into the data set. Thus, we sampled 6.479 observations/households from the database, as this was the number of households that disclosed all the necessary information.
The second problem was the existence of outliers. There were observations with expenses or installments whose amount was above 1 million euros; others had incongruent figures, with amounts of installments higher than the amounts of credit. These amounts to 110 observations, which were dropped from the sample. In addition, 128 households reported too low values of income, such as 0,01€ or 0,10€, which we considered data typos. We winsorized these 128 observations by setting them to the 2nd percentile. Our final sample is therefore composed by 6.369 observations.
4.2. Descriptive Statistics
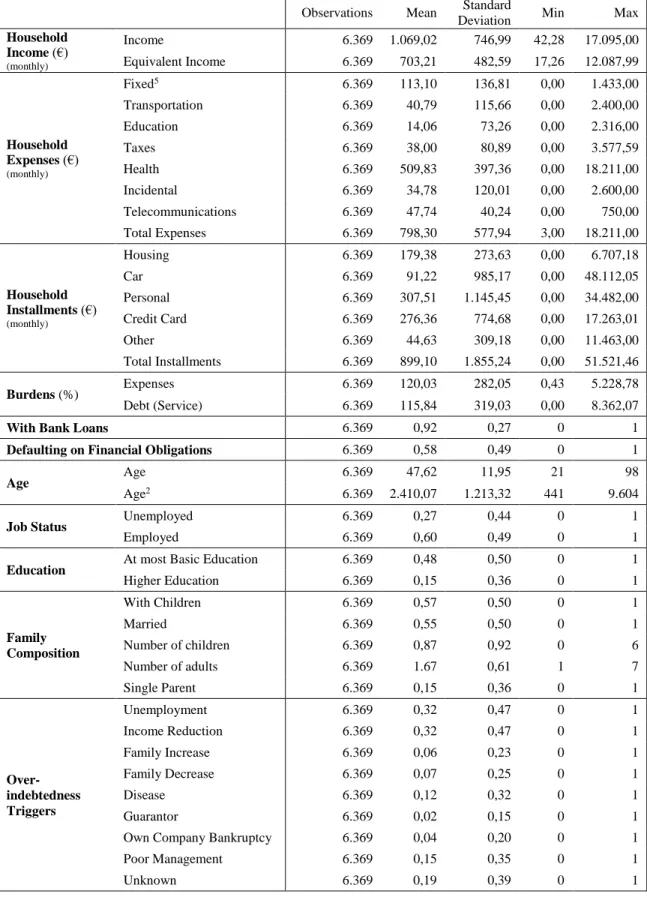
The descriptive statistics of the overall sample used in this study can be seen in Table 1. In Appendix 1, a descriptive statistics that distinguishes households with and without bank loans (named group A and group B, respectively) is also provided, along with the t-test results for comparison purposes.
In Table 1, we present the figures for income along with the equivalent income, which adjusts the household’s income level by dividing it by the square root of its number of elements. We computed total installments by summing all the listed types of installments and the same reasoning was applied for expenses. These amounts were then divided by income to compute the corresponding debt and expenses burdens, which we use as our independent variables in sections 5.3 and 5.4, respectively.
11
5 Fixed expenses include rent, utility bills (electricity, water, cable…), food and clothing.
Table 1: Descriptive Statistics
Observations Mean Standard
Deviation Min Max
Household Income (€) (monthly) Income 6.369 1.069,02 746,99 42,28 17.095,00 Equivalent Income 6.369 703,21 482,59 17,26 12.087,99 Household Expenses (€) (monthly) Fixed5 6.369 113,10 136,81 0,00 1.433,00 Transportation 6.369 40,79 115,66 0,00 2.400,00 Education 6.369 14,06 73,26 0,00 2.316,00 Taxes 6.369 38,00 80,89 0,00 3.577,59 Health 6.369 509,83 397,36 0,00 18.211,00 Incidental 6.369 34,78 120,01 0,00 2.600,00 Telecommunications 6.369 47,74 40,24 0,00 750,00 Total Expenses 6.369 798,30 577,94 3,00 18.211,00 Household Installments (€) (monthly) Housing 6.369 179,38 273,63 0,00 6.707,18 Car 6.369 91,22 985,17 0,00 48.112,05 Personal 6.369 307,51 1.145,45 0,00 34.482,00 Credit Card 6.369 276,36 774,68 0,00 17.263,01 Other 6.369 44,63 309,18 0,00 11.463,00 Total Installments 6.369 899,10 1.855,24 0,00 51.521,46 Burdens (%) Expenses 6.369 120,03 282,05 0,43 5.228,78 Debt (Service) 6.369 115,84 319,03 0,00 8.362,07
With Bank Loans 6.369 0,92 0,27 0 1
Defaulting on Financial Obligations 6.369 0,58 0,49 0 1
Age Age 6.369 47,62 11,95 21 98
Age2 6.369 2.410,07 1.213,32 441 9.604
Job Status Unemployed 6.369 0,27 0,44 0 1
Employed 6.369 0,60 0,49 0 1
Education At most Basic Education 6.369 0,48 0,50 0 1
Higher Education 6.369 0,15 0,36 0 1 Family Composition With Children 6.369 0,57 0,50 0 1 Married 6.369 0,55 0,50 0 1 Number of children 6.369 0,87 0,92 0 6 Number of adults 6.369 1.67 0,61 1 7 Single Parent 6.369 0,15 0,36 0 1 Over-indebtedness Triggers Unemployment 6.369 0,32 0,47 0 1 Income Reduction 6.369 0,32 0,47 0 1 Family Increase 6.369 0,06 0,23 0 1 Family Decrease 6.369 0,07 0,25 0 1 Disease 6.369 0,12 0,32 0 1 Guarantor 6.369 0,02 0,15 0 1
Own Company Bankruptcy 6.369 0,04 0,20 0 1
Poor Management 6.369 0,15 0,35 0 1
12
The variable “Defaulting on Financial Obligations” and “With Bank Loans” are both dummy variables used in section 5.2., where we show the determinants of the probability of defaulting. The former is the independent variable and takes the value of 1 if the household is defaulting on at least one financial obligation, i.e., installments or utility bills, and 0 otherwise, and the latter is one of the explanatory variables which takes the value of 1 if the household has at least one bank loan, and 0 otherwise.
The demographic variables (age, job status, education and family composition) refer to the declarant, i.e., the person that contacted GAS and provided the information. Demographic dummy variables are explained in Table 2.
The over-indebtedness triggers, as mentioned in the introduction, were created based on an open text answer which was included in GAS’s form. This open text answer allows households to provide a brief explanation of their situation, and by using string functions we were able to detect and assign one or more triggers to each household according to it. For example, for the trigger unemployment we looked for words such as “unemployed” or “fired”; for the trigger disease, we looked for words such as “disease”, “illness” or “disability” and the same reasoning applies to the other ones. The unknown trigger was
Table 2: Demographic dummy variables
Unemployed 1 if the declarant is unemployed, 0 if employed or retired Employed 1 if the declarant is employed, 0 if unemployed or retired At most Basic Education 1 if the declarant has at most the 9th grade, 0 otherwise
Higher Education 1 if the declarant has a bachelors, masters or PhD degree, 0 otherwise With Children 1 if the declarant has at least one child, 0 otherwise
Married 1 if the declarant is married, 0 otherwise Single Parent 1 if the declarant is a single parent, 0 otherwise
13
assigned to households that did not disclose any explanation. Each trigger takes the value 1 if such trigger occurred to the household and 0 otherwise.6
5. Results
The following sections are divided in two parts: section 5.1. provides a preliminary analysis of the data and the following sections analyze the determinants of household’s financial situation using the data described above. The analysis focuses on two different variables: the probability of defaulting on financial obligations and the level of debt and expenses burden.
5.1. Preliminary Analysis
In Appendix 3 we provide a Kernel density distribution of the debt burden of households from group A and in Appendix 4, a Kernel density distribution of the expenses burden of all households. Both distributions are skewed to the left because in our sample, we have included households with very high levels of debt or expenses burden. Even though they do not represent the majority of our sample, they should not be seen as outliers and should be included in our study, as they represent the most severe cases of household’s financial problems.
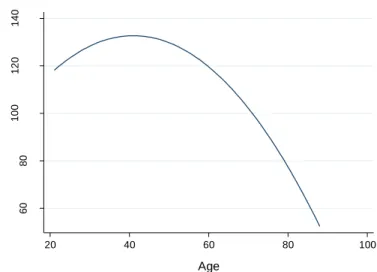
According to the life-cycle theory of income, one expects the debt burden to increase initially, and eventually become decreasing with age. Graphical evidence supporting this statement is given in Figure 1, where the relationship between age and the average debt burden of group A is plotted. Accordingly, and following Alfaro et al. (2012), we will introduce age2 in the regressions.
14
Figure 1: Relationship between Age and average debt burden
To check whether households with higher income levels have lower debt or expenses burdens or if instead, they have a higher predilection for credit or expenditure, we run two regressions of the log of debt and expenses on the log of income. The coefficients for log income are 0,5504 and 0,4588, respectively, implying that both ratios debt/income and expenses/income are decreasing with income.7
5.2. Determinants of Probability of Defaulting
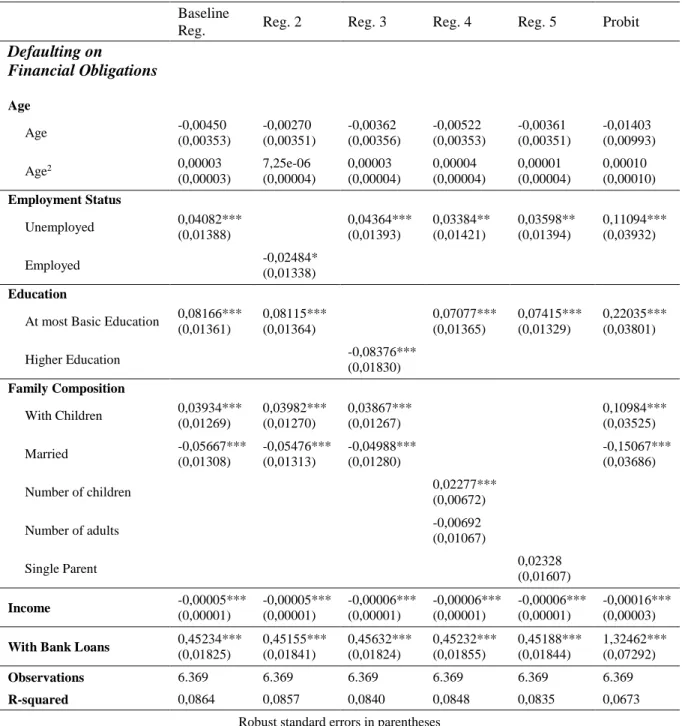
I begin by analyzing the determinants of the probability of defaulting by running several regressions using the “Defaulting on Financial Obligations” variable as the independent variable. We first run a baseline regression and to show that our results are robust, alternative measures of the employment status, education level and family composition were applied. Table 3 exhibits the results from these regressions.
7 Both regressions are significant at a 99% confidence level.
60 80 1 0 0 1 2 0 1 4 0 Deb t b u rd e n 20 40 60 80 100 Age
15
Our results suggest that unemployment, lower levels of education and having children have a significant and positive impact on the probability of defaulting, which matches the results obtained by Costa (2012), whose paper addresses the probability of defaulting of the
Table 3: Probability of defaulting
Baseline
Reg. Reg. 2 Reg. 3 Reg. 4 Reg. 5 Probit
Defaulting on Financial Obligations Age Age -0,00450 (0,00353) -0,00270 (0,00351) -0,00362 (0,00356) -0,00522 (0,00353) -0,00361 (0,00351) -0,01403 (0,00993) Age2 0,00003 (0,00003) 7,25e-06 (0,00004) 0,00003 (0,00004) 0,00004 (0,00004) 0,00001 (0,00004) 0,00010 (0,00010) Employment Status Unemployed 0,04082*** (0,01388) 0,04364*** (0,01393) 0,03384** (0,01421) 0,03598** (0,01394) 0,11094*** (0,03932) Employed -0,02484* (0,01338) Education
At most Basic Education 0,08166*** (0,01361) 0,08115*** (0,01364) 0,07077*** (0,01365) 0,07415*** (0,01329) 0,22035*** (0,03801) Higher Education -0,08376*** (0,01830) Family Composition With Children 0,03934*** (0,01269) 0,03982*** (0,01270) 0,03867*** (0,01267) 0,10984*** (0,03525) Married -0,05667*** (0,01308) -0,05476*** (0,01313) -0,04988*** (0,01280) -0,15067*** (0,03686) Number of children 0,02277*** (0,00672) Number of adults -0,00692 (0,01067) Single Parent 0,02328 (0,01607) Income -0,00005*** (0,00001) -0,00005*** (0,00001) -0,00006*** (0,00001) -0,00006*** (0,00001) -0,00006*** (0,00001) -0,00016*** (0,00003)
With Bank Loans 0,45234***
(0,01825) 0,45155*** (0,01841) 0,45632*** (0,01824) 0,45232*** (0,01855) 0,45188*** (0,01844) 1,32462*** (0,07292) Observations 6.369 6.369 6.369 6.369 6.369 6.369 R-squared 0,0864 0,0857 0,0840 0,0848 0,0835 0,0673
Robust standard errors in parentheses *** p<0.01, ** p<0.05, * p<0.1
16
Portuguese households. Other papers show similar results: Gerardi et al. (2015) obtained the same result for unemployment; Alfaro et al. (2012) found the same relation with the level of education, and Brandrup et al. (2011) showed that having children has a positive impact on the probability of defaulting, since it puts a greater pressure on the family budget, which is likely to provoke arrears on credit commitments and utility bills. Conversely, being married has a negative effect on the probability of default, which as explained by Alfaro et al. (2012) occurs because married couples tend to have two incomes, which allows them to diversify the risk of defaulting.
Regarding income, Costa (2012) and Alfaro et al. (2012) also showed that income has a significant negative impact on the probability of defaulting. Lastly, households with bank loans are more prone to default. One possible reason is the fact that households are less likely to default on utility bills, as doing so deprives them from using daily basic services, such as water or electricity. Therefore, households from group B (without bank loans) tend to default less.
The variable “Defaulting on Financial Obligations” was also regressed against the over-indebtedness triggers created, excluding the unknown trigger. We run two regressions (OLS and Probit) using only triggers and then added control variables to check for the robustness of the results. Table 4 shows the results.
The unemployment trigger exhibits a significant impact, which matches the results obtained in Table 3. The same result is obtained for the income reduction trigger. Yet, as one might expect, its effect is not as severe as unemployment.
17
8 Marginal Effects computed at mean Age, Age2 and Income, and with At most Basic Education, With Children and Married equal to zero.
Table 4: Probability of defaulting – Over-indebtedness triggers8
Baseline Reg. Baseline Reg. (with Controls) Baseline Probit Marginal Effects Baseline Probit (with Controls) Marginal Effects Defaulting on Financial Obligations Over-indebtedness Triggers Unemployment 0,08783*** (0,01312) 0,07792*** (0,01322) 0,22843*** (0,03451) 0,08965*** (0,01347) 0,20634*** (0,03549) 0,08192*** (0,01397) Income Reduction 0,04046*** (0,01351) 0,06739*** (0,01359) 0,10479*** (0,03525) 0,04152*** (0,01395) 0,18117*** (0,03652) 0,07201*** (0,01442) Family Increase 0,00128 (0,02723) -0,00335 (0,02644) 0,00248 (0,07075) 0,00099 (0,02815) -0,00846 (0,07039) -0,00337 (0,02805) Family Decrease 0,04634* (0,02417) 0,02381 (0,02405) 0,12078* (0,06378) 0,04800* (0,02533) 0,06367 (0,06447) 0,02537 (0,02568) Disease 0,04827** (0,01892) 0,05531*** (0,01900) 0,12616** (0,05015) 0,05009** (0,01988) 0,14810*** (0,05136) 0,05899*** (0,02041) Guarantor 0,07767** (0,03764) 0,08018** (0,03674) 0,20898** (0,10555) 0,08307** (0,04190) 0,22518** (0,10583) 0,08970** (0,04211) Own Company Bankruptcy 0,04888*
(0,02896) 0,06457** (0,02851) 0,12612* (0,07675) 0,05014* (0,03050) 0,17181** (0,07729) 0,06845** (0,03074) Poor Management -0,02617 (0,02099) -0,01188 (0,02050) -0,06398 (0,05291) -0,02547 (0,02104) -0,02567 (0,05258) -0,01023 (0,02095) Controls Age -0,00277 (0,00363) -0,00737 (0,00967) Age2 0,00001 (0,00003) 0,00003 (0,00010) At most Basic Education 0,09822***
(0,01395) 0,25682*** (0,03754) With Children 0,04027*** (0,01298) 0,10884*** (0,03451) Married -0,05840*** (0,01372) -0,15180*** (0,03716) Income -0,00006*** (0,00001) -0,00015*** (0,00003) Observations 6.369 6.369 6.369 6.369 6.369 6.369 R-squared 0,0129 0,0374 0,0095 0,0281
Robust standard errors in parentheses *** p<0.01, ** p<0.05, * p<0.1
18
expenses with medications and medical treatments. Furthermore, as Elaine E. Bedel argues in an article published by Bedel Financial Consulting, Inc, if having a disease comes with a limited capacity to work, income is likely to be reduced, which compromises household’s ability to fulfill financial obligations (Bedel Financial Consulting, Inc, 2013).
As known, a guarantor is someone who guarantees to pay someone else’s debt if he/she defaults on a credit commitment, and when such thing occurs, the guarantor is obliged to pay the debt. The results show that this circumstance, in turns, impacts the guarantor’s probability of defaulting. Similarly, households in which an owned company goes bankrupt (or one in which a family member is partner) are more likely to default.
5.3. Determinants of Debt burden
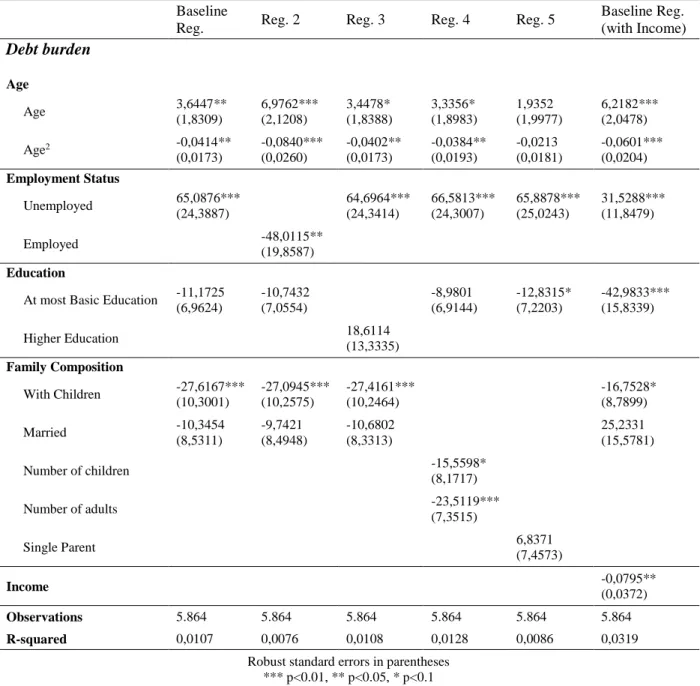
In this section we analyze the determinants of the debt burden. As mentioned in the descriptive statistics section, the debt burden is the total amount of installments divided by the household’s income. We restrict this analysis to households from group A, as they are the ones with bank loans, and therefore, installments. The same methodology applied in the probability of defaulting is applied here: we run a baseline regression and then provide alternative measures of some variables to show that our results are robust. The results are presented in Table 5.
As Table 5 shows, age has a significant impact on the debt burden. Age has a positive coefficient and Age2 a negative one, which matches the relationship between age and debt
burden depicted in Figure 1 and confirms the life-cycle theory of income mentioned in the preliminary analysis.
19
Regarding unemployment, the results show that being unemployed has a significant positive impact on the debt burden level, as concluded by Knobloch et al. (2008), and that having children has a significant negative impact. Also, once introduced in the baseline regression, income exhibits a significant negative impact on debt burden level. Even though being married is not significant, it is worth drawing attention to the fact that, its introduction
Table 5: Determinants of debt burden
Baseline
Reg. Reg. 2 Reg. 3 Reg. 4 Reg. 5
Baseline Reg. (with Income) Debt burden Age Age 3,6447** (1,8309) 6,9762*** (2,1208) 3,4478* (1,8388) 3,3356* (1,8983) 1,9352 (1,9977) 6,2182*** (2,0478) Age2 -0,0414** (0,0173) -0,0840*** (0,0260) -0,0402** (0,0173) -0,0384** (0,0193) -0,0213 (0,0181) -0,0601*** (0,0204) Employment Status Unemployed 65,0876*** (24,3887) 64,6964*** (24,3414) 66,5813*** (24,3007) 65,8878*** (25,0243) 31,5288*** (11,8479) Employed -48,0115** (19,8587) Education
At most Basic Education -11,1725 (6,9624) -10,7432 (7,0554) -8,9801 (6,9144) -12,8315* (7,2203) -42,9833*** (15,8339) Higher Education 18,6114 (13,3335) Family Composition With Children -27,6167*** (10,3001) -27,0945*** (10,2575) -27,4161*** (10,2464) -16,7528* (8,7899) Married -10,3454 (8,5311) -9,7421 (8,4948) -10,6802 (8,3313) 25,2331 (15,5781) Number of children -15,5598* (8,1717) Number of adults -23,5119*** (7,3515) Single Parent 6,8371 (7,4573) Income -0,0795** (0,0372) Observations 5.864 5.864 5.864 5.864 5.864 5.864 R-squared 0,0107 0,0076 0,0108 0,0128 0,0086 0,0319
Robust standard errors in parentheses *** p<0.01, ** p<0.05, * p<0.1
20
changes its sign to a positive one. A likely explanation is that the negative impact of being married seen in the other regressions is now being absorbed by the variable income, and the change to a positive sign in the variable married reflects the greater ease in obtaining credit that married households have when compared to single households. Yet, this result should be taken with a lot of caution, since income is, by construction, an endogenous variable which will cause the estimators to be inconsistent.
5.4. Determinants of Expenses burden
Lastly, we analyze the determinants of the expenses burden for our entire sample, computed as total amount of expenses over income. This analysis is important for two reasons: first, it provides a measurement of financial burden that includes households from group B, which have also expressed financial difficulties; second, it allows comparisons between the debt and expenses burden. The methodology used is the same applied in the debt burden analysis. Table 6 presents the results.
The first difference that we observe is that age is not significant for the expenses burden. On the other hand, being unemployed exhibits the same significant positive effect, yet with a smaller impact as the coefficient indicates.
The level of education remains insignificant, while having children maintains its significance, yet with a different sign which is now positive, most likely due to increased expenditures in groceries, clothing, health and transportation, as Brandrup et al. (2011) showed. Still on family composition, the results also reveal that being married and having more adults in the household has a negative impact on the ratio, mainly due to household economies of scale (Logan, 2011). Accordingly, being a single parent has positive effect.
21
6. Conclusions
Most of the empirical findings of this study confirm previous results found in other studies. The results suggest that unemployment is the most relevant determinant of households’ probability of defaulting and level of debt and expenses burden as it exhibits a high
Table 6: Determinants of expenses burden
Baseline
Reg. Reg. 2 Reg. 3 Reg. 4 Reg. 5
Baseline Reg. (with Income) Expenses burden Age Age -0,1216 (0,9654) 2,2703 (1,6040) -0,2136 (0,9129) -0,1608 (1,3233) -0,4419 (0,7616) 3,5732 (2,9568) Age2 -0,0124 (0,0162) -0,0431* (0,0259) -0,0108 (0,0151) -0,0132 (0,0215) -0,0101 (0,0110) -0,0398 (0,0320) Employment Status Unemployed 46,0806*** (15,6273) 46,8497*** (16,1100) 46,3734*** (15,5899) 46,5025*** (16,0613) 4,0730 (12,4968) Employed -37,9285*** (12,9053) Education
At most Basic Education 5,0942 (3,9991) 4,9659 (3,9805) 5,2001 (4,2037) 5,1401 (3,8598) -35,7481 (22,3134) Higher Education 6,4831 (8,2723) Family Composition With Children 13,7056** (6,4135) 14,2959** (6,3955) 13,6715** (6,3861) 26,5991*** (5,7063) Married -16,2082*** (5,1436) -15,8295*** (5,0754) -15,2357*** (4,6266) 29,5338 (24,3661) Number of children 2,8191 (8,7313) Number of adults -13,5515*** (4,4951) Single Parent 41,2225*** (13,7520) Income -0,1000 (0,0615) Observations 6.369 6.369 6.369 6.369 6.369 6.369 R-squared 0,0115 0,0101 0,0115 0,0113 0,0133 0,0640
Robust standard errors in parentheses *** p<0.01, ** p<0.05, * p<0.1
22
significance level and a consistent sign of its coefficient across all our outcome variables. Family composition, namely being married and having children, seem to be important as well, along with the income level. Yet, it should be mentioned that these results do not imply causality.
Over-indebtedness is an issue that affects several Portuguese households, whose impact goes beyond the financial one. Therefore, it is of the utmost importance to address this problem. Understanding the determinants of over-indebtedness allows central, state or local institutional units to act on the problem. Their intervention can be through social transfers targeted to these families or through the development of institutions like Instituto do Emprego e Formação Profissional (IEFP), which can encourage the creation of jobs, strengthen more stable work contracts and tackle precariousness in the labor market.
We should highlight that these results are not representative of the overall Portuguese population, as they focus specifically on households that perceive themselves as over-indebted. To deepen our understanding about the problem, an on-going study of the topic with a more diverse sample is necessary. Only in this way will it be possible to tackle the problems that such phenomenon entails.
References
[1] Achtziger, Anja, et al. "Debt out of control: The links between self-control, compulsive buying, and real debts." Journal of Economic Psychology 49 (2015): 141-149.
[2] d'Alessio, Giovanni, and Stefano Iezzi. "Household over-indebtedness: definition and measurement with Italian data." Bank of Italy Occasional Paper 149 (2013).
23
(2012).
[4] Banco de Portugal. "Relatório do inquérito à literacia financeira da população portuguesa 2015." Banco de Portugal, Euro sistema. (2016).
[5] Bedel, Elaine E. 2013. "Financial Impact of Chronic Illness." Bedel Financial Consulting, Inc – Elaine’s Blog, September 30. URL: http://www.bedelfinancial.com/blog/elaines-blog/financial-impact-of-chronic-illness/206/
[6] Betti, Gianni, et al. "Consumer over-indebtedness in the EU: measurement and characteristics." Journal of Economic Studies 34.2 (2007): 136-156.
[7] Brandrup, Jason D., and Paula L. Mance. "How do pregnancy and newborns affect the household budget?" Family Matters 88 (2011): 31.
[8] Casagrande, Giulia. "The impact of financial literacy on over-indebted Portuguese Families." Diss. 2016.
[9] Civic Consulting of the Consumer Policy Evaluation Consortium. "The over-indebtedness of European households: updated mapping of the situation, nature and causes, effects and initiatives for alleviating its impact." Summary document for stakeholder workshop. (2013).
[10] Costa, Sónia. "Households’ Default Probability: An Analysis Based on the Results of the HFCS." Economic Bulletin and Financial Stability Report Articles. (2012).
[11] DECO Proteste. 2016. "Como travar o sobre-endividamento com a DECO." DECO Proteste, November 4. URL: https://www.deco.proteste.pt/familia-consumo/orcamento-familiar/dossies/como-travar-o-sobre-endividamento-com-a-deco.
[12] DECO Proteste. 2016. "Mission, Values and Action." DECO Proteste, May 31. URL:
24
[13] DGPJ. "Estatísticas trimestrais sobre processos de falência, insolvência e recuperação de empresas e sobre processos especiais de revitalização (2007-2016) - 1.º Trimestre de 2016." (2016).
[14] Eurostat. 2016. "The share of persons at risk of poverty or social exclusion in the EU back to its pre-crisis level: Contrasting trends across Member States." Eurostat Newsrelease, October 17. URL: http://ec.europa.eu/eurostat/documents/2995521/7695750/3-17102016-BP-EN.pdf/30c2ca2d-f7eb-4849-b1e1-b329f48338dc
[15] Ferreira, A. "Household over-indebtedness: Report to the Economic and Social Committee." Brussels: European Communities. (2000).
[16] GAS. 2016. GAS. URL: http://gasdeco.net/sobre-o-gasdeco/ (accessed November 2, 2016).
[17] Gathergood, John. "Self-control, financial literacy and consumer over-indebtedness." Journal of Economic Psychology 33.3 (2012): 590-602.
[18] Gerardi, Kristopher, et al. "Can't Pay or Won't Pay? Unemployment, Negative Equity, and Strategic Default. No. w21630." National Bureau of Economic Research, 2015.
[19] Keese, Matthias. "Triggers and determinants of severe household indebtedness in Germany." (2009).
[20] Keese, Matthias. "Who feels constrained by high debt burdens? Subjective vs. objective measures of household debt." Journal of Economic Psychology 33.1 (2012): 125-141 [21] Knobloch, Michael, Udo Reifner, and Wilfried Laatz. "iff-Überschuldungsreport 2008: Private Überschuldung in Deutschland." iff-Überschuldungsreport 2008 (2008).
[22] Logan, Trevon D. "Economies of scale in the household: Puzzles and patterns from the American past." Economic Inquiry 49.4 (2011): 1008-1028.
over-25
indebtedness." Journal of Pension Economics and Finance 14.04 (2015): 332-368.
[24] OECD/INFE. "Financial Education and the Crisis: Policy Paper and Guidance." (2009). [25] OECD/INFE. "OECD/INFE High-Level Principles on National Strategies for Financial Education." (2012).
[26] OECD/INFE. "International Survey of Adult Financial Literacy Competencies." (2016). [27] Oksanen, Atte, Mikko Aaltonen, and Kati Rantala. "Social determinants of debt problems in a Nordic welfare state: a Finnish register-based study." Journal of Consumer Policy 38.3 (2015): 229-246.
[28] Persson, A. "Over-indebtedness-a growing problem." Scandinavian Studies in Law 50 (2007): 463-476.
[29] REDE EUROPEIA ANTI-POBREZA. "Indicadores sobre a pobreza: dados europeus e nacionais: atualização (março, 2014)." Porto: EAPN (2014).
[30] Russell, Helen, Christopher T. Whelan, and Bertrand Maître. "Economic vulnerability and severity of debt problems: An analysis of the Irish EU-SILC 2008." European Sociological Review (2012): jcs048.
26
Appendix
Appendix 1: Descriptive Statistics per group
Group A - Households with bank loans Group B - Households without bank loans
Observations Mean Standard
Deviation Min Max Observations Mean
Standard
Deviation Min Max t-test
Household Income (€) (monthly) Income 5.864 1.069,10 708,96 42,28 13.050,00 505 1.068,11 1.096,92 42,28 17.095,00 0,0284 Equivalent Income 5.864 703,29 453,50 17,26 9.227,74 505 702,25 741,68 21,14 12.087,99 0,0464 Household Expenses (€) (monthly) Fixed 5.864 112,02 135,85 0,00 1.433,00 505 125,68 147,09 0,00 1.150,00 -2,1548 Transportation 5.864 40,38 114,61 0,00 2.400,00 505 45,62 127,25 0,00 1.165,00 -0,9782 Education 5.864 14,02 73,22 0,00 2.316,00 505 14,53 73,77 0,00 900,00 -0,1493 Taxes 5.864 38,57 82,91 0,00 3.577,59 505 31,36 51,43 0,00 400,00 1,9224 Health 5.864 502,10 324,27 0,00 6.049,00 505 599,65 873,46 0,00 18.211,00 -5,3049 Incidental 5.864 34,50 117.60 0,00 2.600,00 505 38,02 145,23 0,00 1.700,00 -0,6324 Telecommunications 5.864 47,42 38,33 0,00 690,00 505 51,43 57,92 0,00 750,00 -2,1513 Total Expenses 5.864 789,00 531,42 3,00 8.568,00 505 906,29 960,37 3,00 18.211,00 -4,3825 Household Installments (€) (monthly) Housing 5.864 194,83 279,85 0,00 6.707,18 505 0,00 0,00 0,00 0,00 15,6442 Car 5.864 99,07 1026,34 0,00 48.112,05 505 0,00 0,00 0,00 0,00 2,1691 Personal 5.864 333,99 1.190,05 0,00 34.482,00 505 0,00 0,00 0,00 0,00 6,3064 Credit Card 5.864 300,16 802,91 0,00 17.263,01 505 0,00 0,00 0,00 0,00 8,4004 Other 5.864 48,47 321,93 0,00 11.463,00 505 0,00 0,00 0,00 0,00 3,3833 Total Installments 5.864 976,53 1.913,83 1,00 51.521,46 505 0,00 0,00 0,00 0,00 11,4656 Burdens (%) Expenses 5.864 113,99 261,12 0,63 5.082,86 505 190,23 454,50 0,43 5.228,78 -5,8437 Debt (Service) 5.864 125,82 330,59 0,13 8.362,07 505 0,00 0,00 0,00 0,00 8,5519
With Bank Loans 5.864 1 0 1 1 505 0 0 0 0 .
Defaulting on Financial Obligations 5.864 0,62 0,49 0 1 505 0,16 0,37 0 1 20,4820
Age Age 5.864 47,85 11,99 21 88 505 44,89 11,22 22 98 5,3615
27
Job Status Unemployed 5.864 0,27 0,44 0 1 505 0,26 0,44 0 1 0,1549
Employed 5.864 0,59 0,49 0 1 505 0,68 0,47 0 1 -4,0045
Education At most Basic Education 5.864 0,48 0,50 0 1 505 0,38 0,48 0 1 4,6735
Higher Education 5.864 0,15 0,36 0 1 505 0,18 0,38 0 1 -1,8737 Family Composition With Children 5.864 0,56 0,50 0 1 505 0,59 0,49 0 1 -0,9578 Married 5.864 0,55 0,50 0 1 505 0,52 0,50 0 1 1,3118 Number of children 5.864 0,86 0,92 0 6 505 0,91 0,94 0 5 -1,2159 Number of adults 5.864 1,67 0,61 1 7 505 1,63 0,60 1 5 1,2338 Single Parent 5.864 0,15 0,36 0 1 505 0,16 0,37 0 1 -0,5416 Over-indebtedness Triggers Unemployment 5.864 0,33 0,47 0 1 505 0,22 0,42 0 1 5,1064 Income Reduction 5.864 0,33 0,47 0 1 505 0,17 0,38 0 1 7,4120 Family Increase 5.864 0,06 0,23 0 1 505 0,04 0,19 0 1 2.0916 Family Decrease 5.864 0,07 0,26 0 1 505 0,04 0,19 0 1 2.8609 Disease 5.864 0,12 0,33 0 1 505 0,06 0,23 0 1 4,6134 Guarantor 5.864 0,03 0,16 0 1 505 0,01 0,12 0 1 1,6110
Own Company Bankruptcy 5.864 0,04 0,21 0 1 505 0,03 0,16 0 1 1,9946
Poor Management 5.864 0,15 0,36 0 1 505 0,11 0,31 0 1 2,6489
28
Appendix 3: Kernel density distribution of debt burden
0 .0 0 0 2 .0 0 0 4 .0 0 0 6 .0 0 0 8 .0 0 1 D e n si ty 0 2000 4000 6000 8000 Debt burden
kernel = epanechnikov, bandwidth = 6.8263
Appendix 2: Over-indebtedness triggers
Unemployment Long-term or short-term unemployment
Income Reduction Reduction in base salary; Reduction or loss of commissions, allowances or overtime pay; Payment delays; Liens; Retirement
Family Increase Childbirth; Support to family member(s)
Family Decrease Divorce; Separation; Death of household member(s)
Disease Diseases; Illnesses; Disabilities; Chronic diseases; Hospital treatments
Guarantor Enforcement of guarantor obligations
Own Company Bankruptcy Bankruptcy of owned company; Bankruptcy of company in which a family member is partner
Poor Management Mismanagement of household’s budget; Too much expenses; Too much credits Unknown Households which did not provide a description of their financial situation
29
Appendix 4: Kernel density distribution of expenses burden
0 .0 0 2 .0 0 4 .0 0 6 D e n si ty 0 1000 2000 3000 4000 5000 Expenses burden kernel = epanechnikov, bandwidth = 5.4751