i A Work Project, presented as part of the requirements for the Award of a Master’s degree in Economics / Finance / Management from the Nova School of Business and Economics.
Analysis of the Referral Mechanism between
Family Doctors and Specialists using Social
Network Analysis
João Manuel Caixinha Casal da Veiga
Work project carried out under the supervision of:
Co Advisor: Qiwei Han
Co Advisor: Miguel Castro Neto
ii
ABSTRACT
The following document represents a master thesis dissertation, that consists in the development of a research project in which its main objective is to understand the referral mechanism between primary care physicians and specialists using network science and other tools. The referral network of a healthcare provider denotes an important source of costs and revenue, as it can affect directly the management of its clients and employees, namely through the quality of the care being provided and the level of satisfaction being achieved. The data provided for the development of the study was given by a European industry leader in private healthcare. It is important to highlight that this research study attempts maps the relationships between general practitioners and specialists using a large dataset of doctor’s appointments during 2012 and 2017. These relationships were mapped under the assumptions that two doctors had to share at least one patient, and the period between the two appointments could not be longer than 30 days. Moreover, the impact of the dynamics of the relationships between the two types of doctors in the primary-specialty referral mechanism is done by analyzing the referral patterns exhibited in network, and the performance of the physicians in terms of the centrality measures degree, betweenness and closeness. Additionally, two regression analysis are performed with the objective of identifying potential characteristics that might be affecting the referral rates of doctors. These characteristics include the social network metrics and the physician’s backgrounds.
KEYWORDS
Social Network Analysis; Referral Mechanism; Informal Networks; Private Healthcare
This work used infrastructure and resources funded by Fundação para a Ciência e a Tecnologia (UID/ECO/00124/2013, UID/ECO/00124/2019 and Social Sciences DataLab, Project 22209), POR Lisboa (LISBOA-01-0145-FEDER-007722 and Social Sciences DataLab, Project 22209) and POR Norte (Social Sciences DataLab, Project 22209).
iii
INDEX
1.
Introduction ... 1
1.1.
Research Objectives ... 1
2.
Literature review ... 2
2.1.
Healthcare Industry ... 2
2.2.
Healthcare Industry in Portugal ... 3
2.3.
Primary care Doctors (PCP) and Specialists ... 3
2.4.
The referral Mechanism Between Primary Care Doctors and Specialists ... 4
2.5.
Patterns in the referral Mechanism between PCP and Specialists ... 5
3.
Methodology ... 9
3.1.
Introduction ... 9
3.2.
Data Pre-Processing ... 9
3.2.1.
Missing Values ... 10
3.2.2.
Outliers ... 11
3.2.3.
Data Validation ... 12
3.3.
Primary-Specialty Referral Network ... 13
3.3.1.
Primary-Specialty Network Mapping ... 13
3.3.2.
Bipartite Random Network ... 15
3.3.3.
Centrality Measures and Others ... 15
3.4.
Primary-Specialty Regression Analysis ... 17
4.
Results and discussion ... 18
4.1.
Primary-Specialty Network ... 18
4.1.1.
Primary-Specialty Referral Patterns ... 19
4.1.2.
Primary-Specialty Centrality Measures ... 21
4.1.3.
Primary-Specialty Community Analysis ... 22
5.
Conclusions ... 23
6.
Bibliography ... 26
7.
Appendix ... 30
7.1.
Specialties Frequency ... 30
7.2.
Closed Triangle ... 31
7.3.
Bipartite Cycles ... 31
7.4.
Gender Distribution Per Doctor Classification ... 31
7.5.
Gender Distribution Per Isolated Doctor Classification ... 32
iv
7.7.
Differentiated Care Referrals Distribution ... 32
7.8.
Isolated Primary Care Referrals Distribution ... 33
7.9.
Isolated Differentiated Care Referrals Distribution ... 33
7.10.
Number Of Hospitals in Common ... 33
7.11.
Age Difference Distribution ECDF ... 34
7.12.
Specialists Perceived Clinical Expertise ... 34
7.13.
Isolated Age & Perceived Clinical Expertise ... 34
7.14.
Degree Centrality Distribution ... 35
7.15.
Betweenness Centrality Distribution ... 35
7.16.
Closeness Centrality Distribution ... 35
v
LIST OF FIGURES
Figure 1 - Birth Year Distribution... 11
Figure 2 - Years of Practice Distribution ... 12
Figure 3 - Bipartite Network ... 14
vi
LIST OF TABLES
Table 1- Doctor Specialties ... 4
Table 2 - Factors and Reasons for referral between Doctors ... 6
Table 3 - Initial Doctor Table ... 10
Table 4 – Initial Doctor Table Missing Values ... 10
Table 5 - Academic Degree Values ... 11
vii
LIST OF ABBREVIATIONS AND ACRONYMS
WHO World Healthcare Organization
OCDE Organization for Economic Cooperation and Development
CAGR Compounded Annual Growth Rate
NHS National Healthcare Service
PCP Primary Care Physician
GP General Practitioner
HIT Healthcare Information Technology
PCMH Patient Centered Medical Homes
ACO Accountable Care Organizations
ACSS Administração Central do Sistema de Saúde
1
1. INTRODUCTION
The relationship between a primary care physician1 (pcp) and a specialist (sp) represents a relevant communication channel for the healthcare system, as it can deeply influence the outcome of a patient’s treatment quality and the level of satisfaction regarding the care provided by a healthcare institution (Kinchen, Cooper, Levine, Wang, & Powe, 2004). Additionally, it can act as a significant driver of costs (Barnett, Landon, O’Malley, Keating, & Christakis, 2011).
Having knowledge of the relationships established in a referral mechanism, between pcp and sp, can represent an important source of information to manipulate the overall network for the benefit of healthcare providers, as doctors are influenced by their respective networks (B.E. et al., 2012). An efficient healthcare referral system is proven to improve the ability of both types of physicians to provide better quality treatment to their patients (Care, Referral, Means, & Problems, 2019).
This dissertation presents an approach in which the main objective is to better understand the relationship between doctors in primary care and specialists. Specifically, what might be the potential impact of its dynamics in the informal structure, that is the primary-specialty referral network mechanism, using network science and other tools. From an extensive dataset with 9,173,891 patient consultations records, more than 1.3 million unique patients and 2171 unique doctors it was generated a bipartite social network with 459 connected general practitioners, 14 isolated family doctors, 1487 connected specialist and 211 isolated doctors certified in differentiated care. Additionally, the 1946 connected doctors are linked between each other by no more than 59,065 edges. This network was further augmented with the information regarding doctors’ backgrounds, their age, the number of years of medical practice, gender and others.
A large percentage of the existent literature focus on the use of descriptive methods to identify and describe patterns based on the informal relationships between primary care doctors and specialists, such as doctor specialties, the patient diagnosis, and disease severity (An, O’Malley, Rockmore, & Stock, 2018). In that sense, this dissertation act as a complement to other research studies, as it allows to validate, or not, patterns that have been recognized to affect the referral decision process between the two types of doctors. Additionally, it is investigated if certain network science metrics have an impact or not in the primary-specialty referral mechanism.
1.1. R
ESEARCHO
BJECTIVESThe research purposes of this dissertation were to add to the current literature more information about the referral patterns of a primary-specialty referral system modelled as a bipartite network and explore its potential inefficiencies. Moreover, it was presented the opportunity to test the hypothesis that the different characteristics of a doctor’s background and social network centrality measures have an impact or not in the referral rate of physician. From the perspective of the one making the referrals (pcp) and from the perspective of the one receiving them (sp).
2
2. LITERATURE REVIEW
In this section it is provided a contextualization of the healthcare industry, by making a helicopter approach at the global landscape (zoom out) and focusing on the Portuguese healthcare system (zoom in). Furthermore, an overview of the referral mechanism between Primary Care Doctors and Specialists will be made, along with its impact to the different type of individuals involved in the process: patients, doctors and respective healthcare providers. Additionally, a synopsis of the patterns so far studied will be referred. To conclude, an overview on the methodology of social network analysis is written for further understanding on how it can be applied to study of the referral mechanism between PCP and Specialist doctors, along with the description of its characteristics.
2.1.
H
EALTHCAREI
NDUSTRYAccording to the World Health Care Organization (WHO), health can be seen as a state physical, mental and social well-being and not only the absence of sickness or a disease (Larson, 1996). In 2017 it was estimated that In terms of access to essential healthcare half of the worldwide population did not have access (WHO, 2017).
The amount spent in healthcare by households varies according to the country. In 2017 was estimated that the healthcare spending per capita in India to be 238 dollars while in the United States of America was approximately 34 times higher (8047 dollars). In the particular case of Portugal, the household spending in health is roughly 2000 dollars, 1925 to be more precisely (OCDE, 2019).
Between the years of 2013 and 2017 it was registered an increase in healthcare spending (2.9%) and is still expected to grow by even larger numbers, as until 2022 is expected for healthcare spending to have an annual growth of 5.4% (CAGR). This growth is associated with the growing needs of healthcare of the elderly population, the increase of the labour costs in the industry, the advances in treatments, the development of new healthcare technologies, and the expansion of healthcare coverage broaden up to new markets (Deloitte, 2019).
The healthcare stakeholders are investing in a new vision for the healthcare industry in which, instead of their goal being to treat their clients when they are sick already, is to create a system that promotes the well-being, prevention and early intervention on minor or serious diseases. The objective of this to develop of the concept of smart health in order to drive innovation, to reduce costs both to the service provider and for the patient while increasing the quality of the treatments (Deloitte, 2019).
Healthcare organizations are experiencing a state of uncertainty in the health economy as profits have been shrinking, new competitors are entering new markets, personalized medicine is becoming a certainty, disruptive technologies and clinical advances are constantly entering in the market. The healthcare sector is expected to invest 280.25 billion dollars by 2021 in health technologies, related products and services (Deloitte, 2019). Therefore, this reality is creating a sense of urgency in healthcare providers to decide now whether they want to invest to be a market leader, a follower or a niche player (Deloitte, 2019). The factors that dictate the competition within private operators can be summarized to reputation, clinical excellence, technology, price and client satisfaction (Deloitte, 2019).
3
2.2. H
EALTHCAREI
NDUSTRY INP
ORTUGALWhen Portugal was under the government of a dictatorship the healthcare system in Portugal was fragmented in, private healthcare and state hospitals which were usually located in important urban centers. In 1958, the Portuguese health ministry was created. Until 1970 Portugal was one of the worst countries with access to essential care in the European Union. After 1971, it was created a new system where each districted had two different infrastructures implemented, healthcare centers and hospitals. The current national healthcare (NHS) was then created in 1974 with the democratic purpose of making healthcare available to everyone (Baganha, Ribeiro, & Pires, 2002). The coexistence of public and private healthcare is due to the fact the national healthcare service is not able to cover the entire Portuguese population (Baganha et al., 2002).
Currently the Portuguese NHS administration is divided into five major health regions: Norte, Centro, Lisboa and Vale do Tejo, Alentejo and Algarve. Their headquarters are respectively, Porto, Coimbra, Lisboa, Évora, and Faro. Each region is then divided into sub-regions corresponding to districts. In each district is expected for the healthcare services to be ensure by healthcare centers and hospitals. Nowadays, healthcare centers are in charge of providing the primary healthcare to the Portuguese population, with respect to the national public health sector (Baganha et al., 2002).
When compared with other countries worldwide, the number of doctors per 1000 inhabitants in Portugal is estimated to be above the average by registering a number of 4,26 doctors against the average estimation of 3,2 of the OCDE and its 34 state members. In Portugal, is has been forecasted that approximately 600 000 Portuguese still do not have a family doctor (Notícias, 2019). In addition, the number of patients that that a General Practitioner has to see has increase from 1550 in 2011 to 1900 in 2018 (Notícias, 2019), and there are regions that register extreme numbers like 2500 (Teixeira, 2018).
2.3. P
RIMARY CARED
OCTORS(PCP)
ANDS
PECIALISTSPrimary care denotes a connection for individuals that requests hospital services in a world where healthcare is more specialized than ever, therefore more fragmented. Thus, Primary Care doctors, also known as General Practitioners or family doctors, often represent the first point of access of the healthcare system. Additionally, they are the ones that are more likely to develop long term relationships, as they regularly follow patients for long periods (University, 2018).
The training of a PCP is particularly focused on giving practitioners the necessary tools to ensure that they have the best first contact and provide quality continuing care of patients undiagnosed signs. Furthermore, the medical expertise’s that are comprised in this category of doctors include family medicine, internal medicine and pediatrics1 (American Academy of Family Physicians, 2016).
Therefore, the remaining specialties such as cardiovascular surgery, ophthalmology along with more
1 The term Primary Care does not necessarily characterize exactly the activities or practices a General
4 45 areas of expertise available in Table 1 - Doctor Specialties2 (D. da República, 2018b), will determine
who are the doctors classified as Specialists.
Doctor Specialties
Anesthesiology Physical Medicine and Rehabilitation
Pathologic anatomy General and Family Medicine
Angiology and Vascular Surgery Intensive Care Medicine
Cardiology Internal medicine
Pediatric Cardiology legal Medicine
Cardiac surgery Nuclear medicine
Cardiothoracic Surgery Tropical Medicine
General surgery Nephrology
Maxillofacial Surgery Neurosurgery
Pediatric surgery Neurology
Reconstructive and Aesthetic Plastic Surgery
Neuroradiology
Thoracic surgery Ophthalmology
Dermato-Venereologia Medical Oncology
Infectious diseases Orthopedics
Endocrinology and Nutrition Otolaryngology
Stomatology Clinical pathology
Gastroenterology Pediatrics
Medical Genetics Pneumology
Gynecology / Obstetrics Psychiatry
Immunoallergology Psychiatry of Childhood and Adolescence
Immunohemotherapy Radiology
Clinical Pharmacology Radioncology
Clinical Hematology Rheumatology
Sports Medicine Public health
Work Medicine Urology
Table 1- Doctor Specialties
2.4. T
HE REFERRALM
ECHANISMB
ETWEENP
RIMARYC
ARED
OCTORS ANDS
PECIALISTSIn a significant number of countries, it is required for a patient to see a Specialist or have access to other medical resources such as laboratory tests require first to have an appointment with a PCP (Liddy, Arbab-Tafti, Moroz, & Keely, 2017). However, in the irregular situation, of an emergency, a patient can ask to be seen by a Specialist if it visits a hospital through the emergency room. But further access to other healthcare resources requires the recommendation of the respective Specialists. In addition, nowadays it is possible to schedule an appointment with a Specialist without having to first see a Primary Care Doctor in the private sector.
2 There are two specialties in this table named Tropical Medicine and Cardiothoracic surgery we are not
in the aforementioned source of the information, because in 2015 they were recognized as a specialty (D. A. República, 2015).
5 The practice of referring patients to Specialists is considered to be a common event in the United States of America (Chen & Glover, 2016). Interestingly, two different studies found similar results regarding the percentage of visits to PCP’s that include a referral to a Specialist events in the United States of America, 5% (Forrest, Nutting, Von Schrader, Rohde, & Starfield, 2006) and 4.5% (Kinchen et al., 2004). Moreover, in the latter case, 45% of new patients a physician receives is assigned to him or her by referrals. In the particular case of Portugal, it registers a referral rate of 5.56% between primary care and secondary care (Ponte et al., 2006).
Inefficient communication within a referral network can have a negative impact for the referral network, as it can result in ineffective care coordination by the healthcare provider (An, O’Malley, Rockmore, et al., 2018). The level of effectiveness of communication between members of a network is affected by how information and resources flow around an healthcare provider referral network (An, O’Malley, & Rockmore, 2018).
In addition, as good patient experience is related with higher hospital profitability (Deloitte, 2019). Thus, healthcare providers are once more affected by the referral system between the two types of doctors.
Furthermore, in this relationship the Primary Care Doctors are not the only ones that refer their patients to see other doctors if they think that is in the best interest of its patients. Specialists physicians also have that possibility.
In terms of the appropriateness, referrals of patients having a condition that has a low degree of severity by Primary Care Doctors to Specialists, is considered by physicians themselves a waste of “expert” consultations, that ends up adding unnecessarily costs, both to the healthcare provider as to the patient(Jauhar, 2019). However, this kind of behaviour is welcomed by doctors. Moreover, is common for doctors to guarantee that the referrals sources remain happy with them specially major cities and in particular metropolitan areas (Jauhar, 2019). A doctor should only make a referral if it is justified. In that case the ideal is for him or her to refer a doctor or doctors to handle the particular situation of a patient, and not because it is in the best interest of the doctor (Schroeder, 2016).
2.5. P
ATTERNS IN THE REFERRALM
ECHANISM BETWEENPCP
ANDS
PECIALISTSIt is in the interest of policy makers and healthcare organizations to understand the patterns behind the referral networks as they attempt to control healthcare costs by manipulating how PCPs or Specialists’ physicians establish their relationships. Another reason is to cultivate the level of awareness regarding the patterns of referral is to maintain the referrals within a specific institution or organization (Barnet, Song, & Landon, 2012).
The existent referral mechanism between a Primary Care Doctor and Specialists is affected by a variety of complex factors as you might see in table 2 - Factors and Reasons for referral between Doctors 3.
These factors can go from the previous experience a patient had with a certain doctor, as the probability of a referral can depend on the gender of the physician or patient.
6
Factors & Reasons for referral between Doctors
Medical skill Anxiety regarding outcomes
Perceived clinical expertise Perceived pressure to control referral costs
Patients past experience with a physician Restricted ability to obtain surgical referrals
Timely availability of a doctor for appointments Hours of patient care per week
Sharing medical records Visits per day
Being referred by another doctor Physician income
Work in the same hospital Physician income structure
Type of doctor (Primary Care Physician or Specialist) Ownership practice
Doctor specialty Level generalization/expertise of a PCP
Patient diagnose Convenience
Disease severity Risk aversion
Future impact of a referral on a patient's health care Race
Getting advice on diagnosis or treatment Adequate patient time visit
Overall shortage of physicians Nurse involvement in the process
Costs of tests and procedures Managed care contracts
Age over 17 Use of HITS
Patient gender Patient Has chronic conditions
Physician gender Specialist refers the same PCP
Fear of lawsuit of not consulting an expert PCP refers the same Specialist
Patient health insurance Years of practice
Anxiety due to clinical uncertainty scale
Table 2 - Factors and Reasons for referral between Doctors
A few papers have studied the referral relationship between PCPs and Specialists, the reasons of their choices and their patterns which can extend beyond professional motives (Barnett et al., 2011). For example, according to the study Trends in Physician Referrals in the United States 1999-2009 the most influencing factors affecting referrals were: clinical report, Physician gender, Years of practice, Specialty, Herfindahl Index4(Barnett, Song, et al., 2012).
When identifying the professional network of each doctor in the overall network, 66% of the referrals of PCPs were made to colleagues inside the network. On the other hand, medical Specialists referred 49% and surgical Specialists referred 52% of colleagues belonging to their respective professional network (Barnett, Keating, Christakis, O’Malley, & Landon, 2012). In the case of Specialists 10% of their referrals were made to Primary Care Physicians. The remaining of the referrals was made to doctors of the same nature (Barnett, Keating, et al., 2012).
Specialists physicians are more likely than PCPs to refer a patient to another doctor depending on the previous experience of his or her patient with the doctor being referred. This can be explained by the fact that they believe to be of less importance if a physician has or does not have a good patient rapport. Conversely PCPs give higher relevance to reasons related to a physician access to one another. For instance: the level of availability of doctor for appointments, the sharing or not of the same medical 4 In this particular case the Herfindahl Index attempts to define the level of expertise of a Primary Care
Physician. A doctor who scores one in this index means that it is a Specialist in a specific area. However, if the result is zero it means that he or she a generalist (has a general knowledge about different areas).
7 record system, or the fact of working in the same hospital. Furthermore, if a patient has an insurance or not, and what type of insurance, are key aspects of the referral process as physicians can be restricted or not to refer patients for further health care (Kinchen et al., 2004).
Another common rules for a Specialist to refer a patient to another doctor depends on the fact of being referred or not by that same doctor (Barnett et al., 2011). The immediately aforementioned article also states that physicians with less capabilities of handling clinical uncertainty were more likely to refer a patient to other doctors. In addition, if the care that a patient requires exceeds the expertise that a Primary Care Physician can give increases the probabilities of referral of a same patient (Franks, Williams, Zwanziger, Mooney, & Sorbero, 2000). In addition, physicians have less encouragement to increase volume of referrals if payments are bundled5 rather than discriminating for every service
(Jauhar, 2019).
Other sources have found out evidence that doctors when referring patients to other colleagues, consider the professionals with who they are familiar with. However , they first consider the ones working at the same hospital (An, O’Malley, & Rockmore, 2018).
It is common for studies to register variations according geographic regions, it is not abnormal when Specialists are found to have a more central role in smaller networks than larger. Despite physicians being assigned to one or more hospitals, the closer proximity of different cluster suggests the existence of multiple ties across different hospitals. In addition, the individual network of a doctor is more likely to have more and stronger ties within the hospital which the professional is affiliated to, despite not always being the verified scenario. Male doctors are more likely to have ties with other male doctors. The same happens with the female gender. Doctors with connections between them reveal a closer proximity in age when compared with unconnected individuals. Furthermore, this study found that not only connected physicians are more likely to be in closer geographical proximity than unconnected doctors as well to have patients with similar medical complexity (An, O’Malley, Rockmore, et al., 2018). Another study supports that doctors professional networks vary across geographic locations (An, O’Malley, Rockmore, et al., 2018). Additionally, it is valid to expect that doctors share patients with colleagues that have personality similarities with them, therefore they demonstrate to have the homophily concept present in their networks. However, the rapid adoption medical electronic records can lead to different findings (B.E. et al., 2012).
A patient diagnostic has a significant amount of explanatory power over the variation of referral rates of PCP as the degree of severity of a patient condition and the possible impact of a referral on the future of his or her health. The availability of Specialist doctors also influences their referral rates. The more Specialists a Primary Care Physician has at his or her disposable for referral the greater are the chances of making one, due to the higher degree of access to specialty care, the patient expectations and demands for seeing a Specialist also increase. Furthermore, patients presenting common pain problems or depression symptoms have lower likelihood of referral. The costs of procedures and surgical interventions (specialist care) represent a constraint towards the referral rates as it is common for policy makers on healthcare organizations implement barriers against inappropriate referrals. Moreover, so far it has not been found an association between the rate of referrals and their quality (Forrest et al., 2006).
In terms of psychological measure they do not reveal to be a determinant aspect in the referral likelihood variability (Franks et al., 2000).On the other hand ethnicity has a stronger explanatory power
8 as communities where the degree of concentration of black residents is high have a lower tendency to get treatment when compared with white individuals from the same population (Ghomrawi, Funk, Parks, Owen-Smith, & Hollingsworth, 2018).Additionally, black physician report to have a perception of racial discrimination by white doctors in the referral process (Kinchen et al., 2004).
Sometimes a certain degree of financial transparency from healthcare providers can be demanded to their employees when seeing patients to build stronger relationships between the two parties. In addition, it is common for countries to have laws that prevent doctors to pay other doctors directly for referrals (Schroeder, 2016). Moreover, the availability to a PCP of healthcare information technology, nurse care manager, adequate visit time and quality reports regarding patients with chronic conditions would be expected to increase the referral rates by from 63.9% to 82.7%. The increased administrative burden Primary Care Physician face along with diminish of reimbursements are creating heat on those doctors to see more patients in less time. Having this kind of structure decreases the effectiveness of the communication in a referral network and the quality of the care provided. Moreover, systematic structures, tools and processes for information creation, sharing, receipt and recognition from both parties the sending and receiving individual are necessary to support medical care practices (O’Malley, Ann S., MD & Reschovsky, 2011). An important consequence to bear in mind when increasing the number of referrals, is that, that implies also an additional increase in the number of ambulatory visits for the average person, either in the primary care services and Specialist care (Barnett, Song, et al., 2012).
It has been registered an increase in the referral rates. The study Trends in Physician Referrals in the United States, 2012 it attempts to disclose the justifications behind that event. The study hypothesizes that it might be due to the increasing complexity of care itself, for instance common diseases with general or viral symptoms did not register such increase. In addition, more than before, physicians are asked to do more while having the same amount of consultation time. Patients of today on average require attention as they need more medication and they have one or more chronic condition (Barnett, Song, et al., 2012). In Portugal the average consultation time per patient is approximately 15.2%, compared with other 67 studies from the International variations in Primary Care Physician consultation time: a systematic review of 67 countries, Portugal the 10th position (Irving et al., 2017).
In addition, a General Practitioner is estimated to see 19.1 patients per day (Granja, Ponte, & Cavadas, 2014).
9
3. METHODOLOGY
The current section represents the process of the development of the dissertation since the data pre-processing until all the tools and analysis made in order to better understand the referral mechanism between general practitioners. Additionally, it is presented the reasoning, assumptions and limitations that arose during the construction of the primary-specialty referral network and other frameworks.
3.1. I
NTRODUCTIONAs previously mentioned, the objective of this study is to better understand the referral mechanism between primary care doctors and specialists using network science, and other tools. To do so a referral network between the two types of doctors is estimated. Moreover, in this network the referral patterns and certain social network metrics such as degree centrality will be explored. Finally, a regression analysis is produced with the aim of understanding if the different types of information available, that mean respect to the background of a doctor, including their centrality measures, if they have any impact in the referral rate associated to each doctor.
The database used for the development of the research study was provided by a European healthcare provider in 2017. The originated from Portugal. The database management software used for the storage of the data was Dbeaver. The Programming Languages used for the cleaning, visualization of the data, networks construction and analysis were python16 and postgresql. The development of the dataset necessary for the progress of this report can be divided into two main stages. The first phase consisted in extracting, cleaning and visualizing all the relevant information regarding a doctors’ profile. The second stage (explained in the chapter “Schema Evolution”) involved adding and validating new information to complement the initial dataset.
3.2. D
ATAP
RE-P
ROCESSINGThis stage represents the selection, integration, description, cleaning, and visualization of final dataset which is used for the development of the respective project. Its main objective is to describe the education background and current places of work.
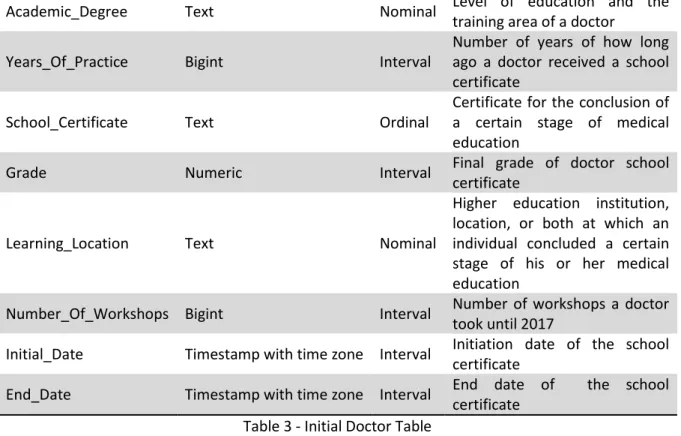
The development of the final dataset departed from a table called initial_doctor_table. This table represents 3500 observations, each corresponding to a unique doctor, being described by 13 variables. From those variable 7 represent text type variables, 3 bigint type tables, 1 numeric type variable and 2 timestamp with time zone variable. In addition, each variable has a role. There is 1 ID variable, 6 variables defined as interval, 4 variables defined as Nominal, 1 variable defined as Binary, and 1 variable declared as Ordinal (see table 3 – Initial_Doctor_table).
Variable Variable Type Role Description
Doctor_id Text ID Unique identifier of a doctor
Birth_year Bigint Interval Birth of the corresponding
doctor
Gender Text Binary Sex of each doctor
Specialty Text Nominal Area of expertise of a doctor
Specialty_2 Text Nominal Second area of expertise of a
10
Academic_Degree Text Nominal Level of education and the
training area of a doctor
Years_Of_Practice Bigint Interval
Number of years of how long ago a doctor received a school certificate
School_Certificate Text Ordinal
Certificate for the conclusion of a certain stage of medical education
Grade Numeric Interval Final grade of doctor school
certificate
Learning_Location Text Nominal
Higher education institution, location, or both at which an individual concluded a certain stage of his or her medical education
Number_Of_Workshops Bigint Interval Number of workshops a doctor took until 2017
Initial_Date Timestamp with time zone Interval Initiation date of the school certificate
End_Date Timestamp with time zone Interval End date of the school certificate
Table 3 - Initial Doctor Table
3.2.1. Missing Values
The first step to treat the initial doctor table, was to handle the existence of missing values in it. A particular problem was identified related with this issue. Some values in some variables were in blank (not null or erroneous values). Those variables were: specialty, specialty_2, Academic_Degree, School_Certificate, and Learning_Location. This is relevant because the meaning of a blank value is assumed to be the same as a null value. Therefore, to correct this situation the blank values were updated to null values. The output of such action produced the following amount of missing values that is possible to observe in table 4 – Initial Doctor Table Missing Values.
Variable Variable Type
Percentage of Null Values doctor_id 0 0,0% birth_year 0 0,0% gender 0 0,0% specialty 2096 59,9% specialty_2 3488 99,7% Academic_Degree 226 6,5% years_of_practice 0 0,0% school_certificate 28 0,8% grade 3136 89,6% learning_location 28 0,8% number_of_workshops 0 0,0% initial_date 28 0,8% end_date 1559 44,5%
11 Considering the amount of null values in some variables, some had to be dropped because they could not add any value or information to the dataset. Therefore, the variables specialty_2 and grade, were dropped due to the fact that they had 99.7% and 89.6% of missing values.
Additionally, the variables initial_date and end_date were removed also due to the significant amount of missing values in the latter case. In addition, Academic_Degree is considered to be redundant because the information that is possible to extract from it, is provided by other variables. The different values that the variable can take can be seen in table 5 – Academic Degree Values. Furthermore, the variable number_of_workshops do not carry relevant information for the development of the dissertation. Therefore, 6 different variables were excluded from the study.
Academic Degree
L. Med. Mestr. Medicina Legal L. Enfermagem
L. Medicina
L. Med. PG Medicina Legal L. Medicina Dentária L. Fisioterapia
L. Med. Dout. Medicina L. Med. PG Saúde Pública
L. Desconhecida / Não especificada Table 5 - Academic Degree Values
3.2.2. Outliers
Concerning the process of identifying outliers, the distribution of the quantitative variables and their respective descriptive measures were assessed, namely: Birth_Year, Years_of_Practice. The distribution of the variable birth_year, presents to have a slightly skewed distribution to the left. The youngest individual in this sample was born in 1994, while the oldest person was born in 1900, making it to have 117 in 2017. Approximately 75% of the population was born before or in 1980 (37 years old in 2017) (figure 1 – Birth Year Distribution). The average age of the sample is set to be 48, which means that the average birth year was 1969. Additionally, every individual claiming to be born before 1935 is considered to be an extreme value. By applying such rule, we are excluding only 2 observations.
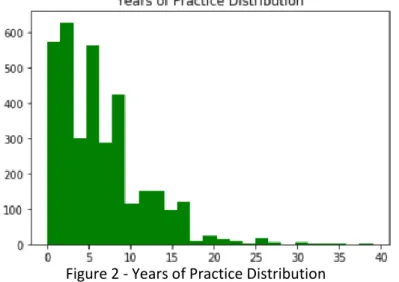
12 The variable years_of_practice presents also a skewed distribution, but in this case is skewed to the right. Meaning the more years of practice, a doctor has the, the fewer are the number of doctors that are able to represent those years of practice. In this sample, on average, doctors finished their studies six years ago. Approximately 75% of the population finished their degrees no more than nine years ago. The range of this variables goes from zero to 39. The value zero can have two different meanings in our sample: It can either mean that a doctor has not finished his or her studies, or it has just finished them in 2017. In terms of outliers, it does not demonstrate to have extreme values (figure 2 – Years of Practice Distribution).
Figure 2 - Years of Practice Distribution
After applying the necessary rules to exclude the outliers from the sample only 1 observation is being removed, which represent 0.06% of the entire dataset. It is possible to observe it more detail in (table 6 – excluded outliers).
Variable Excluded Observations Excluded Observations %
Birth_year 2 0,06%
Total 2 0,06%
Table 6 - Excluded Outliers
3.2.3. Data Validation
To become a doctor is necessary to do at least six years of medical school (university), and a minimum of 5 to 7 years to conclude a medical post-graduation known as Internato Médico, that is divided in 1 or 2 years of Internato Geral and a minimum of 4 years to conclude the Internato Complementar, which can reach a maximum of 6 years depending on the specialty. Therefore, it is plausible to assume that the minimum age at which a doctor initiates its medical career in 2017 is at 29 years old. Before 2004, included, what is known today as Ano Comum of the Internato Médico, was in fact recognized as Internato Geral and it had a duration of two years. In the year of 2004 the Internato Geral started to be recognized as Ano Comum and its duration was modified to 1 year (Diário da República, 2004). However, it is important to know, that after concluding the general training of the Internato, a doctor is recognized as an autonomous individual, becoming able to start giving prescriptions to patients and scheduling appointments (D. da República, 2018a). In addition, since 2012 it is now possible for the private healthcare sector to start training medicine students, in order for them to get their post-graduation certificate. However a private healthcare provider has to be first certified by the institution
13 Ordem dos Médicos (Saúde, 2017). The Healthcare Ministry is the official entity responsible for overseeing the practice of medicine in Portugal, ensuring its quality, security, and ethics (Governo da República Portuguesa, 2017). Additionally, the Administração Central do Sistema de Saúde (ACSS) has established protocols with other entities (Governo da República Portuguesa, 2019) such as Ordem dos Médicos and Conselho Nacional do Médico Interno that helps the Healthcare Ministry to manage the structure and oversee the post-graduation Internato Médico (Ordem Dos Médicos, 2018).
Thus, it should not be appropriate to include individuals that have less than 26 years old in 2017. Because assuming that a person did not make any detour in its academic studies, a doctor has finished its high school degree with 18, finished its college degree with 24 and start its internato with 25 years old. Given that it’s only possible to make referrals after concluding the first year of the internato it is not correct to have individuals in the sample of doctors that have 25 or less in 2017. Furthermore, as previously mentioned the objective of the study is to understand the referral mechanism between general practitioners and specialists, therefore, despite being valid to have individuals with 25 years old, they cannot make referrals, because they are in their first year of internato. They have to have at least initiated their second phase of the Internato Médico in 2017. Only then a person can schedule appointments and make prescriptions. By applying these rules only 1 observation is being excluded. It is important to point out a limitation to the aforementioned rule which is the fact that it is not applicable for cases in which a doctor has more than 26 but it is in fact in its first year of internato. If considered the observations excluded plus the observations being left out, due to inconsistencies issues, the number of records not being considered represents approximately 0.08% of the entire dataset. The values include 2 observation from the exclusion of outliers and 1 observation which do not comply with the consistency rules.
3.3.
P
RIMARY-S
PECIALTYR
EFERRALN
ETWORK3.3.1. Primary-Specialty Network Mapping
The primary-specialty referral network was built under the purpose of mapping existent relationships between doctors that follow under the category of general practitioners, and physicians that practice specialties that belong to the differentiated care category. In order to do such, it was necessary to import 4 distinct variables: the date of each episode It’s unique per visit (represents a doctor appointment with a patient). the unique ids associated with each patient and doctor, regarding each episode, and classification the of each doctor.
The connections estimated to existed in this network, are based on four main assumptions: It cannot be longer than 30 days that between two appointments with different doctors. Only primary care doctors can make referrals. In addition, two distinct doctors have to share a patient. Additionally, in the case of a doctor having one specialty from each category, primary and differentiated care, only the former case was kept. However, if a doctor had two specialties from the same category only the one with the highest represent among the different specialties would remain. Finally, it is not possible to exiting referrals within the same group of doctors.
Initially, the data of the referral network had to be filtered according to the doctors in the final_doctor_table, which contains all the relevant information regarding the doctor’s background. Moreover, the data was restricted to episodes that did not have urgency character, that were not
14 cancelled and in which the date of the episode was available. The final output was a significant large sample with 9 133 477 observations. Afterwards, the dataset was filtered between the years of 2012 and 2017 to ensure a better quality of the data. By doing such, the main dataframe was reduced by 444 observations. Interestingly enough, 137 doctors where identified has not giving a single appointment between those years. Therefore, these doctors will not be taken into account in this research project, leaving us with 2171 doctors in total. However, it would be prudent to verify if such doctors are still active or not. Additionally, in the remaining 9 133 033, it was identified 1 305 361 unique patient ID’s. Furthermore, it was registered 1 913 674 unique doctor appointments on behalf of primary care doctors and 4 112 885 on behalf of specialists. Given that the objective is to study the referrals of primary care doctors to specialists, the sample of specialist should only represent doctors who are associated with patients present in the sample of general practitioners.
Unfortunately, the output of the relationships estimated is not valid, as there are multiple doctors which are associated with more referrals than appointments. This means they were estimated to give more appointments than the ones they actually gave. The next best solution found, was to only allow one referral for each unique primary care doctor appointments. The criteria to choose the link that would be assumed as the estimated relationship would the one with the shortest period. This too represents an important limitation to study. Not only, a general practitioner can refer a patient to more than one doctor of the same or different specialties, as well the link with the shortest period is not necessarily the referral that happened in reality. This resulted the estimation of 59 065 unique relationship between doctors.
The next step towards the exploration of the relationship between the two types of doctors was to build the actual network which was done using a library in python called Networkx. Given that it is only possible to have connections between doctors of distinct groups, the network was defined as a bipartite network (figure 3 – Bipartite Network).
Modelling a social network as a Unipartite network (figure 4 – Unipartite Network) would make it harder to understand the dynamics between the two types of doctors as the analysis and calculations of social network metrics are done are not specific to each type of doctor or do not have in consideration that condition.
15 Defining a complex network as two-mode imposes some restrictions and limitation both in the creation and analysis processes. Bipartite networks do not allow to have links within each of the groups in the network, only connections between doctors of different groups are permitted.
Furthermore, the primary-specialty network was computed as a weighted network. In the particular case of this dissertation the weight assigned to an estimated link represents the number of patients each two doctors are expected to share. The nodes with whom there were no connections identified were included in the network grid as isolated nodes. Additionally, this network can be classified as socio-centered, implicit and undirected. To conclude this primary-specialty network does not necessarily corresponds to the formal structure of the private healthcare organization.
3.3.2. Bipartite Random Network
A Bipartite Random network was necessary to build in order to compare the different characteristics of a random network against the macro and micro-level metrics found in the primary-specialty network. It was generated has a Bipartite random graph, where the size of the nodes is the same has the ones in the primary-specialty network. In addition, when creating a network of this nature it is necessary to assign a specific value to a specific parameter called p, which represents the probability of an edge between two nodes being computed. In the equation represented below, μ embodies the weighted average degree of the primary-specialty referral network while symbolizes the number of nodes inserted in the network.
𝑝 =
𝑢
(𝑛 − 1)
3.3.3. Centrality Measures and Others
3.3.3.1. Degree Centrality
The degree centrality measure in a bipartite network of a doctor is represented by the number of direct ties he or she has, divided by the total possibilities of the opposite partition.
16
# 𝐷𝑖𝑟𝑒𝑐𝑡 𝑇𝑖𝑒𝑠
# 𝑃𝑜𝑠𝑠𝑖𝑏𝑙𝑒 𝑇𝑖𝑒𝑠 𝐹𝑟𝑜𝑚 𝑂𝑝𝑝𝑜𝑠𝑖𝑡𝑒 𝑃𝑎𝑡𝑖𝑡𝑖𝑜𝑛
On the other hand, if the structure of the network was unipartite, the numerator would remain the same, but in this case the denominator always embodies the same value, which is the total number of nodes in the network.
# 𝐷𝑖𝑟𝑒𝑐𝑡 𝑇𝑖𝑒𝑠
# 𝑃𝑜𝑠𝑠𝑖𝑏𝑙𝑒 𝑇𝑖𝑒𝑠
3.3.3.2. Betweenness Centrality
Betweenness centrality is calculated similarly in both types of networks, bipartite and unipartite. For each node it is the number of occurrences on the shortest paths of each pair of nodes in the network. The main difference when computed in a two-mode network is that this metric is still normalized by the maximum possible betweenness centrality6 values that can be found for each node partition in a bipartite network. The equation for the calculation of such values can be seen in Appendix 9.3 Betweenness Centrality Normalization.
CB
(v) = Σs, t ϵ v(
σ(s, t | v)
σ(s, t)
)
3.3.3.3. Closeness Centrality
The last centrality measure calculated in this study was the metric Closeness7. The purpose of such metric is to measure the distance of each node to the remaining ones in this network. In addition, given that this metric is being applied in a bipartite network it is normalized by the minimum distance possible, which in the case of a general physician to a specialist is 1 and in the case of doctors within the same partition is 2.
𝐶𝑣 =
𝑚 + 2(𝑛 − 1)
𝑑
, 𝑓𝑜𝑟 𝑣 ∈ 𝑈,
𝐶𝑣 =
𝑛 + 2(𝑚 − 1)
𝑑
, 𝑓𝑜𝑟 𝑣 ∈ 𝑉
3.3.3.4. Global Clustering Coefficient
The global clustering coefficient is a measure that has the purpose of measuring the probability of individuals to cluster together. In a unipartite network, what this metric does is to find all closed triangles in a network (Appendix 7.2 – Closed Triangle) over all triangles that are possible to be formed in a certain network.
However, this is situation is not possible to be observed in a bipartite network as it is not possible to exist closed triangle (Appendix 7.3 – Bipartite Cycles). The alternative solution suggested is to find the
17 total number of existing squares in the network over all possible squares that could exist in the network given its number of nodes per partition.
𝐶4, 𝑚𝑛(𝑖) =
𝑞𝑖𝑚𝑛(𝑘𝑚−𝜂𝑖𝑚𝑛)+(𝑘𝑛−𝜂𝑖𝑚𝑛)+𝑞𝑖𝑚𝑛
3.3.3.5. Community Detection
The algorithm used to detect possible existent communities in the network was the Louvain algorithm which is an optimization modularity-based algorithm. Communities in social network are no more than groups of nodes that are more densely connected when compared with other community. The Louvain algorithm measures the density between nodes through a metric called modularity. The algorithm starts by defining small communities through the optimization of the aforementioned metric, locally on every node in the sample. Then the communities found are assembled into a single node respectively. The process repeats itself until the optimal number of communities is found, according the algorithm. Applying this algorithm represents a limitation on the current study as the algorithm is not the most appropriate for community detection in bipartite networks.
3.4. P
RIMARY-S
PECIALTYR
EGRESSIONA
NALYSISTwo distinct regression analysis, representing both types of doctors were performed with the objective of testing the hypothesis that the variables available from the doctor’s background and the centrality measures computed from the primary-specialty referral network had any statistical significance in the referral rate that each doctor makes or receives, depending on its specialty. Therefore, the dependent variable (referral rate) is defined as being the number of referrals a doctor has made or received, divided by the number of doctor appointments he or she actually gave between 2012 and 2017. The isolated doctors present were included, with the dependent variable, and centrality measures equal to 0. The initial data can be observed in table 7 – Regression analysis variables. The model used was a multiple linear regression model.
18
4. RESULTS AND DISCUSSION
The current section has the purpose of critically analyzing the empirical results found. Throughout the current chapter the aforementioned primary-specialty referral network, and regression analysis are used to better understand the existing dynamics between primary care physicans and specialists, and possibly how the relationship between the two of them might be affecting the healthcare provider. Firstly, the primary-specialty referral network is analyzed with the objective of identifying potential referral patterns in the overall network, and then in the communities identified within the network. Finally, the objective of performing a regression analysis was to check if variables like the age, social network centrality measures and other are affecting the number of referrals being made and received by doctors.
4.1. P
RIMARY-S
PECIALTYN
ETWORKA large-scale patient doctor appointments records was obtained from a private European healthcare provider between the years of 2012 and 2017, with 9,173,891 entries, 1.3 million unique patients, 2,171 unique doctors associated to 7 distinct hospitals.
As previously mentioned, a referral between two doctors is estimated to happen when a certain patient goes to see a family doctor and then no later than 30 days he or she meets a specialist for an appointment. The application of this methodology resulted in a weighted, undirected, explicit bipartite network in which 459 general physicians 1,487 specialists are connected. In total 1946 share at least a connection with another doctor. In addition, those doctors are linked by no more than 457,495 links which were converted into 59,065 unique edges.
The actual number of referrals made between each two doctors is measured through the weight associated to that same relationship, as that value represents the number of patients they share. In addition, given that only 1,946 of the 2,171 doctors are estimated to be connected this implies that 225 doctors, approximately 11% of the sample of physicians is expected to be isolated. In these 225 doctors that are estimated as not sharing connections, 14 of them belong to primary care and 211 to differentiated care. Moreover, 89 doctors, 16 general practitioners, and 73 specialists are peripheral nodes in this primary-specialty referral network. This means that they only share a link with one doctor in the entire network. However, despite not being possible to ensure that this is actually the case, it still raises the possibility that those resources are not being optimized.
In addition, it was necessary to prove that the primary-specialty network does not exhibit characteristics of randomness, meaning that it does not have a similar structure of a random network. For that, it was tested if the weighted degree distribution of both groups of doctors followed or not a Poisson distribution. The results of both analyses returned a p-value of 0, allowing us to reject the hypothesis that both samples followed a Poisson distribution. Additionally, the average clustering coefficient was computed on both networks, on the Bipartite random network and on the primary-specialty. The average clustering coefficient computed on the doctor’s network (0.0206364) revealed to be approximately 21 times higher than the one computed on the Bipartite random network (0.0009752).
Furthermore, the human resources department of the healthcare provider was able to provide several important information’s regarding doctor’s background. It was possible to obtain their age, their level
19 of medical expertise (number of years of practice), the specialty or specialties in which they are certified, their education, and the institution at which they did their post-graduation also known as “internato médico”.
4.1.1. Primary-Specialty Referral Patterns
Gender
In terms of gender distribution, the doctors belonging to the specialist group are more or less evenly distributed with a ratio of 44% compared to 56% male physicians. The scenario changes when considering the primary care doctors as approximately 69% are female and only 31% are male (Appendix 7.4 – Gender Distribution per Doctor Classification).
The distribution of the referrals per gender shows a preference for the male gender as 60% of the total of referrals was received by male specialists. From the total amount of referrals, the female gender has referred its own 26% of the times. But when referring the opposite gender this one represented 38% of the total referrals. In the scenario where the male gender is the one making referrals, women are referred 14% the times. The remaining 22% of the total referrals are made between men.
In what concerns the 225 isolated nodes, on the general practitioner’s side, the female-male ratio does not change, as it is 71%-29% respectively. Finally, the isolated specialists have a female-male ratio of 42%-58% respectively (Appendix 7.5 – Isolated Gender Distribution per Doctor Classification).
Specialty
From the sample of doctors under analysis 44 distinct specialties are identified. As it turns out all of them are referred at least one time. Meaning they are all represented in the primary-specialty referral network. In the particular group of doctors representing the primary care, the specialty Medicina Geral e Familiar is the most active one (48%), while Medicina Interna (28%) and Pediatria (24%) are responsible for approximately the same number of referrals (Appendix 7.6 - Primary Care Referrals Distribution).
According to the Portuguese national healthcare service the most common diseases that are currently affecting the Portuguese population are: Skin related diseases, depression, obesity related, and diseases such as low back and neck pain (Retrato da Saúde 2018, 2018). It is interesting to observe that most of the conditions aforementioned can be treated by at least one of the specialties in the of the most referred specialties (f Appendix 7.7 – Differentiated Care Referrals Distribution). For example, the conditions of neck and low back can be treated by resorting to the specialties Ortopedia and Radiologia. Skin related conditions can be treated by the specialty Dermato-Venorologia. Morever, in terms of hearing and visual capabilities according to the portuguese national program “Para a Saúde da Visão ”, half of population in Portugal does not see properly (Público, 2005). Additionaly, according to a study called “Coping with noise ”, Portugal is the second country with worst hearing capabilities (Amplifon, 2017). These two conditions can be treated by the specialties Oftamologia and Otorrinolaringologia. Furthermore, the number of births in private healthcare as duplicated from 2000 to 2017, which is interesting given that it the fourthest most referred specialty, Ginecologia/Obstetrícia.
20 In what concerns the isolated nodes the distribution of the specialties is interesting to see how the picture inverts (Appendix 7.8 – Isolated Primary Care Specialties Distribution). The specialty with the highest representation in the group of isolated general practitioners, Pediatria, is the one with the lowest number of referrals. Additionally, the specialty with the highest number of referrals made, has the lowest representation in this group of isolated doctors.
The specialties represented in the group of doctors belonging to differentiated care (Appendix 7.9 – Isolated Differentiated Care Specialties Distribution), are all of them represent in the class “Top Specialties” of Appendix 7.7 – Differentiated Care Referrals Distribution, with exception of the specialties “Angiologia e Cirurgia Vascular”, “Cirurgia Plástica Reconstrutiva e Estética”, and “Neurocirurgia”. Once more, this raises the question if the healthcare provider is being efficient in its decision making, it might not need that many professionals representing those specialties. However, it is not possible to ensure that this is the case in reality, therefore further analyses are required.
Hospital
The distribution of doctors amongst the different hospitals can produce valuable insights as it is important to understand if the referrals between the two groups of professionals are being kept inside each healthcare institutions not. In the primary-specialty referral network approximately 76% of the referrals estimated only have one hospital in common. Therefore, it is plausible to assume that the vast majority of the referrals is kept inside each of the healthcare institutions. However, it is only possible to ensure that 37% of the distinct belong to the same hospital. Additionally, the data shows that in approximately 19% of the mapped relationships, physicians did not have hospitals in common (Appendix 7.10 - Number of Hospital In Common).
Age
In terms of age difference, it is possible to conclude that close to 80% of the referrals found amongst the two type share an age difference inferior or equal to 20. Additionally, more than 40% of them do not have more than 10 years of difference. This might suggest a certain level of homophily. From Appendix 7.11 – Age Difference Distribution ECDF it appears that higher the age difference the less likely is that a specialist will be referred.
Perceived Clinical Expertise
By observing the distribution of the specialists being referred in Appendix 7.12 – Specialists Perceived Clinical Expertise, the number of specialists in with more than 20 years of medical practice are practically none, in fact they represent less than 10% of the doctor’s being referred. In addition, nearly 80% of them does not have more that 15-years practicing medicine. Given that more or less 85% of the entire sample of doctors does not have more than 15-years practising their profession it is hard to state a pattern in terms of referring specialists due to their level of perceived experience.
In addition, it was not associated any justification that would further help comprehend the situation of the isolated nodes in the sample (Appendix 7.13 – Isolated Age & Perceived Clinical Expertise ECDF). However, there are two individuals that distiante themselves from the overall sample of isolated doctors in terms of age, and one in terms of years of practice, which might be a contributive factor for being left out from the primary-specialty referral network.
21
4.1.2. Primary-Specialty Centrality Measures
Three distinct social network centrality measures were computed after instantiating the primary-specialty referral network. Those measures were: Degree centrality, Betweenness Centrality and Closeness Centrality. In terms of the centrality measure degree (f Appendix 7.14 – Degree Centrality Distribution), it is possible to observe that both samples have a skewed distribution to the right. Furthermore, as the number of referrals increases the number of primary care doctors representing them decreases. A similar situation happens in the specialist distribution. However, the situation is not so much intense, meaning this distribution has a smaller tail. In addition, it was tested the possibility that the weighted degree distribution of both groups could be represented by power-law distribution (null-hypothesis). In the case of general practitioners this would mean that in a certain distribution only a few nodes are responsible for a large proportion of the referrals being made. For specialist doctors it would mean that only a few doctors are receiving a significant percentage of the referrals being made. It was only possible to prove that the primary care physicians group follows a power-law distribution, as the null-hypothesis cannot be rejected, given its p-value of 0.23.
Furthermore, in terms of the betweenness (Appendix 7.15 – Betweenness Centrality Distribution) there is a significant number of individuals on both distributions with values of zero, which means that they aren’t on the shortest path of any pair doctors. In addition, the values registered in this metric are extremely low. In fact, the highest values detected in the specialists and general practitioners are 0.007 and 0.035 respectively. It is also, interesting to notice that in general, family doctors have higher values in this metric when compared to specialist. For example, whereas 63% of the general practitioners have values superior to 0.0001, specialists only have 36% of their doctors represented. 36
In what concerns the metric closeness the distribution of both type of doctors is significantly different from the other centrality measures (Appendix 7.16 – Closeness Centrality Distribution8). The only doctors with closeness values equal to zero are the isolated nodes. The higher the values of closeness the more central nodes are in the network. It is interesting to see how the picture has inverted when comparing with the metric degree and betweenness centrality. According to the distributions of the metric closeness, specialists have a more central role in the network, meaning that in general they have more access to the rest of the doctors in the network. This might be happening, because only a few primary care doctors are responsible for most of the referrals being made, and thus, those doctors might be referring the same specialists, to some extension.
It has also been quantified the number of referrals made and received by the individuals that represents top and bottom 25% highest values for all the three centrality metrics (degree, betweenness, and closeness), regarding the two type of doctors. In case of the metric degree, the top 25% individuals are held responsible for 78.9% of the referrals, while the bottom 25% made only 0.33% of the referrals. The scenario, similar for the specialist doctors as the 25% individuals for having more direct ties received 77.8% of the referrals, while the bottom 25% received only 0.08% of the referrals. Moreover, the situation does not change for the remaining centrality measures. Betweenness centrality shows a 25% top-bottom ratio for primary care doctors of 77.8% - 0.34% and a top-bottom ratio for specialists of 73.3% - 0.1%. The metric closeness reveals a top-bottom 25% ratio for general practitioners of 79.2% - 1.4% and a top-bottom 25% ratio of 68.6% - 2.62%. Once again, the issue that