Article
Network motif identification and structure detection with exponential
random graph models
Munni Begum1, Jay Bagga1, Ann Blakey1, Sudipta Saha2
1
Ball State University, Muncie, IN 47306, USA 2
University of South Carolina, Columbia, SC, USA E-mail: [email protected]
Received 22 August 2014; Accepted 25 September 2014; Published online 1 December 2014
Abstract
Local regulatory motifs are identified in the transcription regulatory network of the most studied model organism Escherichia coli (E. coli) through graphical models. Network motifs are small structures in a network that appear more frequently than expected by chance alone. We apply social network methodologies such as models, also known as Exponential Random Graph Models (ERGMs), to identify statistically significant network motifs. In particular, we generate directed graphical models that can be applied to study interaction networks in a broad range of databases. The Markov Chain Monte Carlo (MCMC) computational algorithms are implemented to obtain the estimates of model parameters to the corresponding network statistics. A variety of ERGMs are fitted to identify statistically significant network motifs in transcription regulatory networks of E. coli. A total of nine ERGMs are fitted to study the transcription factor - transcription factor interactions and eleven ERGMs are fitted for the transcription factor-operon interactions. For both of these interaction networks, arc (a directed edge in a directed network) and k-istar (or incoming star structures), for values of k between 2 and 10, are found to be statistically significant local structures or network motifs. The goodness of fit statistics are provided to determine the quality of these models.
Keywords biological networks; network motifs; transcriptional regulatory network; graphical models;
exponential random graph models; Markov Chain Monte Carlo algorithms.
1 Introduction
Biological functions depend on complex interactions among the cell’s numerous constituents such as protein, DNA, RNA and other small molecules. Thus, for biologists it is important to assess interactions among molecules at different levels of hierarchy. In particular, there is a high degree of interest in identifying interactions at the gene-gene, gene-protein, and metabolic levels. High-throughput assays that probe cells and sub-cellular systems at the genome scale can measure molecular interaction networks and their components at
Network Biology ISSN 22208879
URL: http://www.iaees.org/publications/journals/nb/onlineversion.asp
RSS: http://www.iaees.org/publications/journals/nb/rss.xml
Email: [email protected]
EditorinChief: WenJun Zhang
Network Biology, 2014, 4(4): 155-169
IAEES www.iaees.org each of these key levels. These may include specific gene sequences, mRNA transcription products, protein-protein interactions, protein-DNA interactions, as well as other interactions of interest (Friedman, 2004). With the advancement of high-throughput data collection techniques such as microarrays and next generation sequencing, it is now possible to investigate the status of the interactions of a particular cell’s components. Thus scientists can assess complex molecular interactions by implementing proper computational methodologies.
Molecular interactions that are of the most interest include transcription regulatory networks, protein-protein interaction, and metabolic interaction. Although one can study each of these interactions separately, none of these networks functions independently but instead they form a series of interdependent networks (Barabasi and Oltvai, 2004). This large complex global system of cellular networks thus determines the major characteristics of a cell and the functions of its sub-cellular regions. In order to better understand local features of a complex global network one needs to study each interaction network separately. For example, Costanzo et al. (2010) examined the Saccharomyces cerevisiae cellular networks by connecting pairs of genes with similar profiles using Pearson correlation coefficients to form global interaction networks. Biological networks are characterized as functions of local network features (Saul and Filkov, 2007) using a family of statistical models from the social network methodologies, such as Exponential Random Graph Models (ERGMs). The ERGMs provide a flexible principle to study global network structure as a function of prominent ‘local features’.
Gene expression is a fundamental process to the survival of an organism, both prokaryotic and eukaryotic, as well as the propagation of the various classes of viruses. An overview of the transcription regulatory networks of E. coli from basic biology to our current understanding on a global scale has been previously well-described by Martínez-Antonio (2011). In particular, core processes of the central dogma of biology involve DNA transcription, multi-subunit enzymes, several classes of RNA, and specialized proteins known as transcription factors, or TFs. Together these elements produce what is known as the transcriptome of the cell. Overall, the steps appear to be simple: induction of transcription or release from repression of transcription, initiation of transcription, elongation or synthesis of the RNA species, and termination of the RNA species. But in reality, each step involves levels of complexity that we are just beginning to understand. Some genes within the genome may require only one to two TFs to activate the transcriptional process at a promoter site, while others can require ten or more TFs for overall regulation and attenuation, as seen in the RegulonDB database (RegulonDB Release 7.4, 2012) (RegulonDB, 2012).Production of each of these polypedtides that function as a TF is, in itself, a highly regulated process. Thus, determination of the key points of regulation within the smaller networks that give rise to the major cascades of metabolic activities within the cell will prove to be invaluable to our understanding of the system as a whole.
The examination of transcription regulating network motifs has been attempted with various algorithms since the late 1990s. These analyses have attempted to examine gene expression from the perspective of circuitry (Thieffry et al., 1998), and smaller network motifs within a global network (Shen-Orr et al., 2002). Biological context of the data allows for refinement of the analysis of the inter-relationship of specific features within smaller local network features. These features will have both hierarchical and evolutionary implications when evaluated for their regulatory roles with a biological system (Balaji et al., 2007) and (Martnez-Antonio, 2011). Therefore, utilizing the most updated version of the RegulonDB as of the time of analysis (currently v7.5, soon to be v8.0) (RegulonDB, 2012) has allowed for access to the most detailed information assembled on the E. coli transcriptional regulatory network (Gama-Castro et al., 2011). While it remains important to consider the globality of the regulatory networks, closer examination of the unique features of the smaller motifs has provided an insight towards mechanisms of control both in vivo and in vitro.
2 Materials and Methods 2.1 Data
We consider the E. coli K-12 transcriptional regulatory network interactions using RegulonDB (RegulonDB, 2012). This database contains information about the organization of operons, genes organized into a single transcriptional unit, and the composition of operons into transcriptional units among numerous other information units within a transcriptional network. In RegulonDB database, an operon is defined as “a set of one or several genes and their associated regulatory elements, which are transcribed as a single unit”. However,
an additional criterion is that one particular gene cannot belong to more than one operon (RegulonDB, 2012). A transcription unit is thus defined as a set of one or more genes within an operon transcribed as a set through the utilization of a single promoter. The database also provides terminology regarding transcriptional units
known as a regulon. A regulon in its simplest form involves the regulation of a group of genes regulated by a single regulator, hereafter referred to as a transcription factor but is known to exit in a complex form involving two or more regulating transcription factors or regulators. It is the information provided by each of the simple regulons, complex regulons, and strict complex regulons that differentiates and identifies the unique local features of those networks.
Saul and Filkov (2007) implemented ERGMs to a number of biological networks including the transcription regulatory network of Escherichia coli (E. coli) (Shen-Orr et al., 2002). The transcription regulatory network of E. coli is updated regularly in the repository RegulonDB. We selected this particular network and studied the structure of the interactions closely due to several reasons. First, all regulatory networks are the most important biological network due to their role in gene expression. In the previous works
on this network, direction of the regulation was not addressed properly. We considered two types of regulatory networks in E.coli: 1) regulation between transcription factors namely transcription factor - transcription factor (TF-TF) interactions, and 2) regulation between transcription factors and the operons that contain TFs. The second network is referred to as the transcription factor - operon (TF-Operon) interaction network. In both
cases, we generated directed exponential random graph models and identified prominent local features. Our results are comparable with those obtained by Saul and Filkov (2007) with the additional advantage that our approach also addresses the regulatory interactions and places them within their proper biological context.
The networks for the TF-TF interactions and TF-Operon interactions we observed are presented in Fig. 1. The network on the left panel (Fig. 1(a)) is for the TF-TF interactions and the network on the right panel (Fig.
1(b)) is for the TF-Operon interactions. We implement ERGMs to both types of interaction networks in order to identify statistically significant network motifs that can be used to represent these observed networks and compare the sets in terms of similarity and uniqueness. In the method section below, we briefly discuss the
ERGMs and associated computational algorithms.
2.2 Method
Biological networks have been investigated using several network models such as the Erdos-Renyi model (Erdos and Renyi, 1960), the geometric random network model, exponential random graph models (ERGM), and graphical models (Begum et al., 2012; Zhang, 2011, 2012). In particular, the Erdos-Renyi and the
geometric random network models were used in the study of graphlets in Saccharomyces cerevisiae
protein-protein interaction (PPI) networks (Przulj et al., 2004), and exponential random graph models have
been employed to study biological databases such as RegulonDB (RegulonDB, 2012). The ERGMs have also been used to study large social networks (Goodreau, 2007; Robins et al., 2007). In order to study two specific transcription regulatory networks of E. coli we generate a directed ERGM and identify the statistically significant network statistics as prominent ‘local features’.
Network Biology, 2014, 4(4): 155-169
IAEES www.iaees.org
actors in a complex network. This methodology originated and had been implemented widely in the literature of social networks. ERGMs generalize the Markov random graph models (Frank and Strauss, 1986), and edge
and dyadic independence models. Briefly we discuss the ERGM, also known as the model and the associated computational algorithms in the following subsections.
2.2.1 The p model
The model is a more general model that includes the Markov random graph models and the dyadic independence models also known as model as special cases. In order to specify a model we follow the notations of Wasserman and Pattison (Wasserman and Pattison, 1996). Let denote an adjacent matrix where
a tie from is forced to be present. That is , with . denotes an adjacency matrix
where a tie from is forced to be absent. That is , . And finally, denotes an
adjacency matrix with complement relation for the tie from . That is , , , .
The general log-linear form of model is expressed as
exp ′
here is a vector of model parameters, is a vector of network statistics, and . is a normalizing constant which is hard to compute for moderate to large networks. In order to ease the estimation process of the model parameters, the log-linear model form of the model can be re-expressed as a logit model. A logit
model is a special case of generalized linear model where log odds of a binary variable is expressed as linear combination of several explanatory variables. The model in (1) can be converted to a logistic regression
model by considering the set of binary random variables ,where implying a tie from
to (Strauss and Ikeda, 1990). With the new notations, the log-linear model in (1) can be expressed as a logit model as in (4).
Using expression in (1) and taking the ratio of (2) and (3) one can write
exp ′
log || ′
′
Here is the vector of difference statistics obtained from the network statistics . when the variable changes from 1 to 0. The model in (4) is referred to as the logit model for single binary relation (Wasserman and Pattison, 1996). One can work with either the log-linear form of model given in (1) or the
logit form given in (4). However for a sparse or complete network with lack of interactions and strong interactions respectively, model in (1) is preferable.
2.2.2 Computational algorithms
As observed by Snijders et al. (2006) and Goodreau (2007), models with dyadic independence are good candidates for logit form of models and should employ the method of Maximum Pseudo Likelihood
Estimation (MPLE) for parameter estimation. Whereas the models with dyadic dependence should be expressed as log-linear form as in equation (1). These more general ERGM models do not have closed form
expression as the normalizing constant involves sums or integration over a large number of variables (nodes). Thus it is impossible to apply the method of maximum likelihood estimation (MLE) for estimating the
parameters of these models. However, the Monte Carlo approximation of the MLE is often used for such models as in Geyer (1991), Geyer and Thompson (1992), and Saul and Filkov (2007). The Monte Carlo approximation of the MLE using Markov chains is known as the Markov chain Monte Carlo MLE
(MCMC-MLE). We adopt the notations of Geyer (Geyer, 1991) in order to describe the basics of the MCMC-MLE and MPLE.
We write the ERGM model in equation (1) with respect to a generic probability measure (discrete or continuous) as follows:
where exp ′ and . The integral in (5) is analytically intractable. The
Markov chain Monte Carlo proceeds as providing a sample , , … from any in the parameter space which can be used to estimate the log-likelihood ratio for an observation x (Geyer, 1991). Here the log-likelihood ratio is written as
log log
Note that, because the ratio of normalizing constant can be expressed as
,
the log-likelihood ratio in expression (6) can be approximated by replacing the ratio of normalizing constant
by its Monte Carlo estimate
∑ .
Finally an MCMC-MLE of is obtained by maximizing the approximate likelihood. The MCMC-ML estimation algorithm is implemented to the software package statnet under the statistical computational environment R. We use these two packages statnet and ergm to fit the exponential random model given in (1). The MPLE method proceeds as maximizing the pseudo-likelihood which is the product of | in
equation (2) for all the nodes , , . The MPLE of is obtained by maximizing the log
pseudo-likelihood (Besag, 1975). Thus for the logit model derived from (2) and (3) and given in (4), finding the MPLE of is equivalent to fitting a logistic regression model and hence obtaining the parameter
estimates. One can use the software packages statnet and ergm to obtain MPLE. As discussed earlier if dyadic independence assumption is not valid MPLE may produce poor estimates and the method of MCMC-MLE should be implemented instead.
3 Results
The transcription regulation in E. coli is studied with two specific interaction networks, namely the TF-TF interaction and the TF-Operon interaction. The observed networks for TF-TF interaction and TF-Operon interaction are presented in Fig. 1. There are 175 vertices and 387 edges in the TF-TF interaction network (Fig.
1(a)). There are 898 vertices and 1702 edges in the observed TF-Operon interaction network (Fig. 1(b)). Both of these are directed networks with loops. However, self looping is excluded from these networks as the
IAEES
edge betw regulates
and/or T see that
there is o networks
Fig. 1 Ob
denoting in
3.1 TF-T
We fit ni
network where a
exist for as k-istar
Models 1 multiple k-values) results fr contains models 7 1(b). Th network.
The e errors are interest. A
change in
ween two ver s the second T
Fs represents there are two
one big cluste s as discussed
bserved TF-TF nteractions. b) T
TF interactio
ine exponent
statistics for
k-star is defi
, … , . F
r and k-ostar
1-4 include in
network sta ), and ostar w rom the mode
all the netwo 7-9. Rest of t
e k-values o
estimates of e presented in
An estimate o
n the number
rtices is term TF. Each vert
s regulation o o big cluster
er and fewer s d in the follow
and TF-Operon TF-Operon inte
ons
tial random g
r the TF-TF fined to be a
For a directed
r in order to e ndividual net
atistics. A va with various
els for which ork statistics the network s
f istar and o
the paramete n Tables 1(a) of the coeffic
r of ties which
Network
ed as an arc. tex in Fig. 1(
of an operon rs and severa
smaller cluste wing subsecti
n interaction ne eraction with 89
graph models
interaction n node N and d network, as emphasize th twork statisti
ariety of othe
k-values are convergence for models statistics (5-is ostar statistic
ers ( -scalar and 1(b). For cient of arc st h is just -4.74
Biology, 2014,
An edge from (b) represents
by another o al small clust
ers. We deriv ions.
etworks in E. c 98 Operons and
s (ERGMs) (
network mod a set of k di s in the regula he direction as ics, such as a
er models w e also fitted f
criteria are m 1-6 but part
star, 9-istar, a
cs are selecte
for models 1 r example, m tatistic -4.74
4. Thus the co
4(4): 155-169
m one TF to s an operon o
operon or TF. ers whereas
ve statistically
coli. a) TF-TF i d 1702 edges de
(Models 1-9
del. The netw fferent nodes
arity network s incoming k
arc and 2-ista
with network for the TF-T
met are presen of the netwo
and 10-istar) ed based on
1-4, and vect model 1 consid
implies that t
orresponding
another TF r or TF and an
. In the TF-T in TF-Opero
y significant n
interaction with enoting interact
in Tables 1(a
work statistic s , … , s
k of E. coli, k-k-star and out
ar, 3-istar, 4-i
statistics tria
TF interaction
nted in Tables ork statistics
) of models 7
the actual c
tor for model ders only arc the log-odds
probability o
w
represents tha
arc between TF interaction on interaction
network stati
h 175 TFs and ions.
a) and 1(b))
s include arc
such that the
-star statistics tgoing k-star
istar. Models
angle, istar
n network of
s 1(a) and 1(b (arc, 2-istar,.
7-9 are presen
counts from t
ls 5-9) and th as the netwo of a regulatio
of a TF regul
www.iaees.org
at the first TF two operons
n network we n we see that
stics for both
387 edges
with varying
c and k-star, e ties ,
s are denoted respectively. s 5-9 include
(with higher f E. coli. The b). Table 1(a)
...4-istar) for nted in Table
the observed
heir standard rk statistic of on is -4.74
TF when there is an arc in the network can be estimated as 0.0087. These probabilities for TF-TF and TF-Operon interaction models in the presence of individual network statistics only are presented in Table 3.
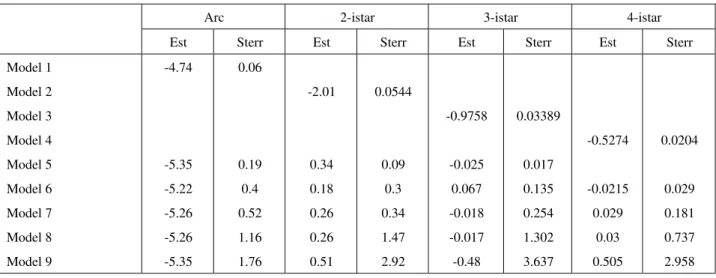
Models 5-9 include multiple network statistics in order to facilitate conditional impact of one statistic, holding the effects of the rest fixed in the model. For example, model 5 considers three network statistics, arc, 2-istar
and 3-istar. Then the conditional log-odds of a regulation between two transcription factors is . change in the number of ties + 0.34 change in the number of 2-istars + (-.025) change in the number of
3-istar.
Table 1a Estimates and standard errors of ERGM parameters for TF-TF interactions: models 1-6 and parts of models 7-9
Arc 2-istar 3-istar 4-istar
Est Sterr Est Sterr Est Sterr Est Sterr
Model 1
Model 2
Model 3
Model 4
Model 5
Model 6
Model 7
Model 8
Model 9
-4.74
-5.35
-5.22
-5.26
-5.26
-5.35
0.06
0.19
0.4
0.52
1.16
1.76
-2.01
0.34
0.18
0.26
0.26
0.51
0.0544
0.09
0.3
0.34
1.47
2.92
-0.9758
-0.025
0.067
-0.018
-0.017
-0.48
0.03389
0.017
0.135
0.254
1.302
3.637
-0.5274
-0.0215
0.029
0.03
0.505
0.0204
0.029
0.181
0.737
2.958
Table 1b Estimates and standard errors of ERGM parameters for TF-TF interactions: rest of the network
statistics of models 7-9.
5-istar 9-istar 10-istar
Est Sterr Est Sterr Est Sterr
Model 7
Model 8
Model 9
-0.014
-0.015
-0.25
0.057
0.211
1.255
0.0004
0.38
0.022
1.517 -0.69 2.665
In the absence of 2-istar and 3-istarthelog-odds of regulation is -5.35, in the presence of a 2-istar but no
3-istar the log-odds of regulation is -5.01, and in the presence of two 2-istar and two 3-istar, the log-odds is -4.72 and so on. The corresponding probabilities for regulation with multiple network statistics are calculated in Table 4 for both TF-TF and TF-Operon interaction networks.
3.2 TF- Operon interaction
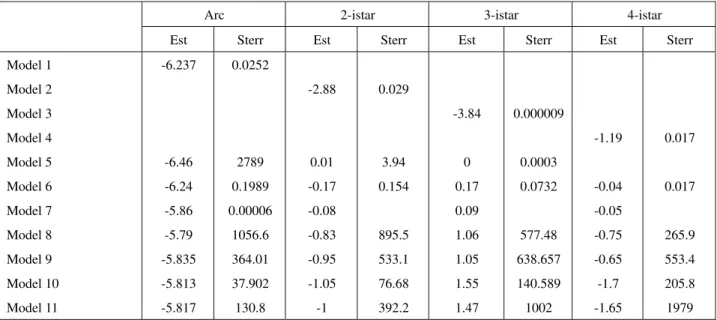
We fit eleven ERGMs (Models 1-11 in Tables 2(a) and 2(b)) with varying network statistics to TF-Operon
interaction network of E. coli. As in TF-TF interaction network we include arc and k-istar as the network statistics. Models 1-4 include individual network statistics, such as arc and 2-istar, 3-istar, 4-istar. Models 5-11 include multiple network statistics. Tables 2(a) and 2(b) present results from the models for which convergence
criteria are met. The estimates of the model parameters along with their standard errors for models 1-6 are presented in Table 2(a). Tables 2(a) and 2(b) jointly contain the parameter estimates and their standard errors
Network Biology, 2014, 4(4): 155-169
IAEES www.iaees.org
similar as in TF-TF interaction model. The estimates of the parameters in individual network statistics models represent log-odds of regulation and those in the multiple network statistics models represent conditional
log-odds. We present probabilities of regulation for individual network statistics models in Table 3 for both TF-TF and TF-Operon interaction networks. Table 4 presents the probabilities of regulation for multiple network statistics models for both TF-TF and TF-Operon interaction networks. From these results we see that
the probability of regulation of one TF by another TF or of one operon by another operon is higher in models with higher istar network statistics.
Table 2a Estimates and standard errors of ERGM parameters for TF-Operon interactions: Models 1-6 and parts of models 7-11
Arc 2-istar 3-istar 4-istar
Est Sterr Est Sterr Est Sterr Est Sterr
Model 1 Model 2 Model 3 Model 4 Model 5 Model 6 Model 7 Model 8 Model 9 Model 10 Model 11 -6.237 -6.46 -6.24 -5.86 -5.79 -5.835 -5.813 -5.817 0.0252 2789 0.1989 0.00006 1056.6 364.01 37.902 130.8 -2.88 0.01 -0.17 -0.08 -0.83 -0.95 -1.05 -1 0.029 3.94 0.154 895.5 533.1 76.68 392.2 -3.84 0 0.17 0.09 1.06 1.05 1.55 1.47 0.000009 0.0003 0.0732 577.48 638.657 140.589 1002 -1.19 -0.04 -0.05 -0.75 -0.65 -1.7 -1.65 0.017 0.017 265.9 553.4 205.8 1979
Table 2b Estimates and standard errors of ERGM parameters for TF-Operon interactions: rest of the network statistics of
models 7-11.
5-istar 6-istar 7-istar 8-istar 9-istar
Est Sterr Est Sterr Est Sterr Est Sterr Est Sterr
Model 7 Model 8 Model 9 Model 10 Model 11 0.015 0.337 0.227 1.636 1.668 79.74 327.25 230.35 2966 -0.07 -0.01 -1.27 -1.38 12.03 122.6 188 3353 -0.02 0.682 0.08 22.767 101.23 2745 -0.187 -2.359 27.59
1480 8.68 403.3
Table 3 Estimated probabilities for regulation in individual network statistics models.
TF-TF interaction TF-Operon interaction
Log-odds Prob. Log-odds Prob.
Table 4 Estimated probabilities for regulation in multiple network statistics models.
Model: arc +2-istar+3-istar; varying stars as (0,0), (0,1), (1,0) and (2,2)
TF-TF
TF-Operon
None, None None, One One, None Two, Two
Log-odds Prob. Log-odds Prob. Log-odds Prob. Log-odds Prob.
-5.35
-6.46
0.0047
0.0016
-5.375
-6.46
0.0046
0.0016
-5.06
-6.45
0.0063
0.0016
-4.72
-6.44
0.0088
0.0016
It is to be noted that a similar set of network statistics fit both TF-TF and TF-Operon interaction networks. However, model fitting suffers from the convergence problems while we include both incoming and outgoing
star structures in the model along with other visible structures such as triangles.
3.3 Goodness of fit and Ostar models
It is important to investigate the performance of the exponential random graph models (ERGMs) in terms of how well these models fit the observed network. The parameters of an ERGM are estimated by the
approximated maximum likelihood method. Although a maximum likelihood estimator of may provide the best possible model among a particular class of models defined in equation (1) for a particular choice of a set of network statistics , it does not necessarily provide a good model in a practical sense (Hunter et al.,
2008). We present two goodness of fit statistics: Akaiki Information Criterion (AIC) and Bayesian Information Criterion (BIC) in Table 5. These are generated by the MCMC-MLE method of fitting of the ERGMs for TF-TF and TF-Operon interaction networks. AIC and BIC measure the relative goodness of fit of a statistical
model.The smaller the values of these statistics the better the fit of model to observed data. Model 6 (arc + 2- istar + 3- istar + 4- istar) and model 9 (arc + 2- istar + … +5-istar + 9- istar + 10-istar) fit the observed TF - TF interaction network well in terms of the AIC and BIC criteria as shown in Table 5.
Table 5 Goodness of fit statistics for TF-TF and TF-Operon interaction models.
TF-TF interaction TF-Operon interaction
AIC BIC AIC BIC
Model 1
Model 2
Model 3
Model 4
Model 5
Model 6
Model 7
Model 8
Model 9
Model 10
Model 11
Model 12
3025.1
4437.9
6041.4
7436.3
2966
2964
2968.3
2970.2
2968.4
3033.4
4446.2
6049.7
7444.7
2991
2997.3
3010
3020.1
3026.6
22771
29378
43430
48153
22704
22668
76718
22787
22697
22627
22775
81305
22783
29390
43441
48165
22739
22714
76776
22857
22779
22720
22879
IAEES In ord by using and 2(b) networks Inclusion the close
Fig. 2 Sim
arc, 2-ista
The g
in Fig. 3 geodesic in this c
connecte to compa
in simula
3-istar an which is
interactio 6. The bo
Mode TF-Oper fit diagn network arc, 2-ist line repr summari
der to visuali models 6 an
, we see the s generated b
n of other vis eness of the ob
mulated network r, 3-istar, and 4
goodness of f
3 reveals tha distance dist ase), whose
ed in this man are if the valu
ated network nd 4-istar) fi s the case in
on network of ottom plot in
el 6 (arc + 2
ron interaction nostics plots
by model 6
tar, 3-istar an resents the o ze the statisti
ize how well nd 9 in Fig. 2.
network stru by the best tw
sible structure bserved and s
ks by models 6 a 4-istar. b) Intera
fit is followed
at with the n tribution wel shortest conn
nner we defin ue of this stati
ks from our t the observe n both plots i
f E. coli and t Fig. 3 shows
2-istar + 3- is
n network we presented in
and 10. For i nd4-istar the observed stati ics for the sim
Network
these fits are . Comparing
ucture is appr wo models, i
es, that we w simulated net
and 9 for TF-TF action simulated
d by the diagn
network statis l. The geodes necting path
ne ∞. Th
istic observed
fitted model ed network w in Fig. 3. Th
the boxplots s even better f
star + 4-istar
ell in terms of Fig. 5 show
instance, the ERGM captu
istics for the mulated netw
Biology, 2014,
to the observ the observed
roximately si in terms of A
were not able tworks.
F interaction in d by network st
nostics plots
stics arc,
2-sic distance d is of length
he statistic ge d in the origin
. For examp well then the s
he solid line
summarize th fit by the mod
r) and model f the AIC and ws reasonably
top plot in F ures the minim
e TF-Operon works using m
4(4): 155-169
ved the netwo d TF-TF netw
imilar. Howe AIC and BIC
to do due to
E. coil. a) Inter tatistics: arc,
2-for models 6
istar, 3-istar
distribution is
k, where eodesic distan
nal network m
ple, if the sel solid line in F e represents t
he statistics fo del 9.
l 10 (arc + 2
d BIC criteria y good fit to
Fig. 5 demon mum geodesi
n interaction model 6. The
ork, we prese work in Fig. 1
ever, the clust C, model 6 a
the converge
raction simulate -istar, …., 5-ist
and 9 as sho
r and 4-istar
s the proporti
, , …If th nce is not in mimic the dis
lected netwo Fig. 3 will m the observed
for the simula
2-istar + … +
a as shown in o the observe
nstrates that w ic distance di
network of E
bottom plot i
w
nt the simula (a) with thos
ters are not v and model 9
ence issues, m
ed by network s tar, 9-istar and 1
own in Fig. 3.
the ERGM ion of pairs o he pairs of n
the ERGM. B stribution of v
ork statistics imic the boxp d statistics fo
ated networks
+ 8-istar) fit n Table 5. The
ed TF-Opero
with the netw istribution we
E. coli and in Fig. 5 show
www.iaees.org
ated networks e in Fig. 2(a)
visible in the respectively.
may improve
statistics an 10-istar.
The top plot
captures the of nodes (TFs nodes are not
But, we want values we get
(arc, 2-istar,
plots closely, or the TF-TF
s using model
the observed e goodness of n interaction
work statistics ell. The solid
by the m goodness
Fig. 3 Goo
model 6 an
Fig. 4 Sim
arc, 2-ist
model 10. In s of these fits
odness of Fit (G nd the bottom p
mulated networ tar, 3-istar, and
Fig. 4, we p s.
GOF) plots for m panel represents
rk by models 6 4-istar. b) Inte
present the s
models 6 and 9 s the GOF plot
and 10 for TF-raction simulat
imulated netw
for TF-TF inte for model 9.
-Operon interac ted by network
works by us
eraction in E. co
ction in E.coli. a statistics: an ar
ing models 6
oli. The top pan
a) Interaction si rc, 2-istar,….,
9-6 and 10 to
nel represents th
imulated by net -istar.
visualize the
he GOF plot for
twork statistics:
e
r
IAEES
Fig. 5 Goo
model 6 an
All t determin
k-ostar n TF-TF a model th
network
10-ostar.
2-ostar
observed
odness of fit pl nd the bottom p
the models d ned from the o
network statis and TF-Opero hat includes a
for TF-Oper . The goodne
…, 6-ostar, d TF-Operon
ots for models panel represents
discussed so observed netw
stics to the E on interaction
arc, 2-ostar, 3
ron interactio ess of fit diag
and 10-ostar
interaction ne
Network
6 and 10 for T s the GOF plot
far include works. To add
ERGMs. In F n networks. F
3-ostar, 4-osta
on by the m gnostics plots
r for TF-Ope etwork comp
Biology, 2014,
F-Operon inter for model 10.
arc and k-i
dress the dire
ig. 6, we pre Fig. 6(a) is a
ar, and 6-osta
model with th s in Fig. 7 sh
eron interact ared to that o
4(4): 155-169
raction in E. col
istar network ected regulato
esent simulate a simulated n
ar as the netw he network st
ow that the E
ion network of TF-TF inte
li. The top pane
k statistics f ory network o
ed networks network for work statistic
tatistics arc,
ERGM with t
(top panel) raction netwo
w el represents th
for different of E. coli, we
with k-ostar
TF-TF intera s. Fig. 6(b) is
2-ostar, …,
the network s
provide bett ork (bottom p
www.iaees.org he GOF plot for
k values as e also include
statistics for action by the s a simulated
6-ostar, and statistics arc, ter fit to the panel).
r
s e
r e d
d ,
e
Fig. 6 Sim network s 6-ostar an
Fig. 7 Goo
for TF-TF
mulated networ tatistics: arc, 2 nd 10-ostar.
odness of fit for interaction net
rks with k-istar 2-ostar, 3-ostar,
r TF-TF and TF twork and the b
r statistics for T r, 4-ostar and 6
F-Operon intera ottom panel rep
TF-TF and TF 6-ostar. b) Inter
action models w presents the GO
-Operon intera raction simulat
with k-ostar stat OF plot for TF-O
ction in E. col ted by network
tistics. The top Operon interact
li. a) Interaction k statistics: an
panel represent tion network.
n simulated by arc, 2-ostar,…,
ts the GOF plot y
Network Biology, 2014, 4(4): 155-169
IAEES www.iaees.org 4 Discussion
We explored a variety of Exponential Random Graph Models (ERGMs) to identify statistically significant
network motifs or small sub-networks in transcription regulatory networks of E. coli. The regulatory networks were obtained from the RegulonDB database (Release 7.4, 2012). Since the process of regulation is directed, we extended Saul and Filkov (2007) principles of implementation of ERGMs to the transcription regulatory
networks with network statistics appropriate for directed networks. A total of nine TF-TF ERGMs and eleven TF-Operon ERGMs were fitted with network statistics found in the observed network. The performance of
each model was examined using goodness of fit statistics to determine how well the ERGMs fit the observed biological network interactions. The results show that ERGMs with multiple k-istar network statistics and an arc term fit both the TF-TF and TF-Operon interaction networks well. Thus for TF-TF and TF-Operon
interaction networks, arc and k-istar, , can be considered as statistically significant network motifs. Although k-ostar, , statistics do well in fitting these interaction networks individually with the arc term, inclusion of both k-istar and k-ostar statistics leads to convergence problems in the estimation of model parameters. The ERGMs displayed a better fit for the observed TF-Operon networks with k-ostar statistics. This fit also aligns better with the biological context of how these networks function in the living organism.
Although ERGMs provide a simple and flexible principle of statistical modeling for regularity networks, there are several issues with computational algorithms in fitting the ERGMs. The first and foremost is the
convergence problem in MCMC MLE method in the presence of multiple network statistics, such as ostar,
triangle, istar and other higher order structure of subnetworks. We plan to address these issues of convergence problems and the possibility of extending the list of network motifs in our future work. Another possible
expansion may include exploring if the similar set of network motifs can be used to describe the transcription regulatory networks in other prokaryotic as well as higher eukaryotic model organisms.
References
Balaji S, Babu MM, Aravind L. 2007. Interplay between network structures, regulatory modes and sensing mechanisms of transcription factors in the transcriptional regulatory network of E. coli. Journal of Molecular Biology, 372: 1108-1122
Barabasi AL, Oltvai ZN. 2004. Network biology: Understanding the cell’s functional organization. Nature Reviews Genetics, 5: 101-113
Begum M, Bagga J, Blakey CA. 2012. Graphical modeling for high dimensional data, Journal of Modern Applied Statistical Methods, 11: 457-468
Besag J. 1975. Statistical Analysis of non-lattice data. Statistician, 24: 179-195
Costanzo M, Baryshnikova A, Bellay J, et al. 2010. The genetic landscape of the cell. Science, 327: 425-431 Erdˇos P, Rˇenyi A. 1960. On the evolution of random graphs. Publications of the Mathematical Institute of the
Hungarian Academy of Science, 5: 17-61
Frank O, Strauss D. 1986.Markov graphs. Journal of the American Statistical Association, 81: 832-842
Friedman N. 2004. Inferring cellular networks using probabilistic graphical models. Science, 303: 799-805 Gama-Castro S, Salgado H, Peralta-Gil M, et al. 2011. RegulonDB version7.0: transcriptional regulation of
Escherichia coli K-12 integrated within genetic sensory response units (Gensor Units). Nucleic Acids Research, 39: 98-105
Geyer CJ. 1991. Markov chain Monte Carlo maximum likelihood. In: Computing Science and Statistics:
Proceedings of the 23rd Symposium on the Interface, 156-163
Geyer CJ, Thompson EA. 1992. Constrained Monte Carlo maximum likelihood for dependent data. Journal of
the Royal Statistical Society Series B, 54: 657-699
Goodreau SM. 2007. Advances in exponential random graph models applied to a large social network. Social
Networks, 26: 231-248
Holland PW, Leinhardt S. 1981. An exponential family of probability distributions for directed graphs. Journal of the American Statistical Association, 76: 33-50
Hunter DR, Handcock MS, Butts CT, et al. 2008. ergm: A package to fit, simulate and diagnose exponential- family models for networks. Journal of Statistical Software, 24: 1-29
Martnez-Antonio A. 2011. Escherichia coli transcriptional regulatory network. Network Biology, 1: 21-33 Prˇzulj N, Corneil DG, Jurisica I. 2004. Modeling interactome: scale-free or geometric? Bioinformatics, 20:
3508-3515
RegulonDB Release 7.4. March 2012. http://regulondb.ccg.unam.mx/index.jsp
Robins G, Pattison P, Kalish Y, Lusher D. 2007. An introduction to exponential random graph (p*) models for
social networks. Social Networks, 29: 173-191
Saul ZM, Filkov V. 2007. Exploring biological network structure using exponential random graph models. Bioinformatics, 23: 2604-2611
Shen-Orr SS, Milo R, Mangan S, et al. 2002. Network motifs in the transcriptional regulation network of
Escherichia coli. Nature Genetics, 31: 64-68
Snijders TAB, Pattison PE, Robins GL, Handcock MS. 2006. New specifications for exponential random graph models. Sociological Methodology, 36: 99-153
Strauss D, Ikeda M. 1990. Pseudo-likelihood estimation for social networks, Journal of the American Statistical Association, 85: 204-212
Thieffry D, Huerta AM, Perez-Rueda E, Collado-Vides J. 1998. From specific gene regulation to genomic
networks: a global analysis of transcriptional regulation in Escherichia coli. Bioessays, 20: 433-440 Wasserman S, Pattison P. 1996. Logit models and logistic regressions for social networks: i. an introduction to
markov graphs and p . Psychometrika, 6: 401-425
Zhang WJ. 2011. Constructing ecological interaction networks by correlation analysis: hints from community sampling. Network Biology, 1(2): 81-98